ASRock DeskMini Z370 GTX1060 Review: A Compact Coffee Lake Gaming PC
by Ganesh T S on June 12, 2018 10:00 AM ESTGPU Performance - UL 3DMark and VRMark
UL's 3DMark comes with a diverse set of graphics workloads that target different Direct3D feature levels. Correspondingly, the rendering resolutions are also different. The VRMark benchmark targets virtual reality specifically. Its workloads are termed as 'rooms', with each one being a piece of VR content designed to require a specific level of VR performance. We used 3DMark 2.4.4264 and VRMark 1.2.1701 to get an idea of the graphics capabilities of various systems. In this section, we take a look at the performance of the ASRock DeskMini Z370 GTX1060 on a comparative basis across the different workloads.
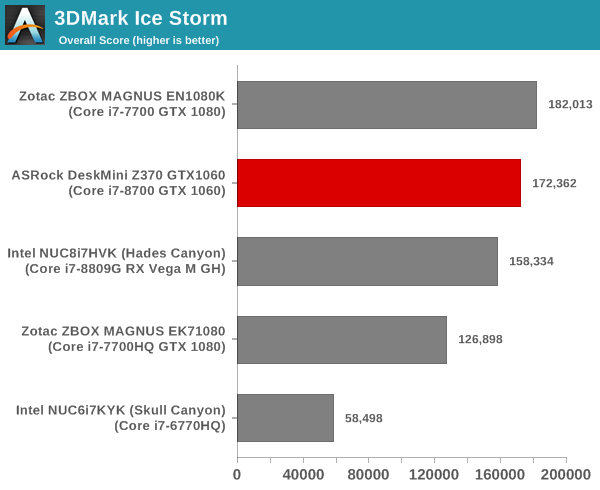
3DMark Ice Storm
This workload has three levels of varying complexity - the vanilla Ice Storm, Ice Storm Unlimited, and Ice Storm Extreme. It is a cross-platform benchmark (which means that the scores can be compared across different tablets and smartphones as well). All three use DirectX 11 (feature level 9) / OpenGL ES 2.0. While the Extreme renders at 1920 x 1080, the other two render at 1280 x 720. The graphs below present the various Ice Storm worloads' numbers for different systems that we have evaluated.
| UL 3DMark - Ice Storm Workloads | |||
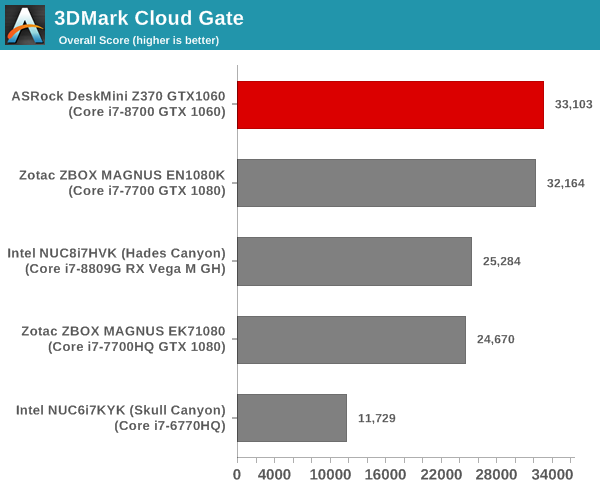
3DMark Cloud Gate
The Cloud Gate workload is meant for notebooks and typical home PCs, and uses DirectX 11 (feature level 10) to render frames at 1280 x 720. The graph below presents the overall score for the workload across all the systems that are being compared.
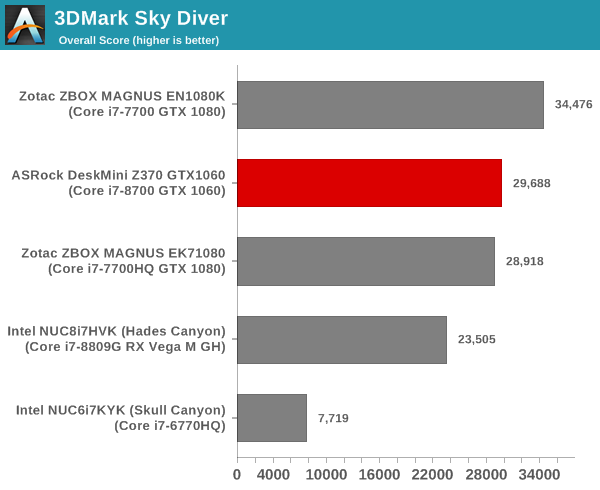
3DMark Sky Diver
The Sky Diver workload is meant for gaming notebooks and mid-range PCs, and uses DirectX 11 (feature level 11) to render frames at 1920 x 1080. The graph below presents the overall score for the workload across all the systems that are being compared.
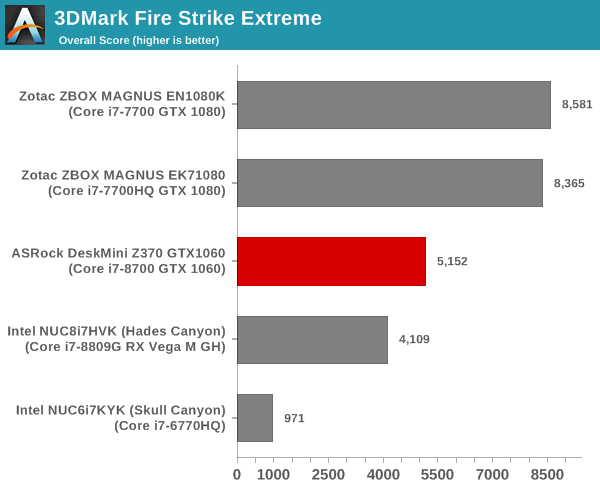
3DMark Fire Strike Extreme
The Fire Strike benchmark has three workloads. The base version is meant for high-performance gaming PCs. Similar to Sky Diver, it uses DirectX 11 (feature level 11) to render frames at 1920 x 1080. The Ultra version targets 4K gaming system, and renders at 3840 x 2160. However, we only deal with the Extreme version in our benchmarking - It renders at 2560 x 1440, and targets multi-GPU systems and overclocked PCs. The graph below presents the overall score for the Fire Strike Extreme benchmark across all the systems that are being compared.
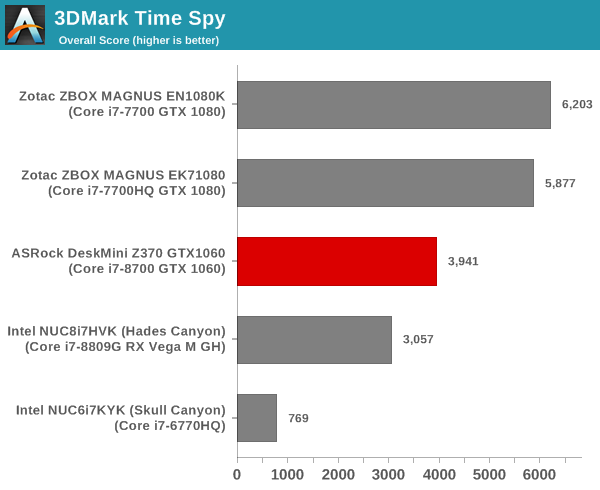
3DMark Time Spy
The Time Spy workload has two levels with different complexities. Both use DirectX 12 (feature level 11). However, the plain version targets high-performance gaming PCs with a 2560 x 1440 render resolution, while the Extreme version renders at 3840 x 2160 resolution. The graphs below present both numbers for all the systems that are being compared in this review.
| UL 3DMark - Time Spy Workloads | |||
The VRMark Professional Edition v1.2.1701 comes with three rooms. Each room can be run either in desktop or HMD mode, with varying minimum requirements for the same workload. The benchmark results include the average FPS achieved, and a score based on the FPS. A pass or fail indicator is also provided based on whether the average FPS exceeds the required FPS. In this section, we take a look at the performance of the ASRock DeskMini Z370 GTX1060 on a comparative basis across the three workloads in desktop mode.
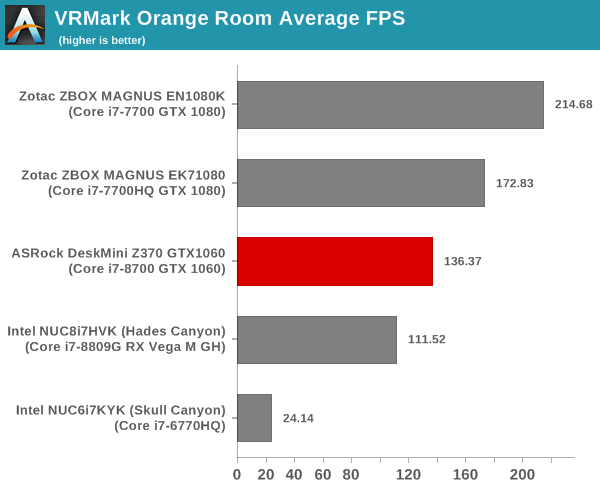
VRMark Orange Room
The Orange Room is meant to test the effectiveness of a system for handling the requirements of the HTC Vive and the Oculus Rift. The recommended hardware for both VR HMDs should be able to easily achieve the desired target FPS (88.9 fps). However, in the desktop mode, the target performance is 109 fps without any frame drops. Systems benching with an average FPS lesser than that are deemed to have failed the VRMark Orange Room benchmark. The graphs below present the average FPS and score for the different systems being considered today.
| UL VRMark - Orange Room | |||
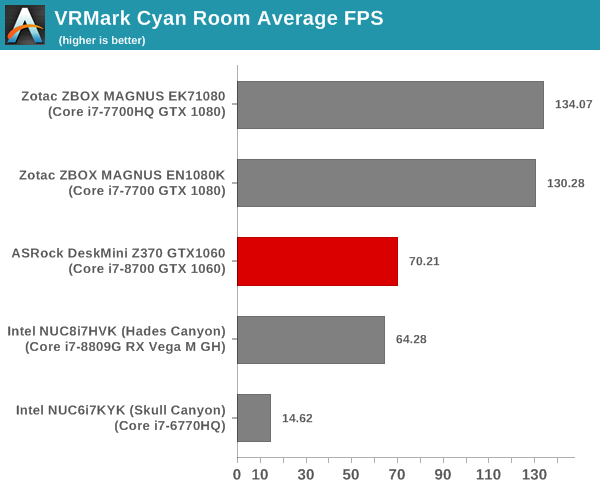
VRMark Cyan Room
The Cyan Room sits between the Orange and Blue rooms in complexity. It is a DirectX 12 benchmark. Similar to the Orange room, the target metrics are 88.9 fps on HMDs and 109 fps on the desktop monitor. The graphs below present the average FPS and score for the different systems being considered today.
| UL VRMark - Cyan Room | |||
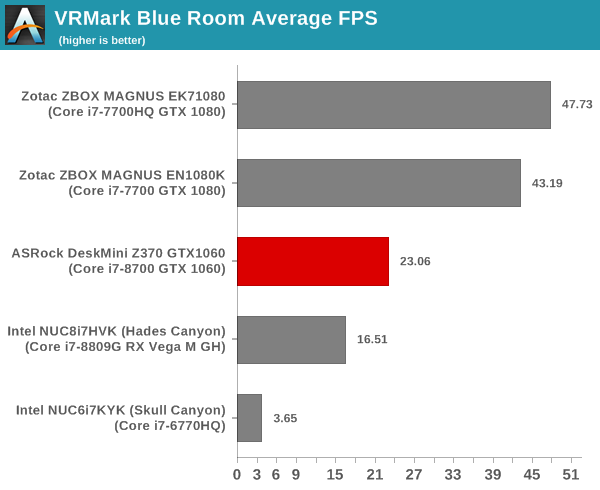
VRMark Blue Room
The Blue Room is the most demanding of the three workloads. At the time of introduction of VRMark in October 2016, no publicly available system running as sold was able to pass the test. The performance of a system in this benchmark is an indicator of its VR-readiness for future generation of HMDs. Similar to the other workloads, the passing performance metrics are 88.9 fps on HMDs and 109 fps on desktop monitors. The complexity of the workload is due to the higher resolution (5012 x 2880) and additional geometry making it necessary to increase the number of Direct3D API calls. The graphs below present the average FPS and score for the different systems being considered today.
| UL VRMark - Blue Room | |||
Overall, we find the DeskMini Z370 GTX1060 come behind the PCs equipped with the GTX 1080 in almost all of the workloads.


20 Comments
View All Comments