The Intel Optane Memory M10 (64GB) Review: Optane Caching Refreshed
by Billy Tallis on May 15, 2018 10:45 AM EST- Posted in
- SSDs
- Storage
- Intel
- PCIe SSD
- SSD Caching
- M.2
- NVMe
- Optane
- Optane Memory
BAPCo SYSmark 2014 SE
BAPCo's SYSmark 2014 SE is an application-based benchmark that uses real-world applications to replay usage patterns of business users in the areas of office productivity, media creation and data/financial analysis. In addition, it also addresses the responsiveness aspect which deals with user experience as related to application and file launches, multi-tasking etc. Scores are calibrated against a reference system that is defined to score 1000 in each of the scenarios. A score of, say, 2000, would imply that the system under test is twice as fast as the reference system.
SYSmark scores are based on total application response time as seen by the user, including not only storage latency but time spent by the processor. This means there's a limit to how much a storage improvement could possibly increase scores, because the SSD is only in use for a small fraction of the total test duration. This is a significant difference from our ATSB tests where only the storage portion of the workload is replicated and disk idle times are cut short to a maximum of 25ms.
For this review, SYSmark has been used on two different machines: a relatively high-end system with a six-core Intel Core i7-8700K processor and 16GB of RAM, and a more limited system with a quad-core Intel Core i5-7400 processor and just 4GB of RAM. The low-end system spends a lot of time swapping thanks to its small amount of RAM, and this adds greatly to the storage workload.
| AnandTech SYSmark SSD Testbed | |
| CPU | Intel Core i7-8700K |
| Motherboard | Gigabyte Aorus H370 Gaming 3 WiFi |
| Chipset | Intel H370 |
| Memory | 2x 8GB Kingston DDR4-2666 |
| Case | In Win C583 |
| Power Supply | Cooler Master G550M |
| OS | Windows 10 64-bit, version 1709 |
| AnandTech SYSmark SSD Low-End Testbed | |
| CPU | Intel Core i5-7400 |
| Motherboard | ASUS PRIME Z270-A |
| Chipset | Intel Z270 |
| Memory | 1x 4GB Corsair DDR4-2666 |
| Case | In Win C583 |
| Power Supply | Cooler Master G550M |
| OS | Windows 10 64-bit, version 1709 |
None of the Optane Memory modules are large enough to serve as a Windows boot drive alone as well as storing all the applications used for SYSmark, so this section only tests the Optane Memory and Optane SSD 800P as cache drives. (The 118GB Optane SSD 800P is pretty much the smallest drive that can could run SYSmark, but it doesn't leave much room for user data.)
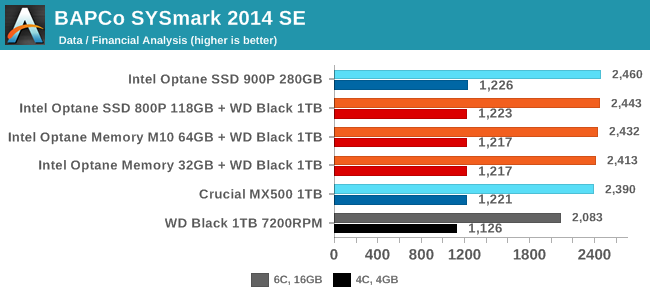
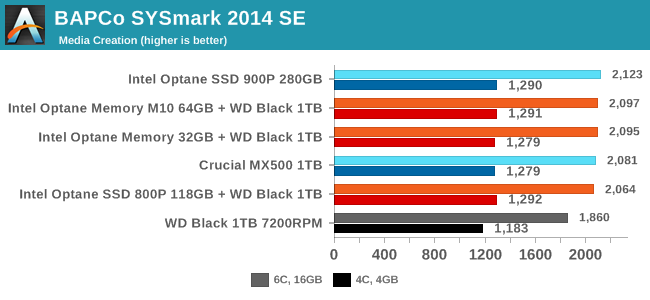
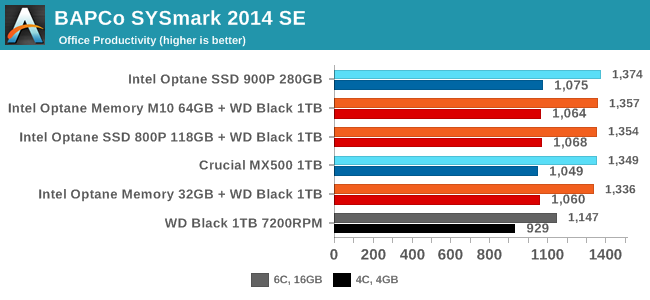
The Data/Financial Analysis, Media Creation, and Office Productivity sub-tests are all relatively insensitive to storage performance, and they are shown in order of decreasing sensitivity to the CPU and RAM differences between the two test systems. These results show that a mechanical hard drive can hold back application performance, but almost any solid state storage system—including Optane Memory caching—is sufficient to shift the bottlenecks over to compute and memory.
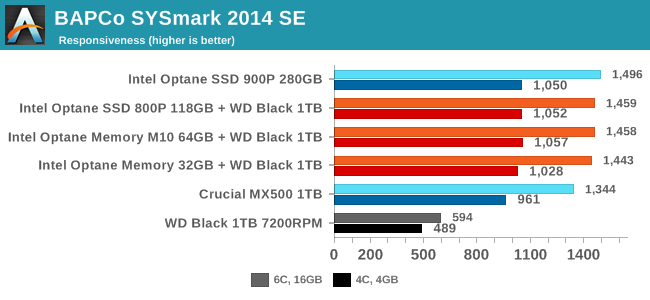
The Responsiveness test is less focused on overall computational throughput and more on those annoying delays that make a computer feel slow: application launching, opening and saving files, and a variety of multitasking scenarios. Here, moving off a mechanical hard drive is by far the best upgrade that can be made to improve system performance. Going beyond a mainstream SATA SSD provides diminishing returns, but there is a measurable difference between the SATA SSD and the fastest Optane SSD.
Energy Usage
The SYSmark energy usage scores measure total system power consumption, excluding the display. Our SYSmark test system idles at around 26 W and peaks at over 60 W measured at the wall during the benchmark run. SATA SSDs seldom exceed 5 W and idle at a fraction of a watt, and the SSDs spend most of the test idle. This means the energy usage scores will inevitably be very close. A typical notebook system will tend to be better optimized for power efficiency than this desktop system, so the SSD would account for a much larger portion of the total and the score difference between SSDs would be more noticeable.
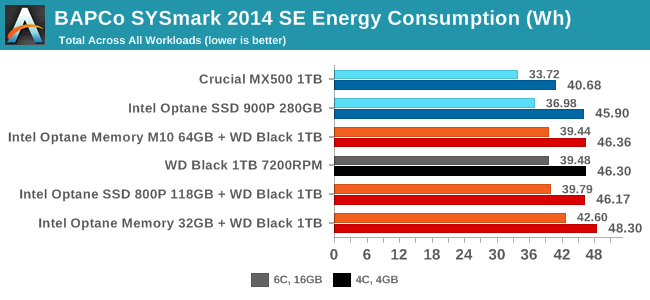
The Intel Optane SSD 900P is quite power-hungry by SSD standards, but running a hard drive is even worse. The Optane Memory M10 and 118GB 800P further add to power consumption when used as cache devices, but they speed up the test enough that total energy usage is not significantly affected. The 32GB Optane Memory doesn't offer as much of a performance boost, and it lacks the power management capabilities of the more recent Optane M.2 drives.


96 Comments
View All Comments
jordanclock - Wednesday, May 16, 2018 - link
Yeah, 64GB is ~59GiB.IntelUser2000 - Tuesday, May 15, 2018 - link
Billy,Could you tell us why the performance is much lower? I was thinking Meltdown but 800P article says it has the patch enabled. The random performance here is 160MB/s for 800P, but on the other article it gets 600MB/s.
Billy Tallis - Tuesday, May 15, 2018 - link
The synthetic benchmarks in this review were all run under Windows so that they could be directly compared to results from the Windows-only caching drivers. My other reviews use Linux for the synthetic benchmarks. At the moment I'm not sure if the big performance disparity is due entirely to Windows limitations, or if there's some system tuning I could do to Windows to bring performance back up. My Linux testbed is set up to minimize OS overhead, but the Windows images used for this reivew were all stock out of the box settings.IntelUser2000 - Tuesday, May 15, 2018 - link
What is used for the random tests? IOmeter?Billy Tallis - Tuesday, May 15, 2018 - link
FIO version 3.6, Windows binaries from https://bluestop.org/fio/ (and Linux binaries compiled locally, for the other reviews). The only fio settings that had to change when moving the scripts from Linux to Windows was the ioengine option for selecting which APIs to use for IO. On Linux, QD1 tests are done with synchronous IO and higher queue depths with libaio, and on Windows all the queue depths used asynchronous IO.In this review I also didn't bother secure erasing the drives between running the burst and sustained tests, but that shouldn't matter much for these drives.
IntelUser2000 - Tuesday, May 15, 2018 - link
So looking at the original Optane Memory review, the loss must be due to Meltdown as it also gets 400MB/s.Billy Tallis - Tuesday, May 15, 2018 - link
The Meltdown+Spectre workarounds don't have anywhere near this kind of impact on Linux, so I don't think that's a sufficient explanation for what's going on with this review's Windows results.Last year's Optane Memory review only did synthetic benchmarks of the drive as a standalone device, not in a caching configuration because the drivers only supported boot drive acceleration at that time.
IntelUser2000 - Tuesday, May 15, 2018 - link
The strange performance may also explain why its sometimes faster in caching than when its standalone.Certainly the drive is capable of faster than that looking at raw media performance.
My point with the last review was that, whether its standalone or not, the drive on the Optane Memory review is getting ~400MB/s, while in this review its getting 160MB/s.
tuxRoller - Wednesday, May 16, 2018 - link
As Billy said you're comparing the results from two different OSs'Intel999 - Tuesday, May 15, 2018 - link
Will there be a comparison between the uber expensive Intel approach to sped up boot times with AMD's free approach using StorageMI?