The AMD 2nd Gen Ryzen Deep Dive: The 2700X, 2700, 2600X, and 2600 Tested
by Ian Cutress on April 19, 2018 9:00 AM ESTImprovements to the Cache Hierarchy
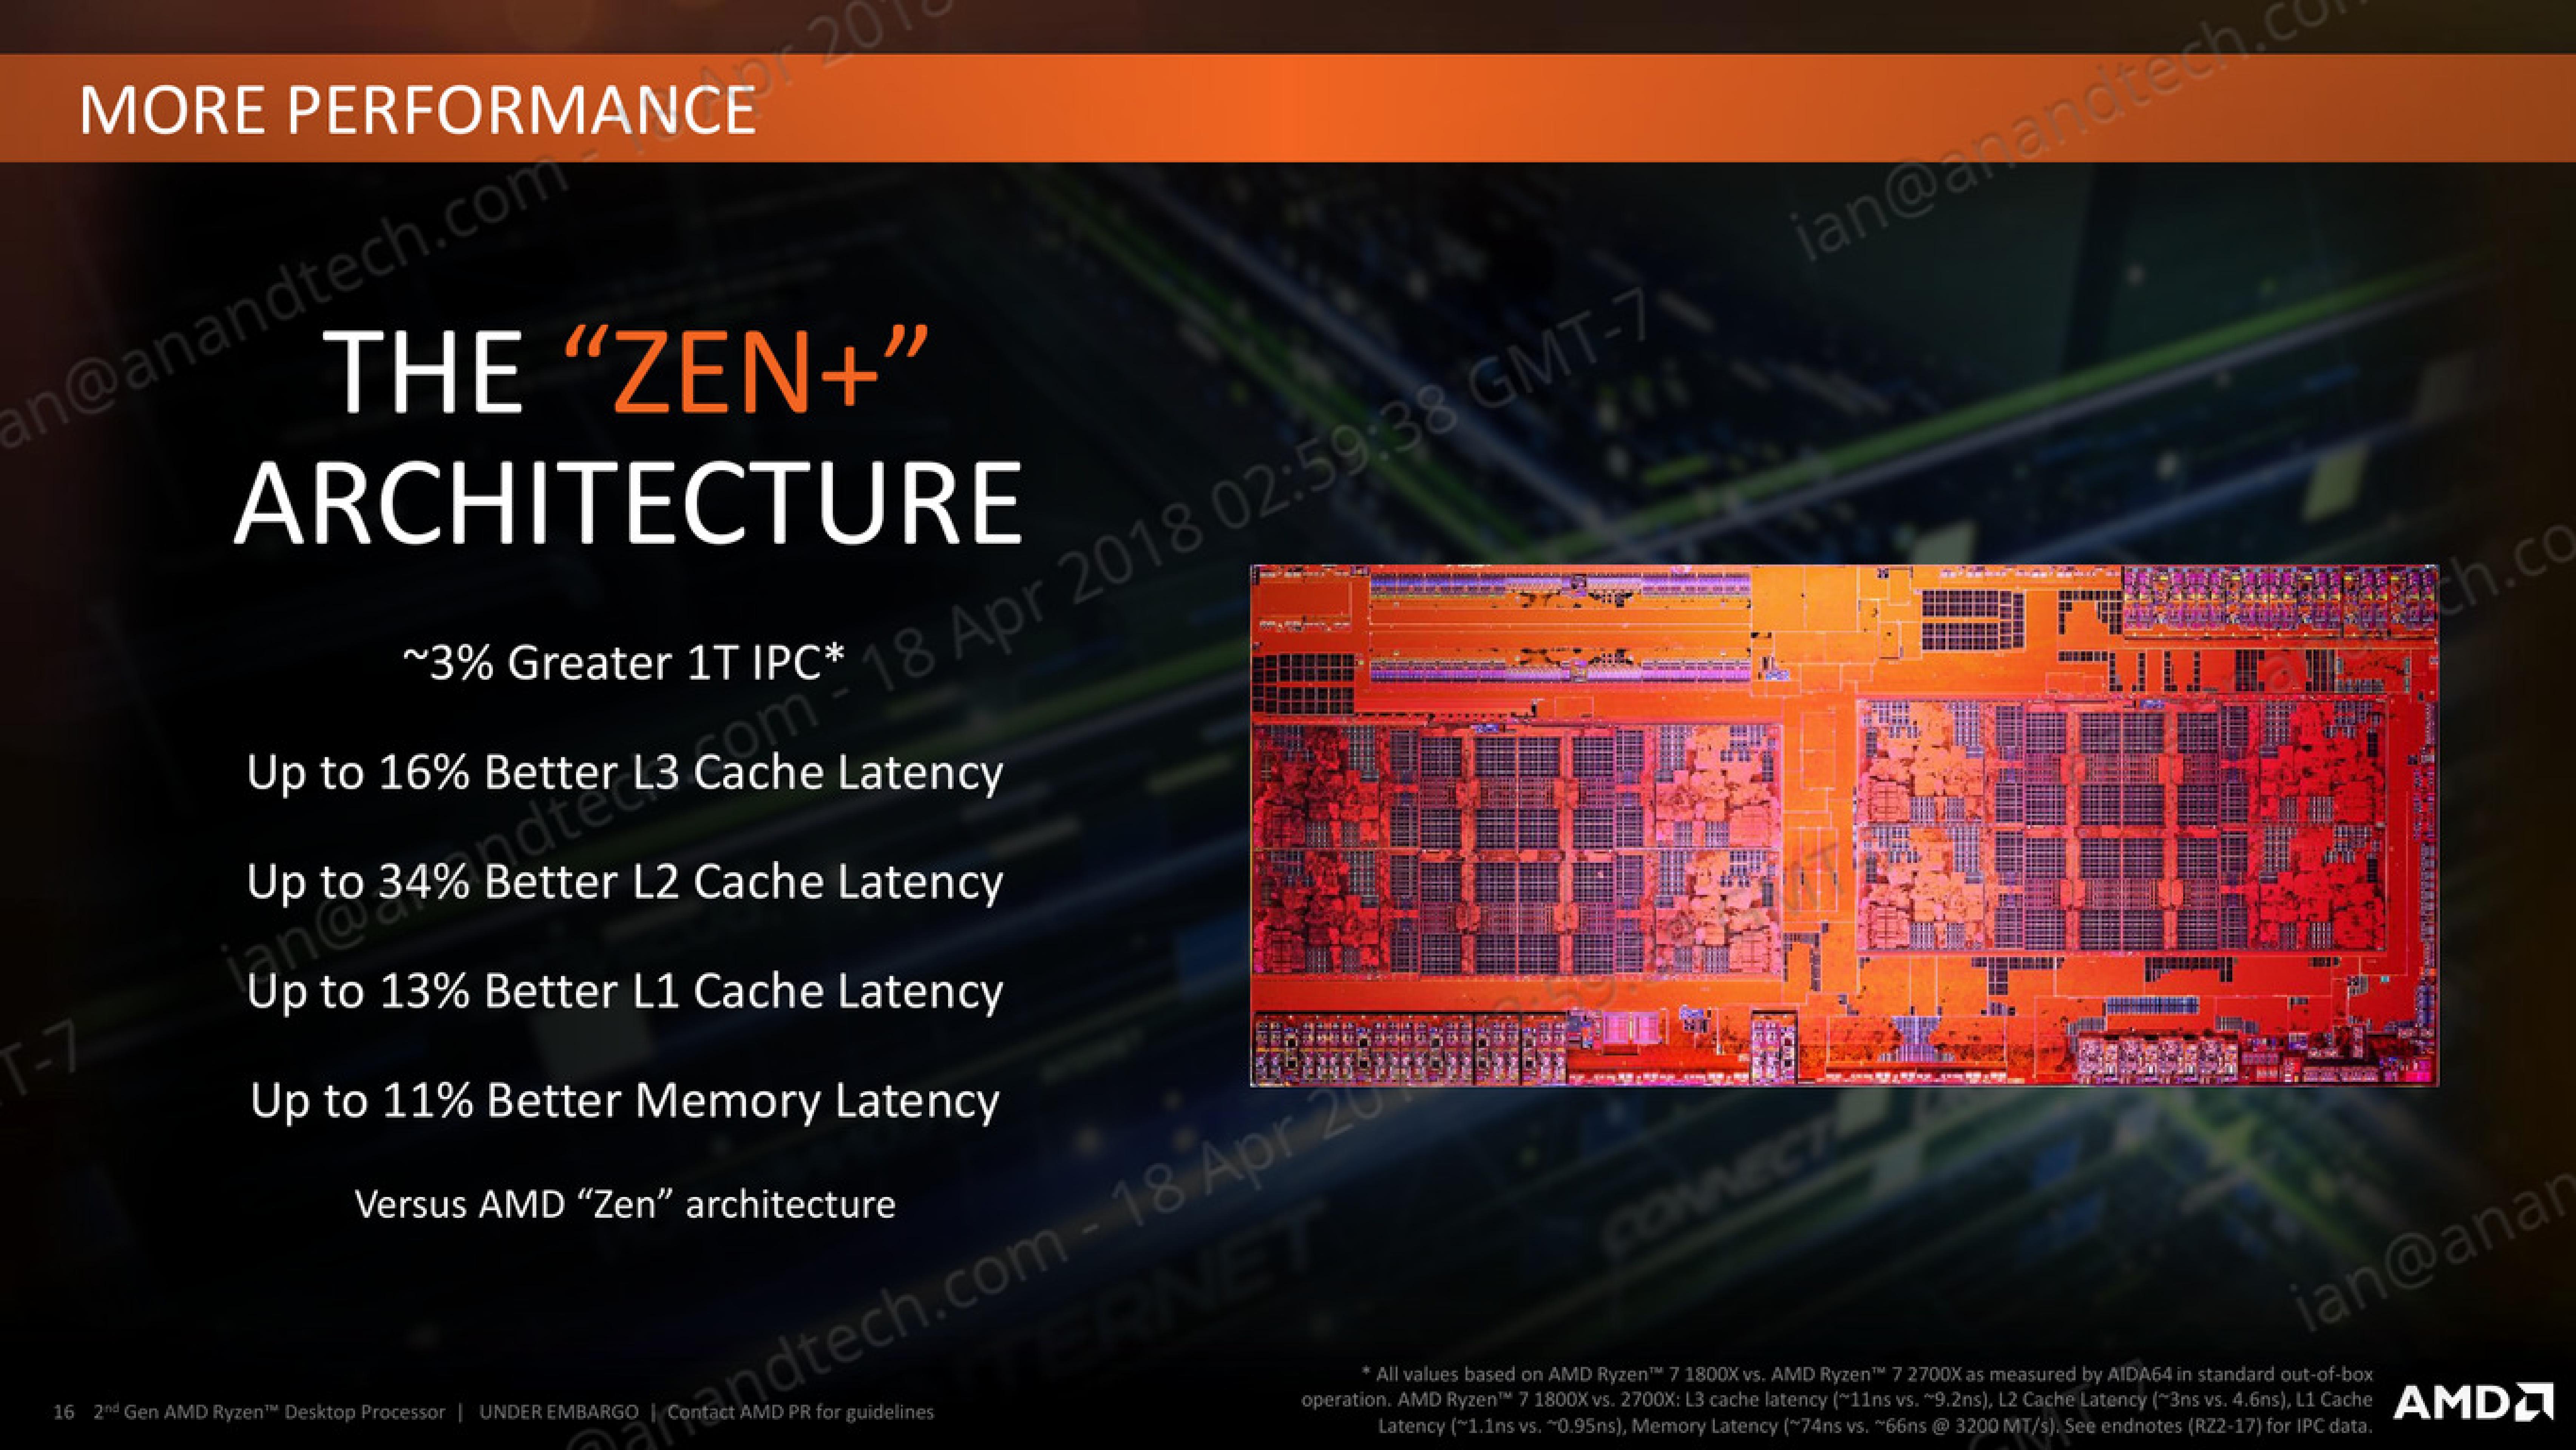
The biggest under-the-hood change for the Ryzen 2000-series processors is in the cache latency. AMD is claiming that they were able to knock one-cycle from L1 and L2 caches, several cycles from L3, and better DRAM performance. Because pure core IPC is intimately intertwined with the caches (the size, the latency, the bandwidth), these new numbers are leading AMD to claim that these new processors can offer a +3% IPC gain over the previous generation.
The numbers AMD gives are:
- 13% Better L1 Latency (1.10ns vs 0.95ns)
- 34% Better L2 Latency (4.6ns vs 3.0ns)
- 16% Better L3 Latency (11.0ns vs 9.2ns)
- 11% Better Memory Latency (74ns vs 66ns at DDR4-3200)
- Increased DRAM Frequency Support (DDR4-2666 vs DDR4-2933)
It is interesting that in the official slide deck AMD quotes latency measured as time, although in private conversations in our briefing it was discussed in terms of clock cycles. Ultimately latency measured as time can take advantage of other internal enhancements; however a pure engineer prefers to discuss clock cycles.
Naturally we went ahead to test the two aspects of this equation: are the cache metrics actually lower, and do we get an IPC uplift?
Cache Me Ousside, How Bow Dah?
For our testing, we use a memory latency checker over the stride range of the cache hierarchy of a single core. For this test we used the following:
- Ryzen 7 2700X (Zen+)
- Ryzen 5 2400G (Zen APU)
- Ryzen 7 1800X (Zen)
- Intel Core i7-8700K (Coffee Lake)
- Intel Core i7-7700K (Kaby Lake)
The most obvious comparison is between the AMD processors. Here we have the Ryzen 7 1800X from the initial launch, the Ryzen 5 2400G APU that pairs Zen cores with Vega graphics, and the new Ryzen 7 2700X processor.
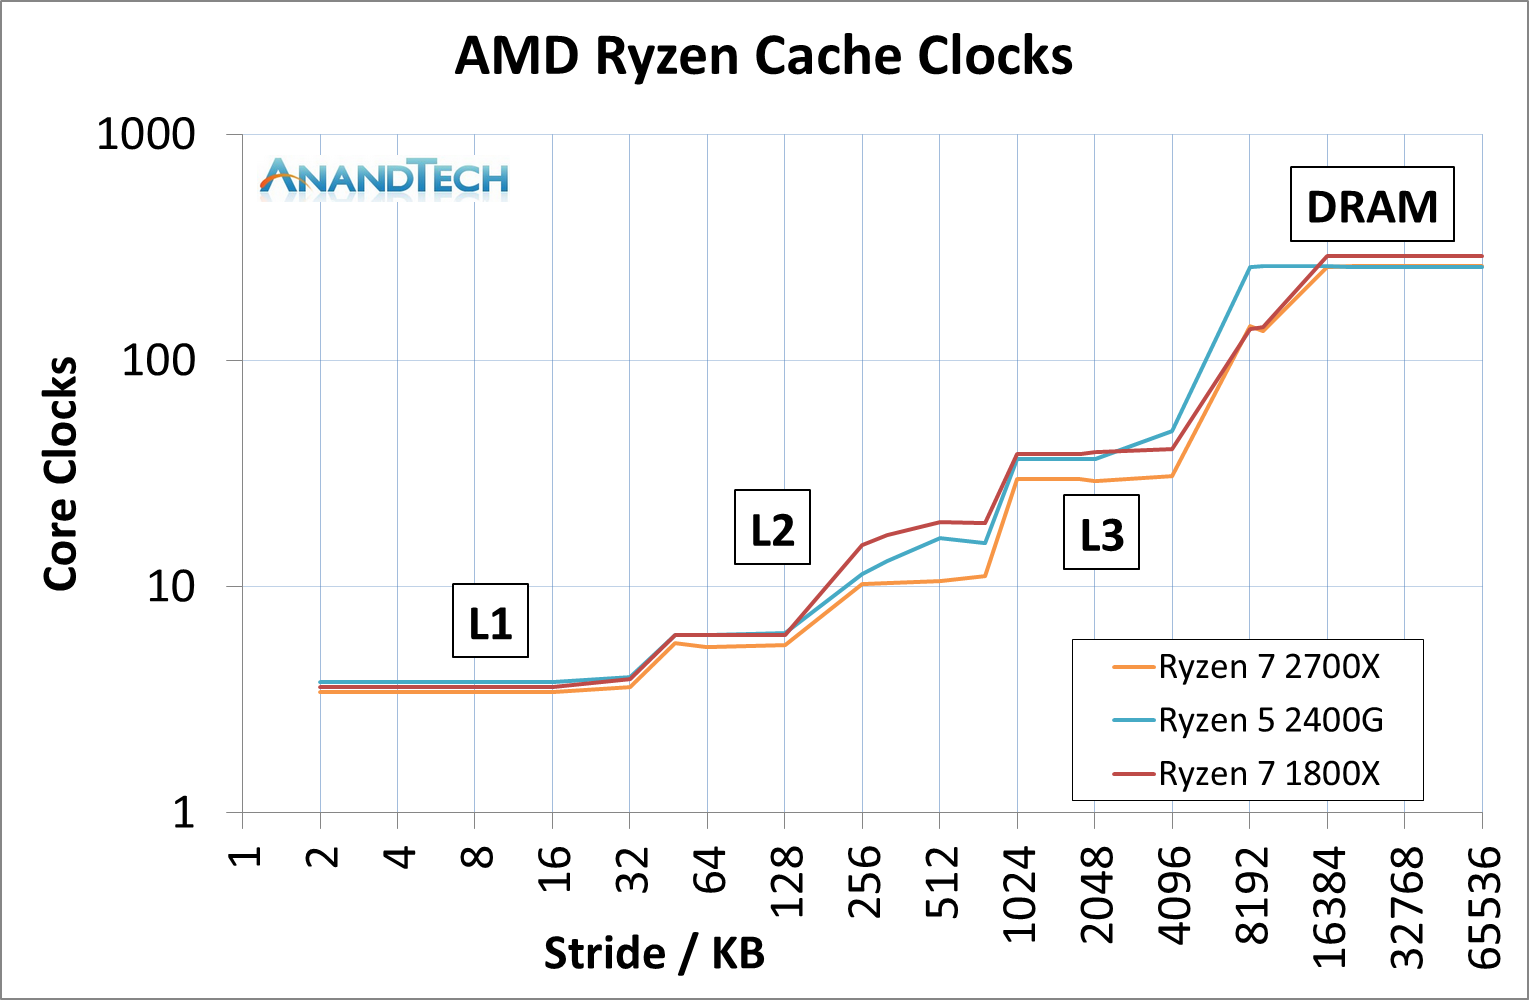
This graph is logarithmic in both axes.
This graph shows that in every phase of the cache design, the newest Ryzen 7 2700X requires fewer core clocks. The biggest difference is on the L2 cache latency, but L3 has a sizeable gain as well. The reason that the L2 gain is so large, especially between the 1800X and 2700X, is an interesting story.
When AMD first launched the Ryzen 7 1800X, the L2 latency was tested and listed at 17 clocks. This was a little high – it turns out that the engineers had intended for the L2 latency to be 12 clocks initially, but run out of time to tune the firmware and layout before sending the design off to be manufactured, leaving 17 cycles as the best compromise based on what the design was capable of and did not cause issues. With Threadripper and the Ryzen APUs, AMD tweaked the design enough to hit an L2 latency of 12 cycles, which was not specifically promoted at the time despite the benefits it provides. Now with the Ryzen 2000-series, AMD has reduced it down further to 11 cycles. We were told that this was due to both the new manufacturing process but also additional tweaks made to ensure signal coherency. In our testing, we actually saw an average L2 latency of 10.4 cycles, down from 16.9 cycles in on the Ryzen 7 1800X.
The L3 difference is a little unexpected: AMD stated a 16% better latency: 11.0 ns to 9.2 ns. We saw a change from 10.7 ns to 8.1 ns, which was a drop from 39 cycles to 30 cycles.
Of course, we could not go without comparing AMD to Intel. This is where it got very interesting. Now the cache configurations between the Ryzen 7 2700X and Core i7-8700K are different:
| CPU Cache uArch Comparison | ||
| AMD Zen (Ryzen 1000) Zen+ (Ryzen 2000) |
Intel Kaby Lake (Core 7000) Coffee Lake (Core 8000) |
|
| L1-I Size | 64 KB/core | 32 KB/core |
| L1-I Assoc | 4-way | 8-way |
| L1-D Size | 32 KB/core | 32 KB/core |
| L1-D Assoc | 8-way | 8-way |
| L2 Size | 512 KB/core | 256 KB/core |
| L2 Assoc | 8-way | 4-way |
| L3 Size | 8 MB/CCX (2 MB/core) |
2 MB/core |
| L3 Assoc | 16-way | 16-way |
| L3 Type | Victim | Write-back |
AMD has a larger L2 cache, however the AMD L3 cache is a non-inclusive victim cache, which means it cannot be pre-fetched into unlike the Intel L3 cache.
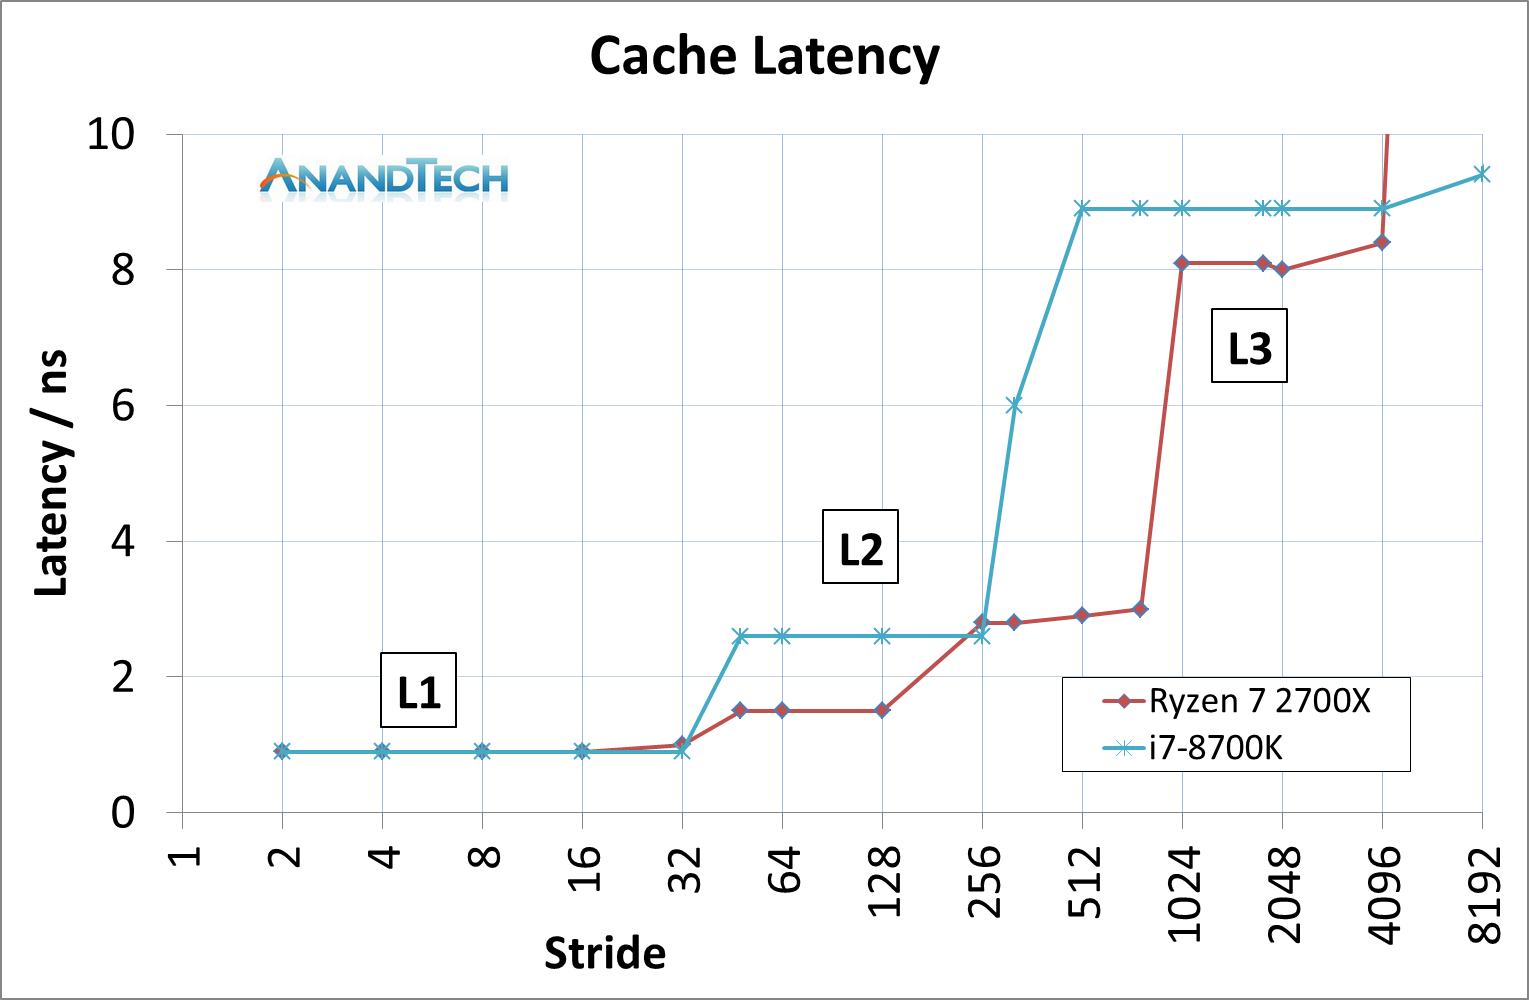
This was an unexpected result, but we can see clearly that AMD has a latency timing advantage across the L2 and L3 caches. There is a sizable difference in DRAM, however the core performance metrics are here in the lower caches.
We can expand this out to include the three AMD chips, as well as Intel’s Coffee Lake and Kaby Lake cores.

This is a graph using cycles rather than timing latency: Intel has a small L1 advantage, however the larger L2 caches in AMD’s Zen designs mean that Intel has to hit the higher latency L3 earlier. Intel makes quick work of DRAM cycle latency however.


545 Comments
View All Comments
bsp2020 - Thursday, April 19, 2018 - link
Was AMD's recently announced Spectre mitigation used in the testing? I'm sorry if it was mentioned in the article. Too long and still in the process of reading.I'm a big fan of AMD but want to make sure the comparison is apples to apples. BTW, does anyone have link to performance impact analysis of AMD's Spectre mitigation?
fallaha56 - Thursday, April 19, 2018 - link
Yep, X470 is microcode parchedThis article as it stands is Intel Fanboi stuff
fallaha56 - Thursday, April 19, 2018 - link
As in the Toms articleSaturnusDK - Thursday, April 19, 2018 - link
Maybe he didn't notice that the tests are at stock speeds?DCide - Friday, April 20, 2018 - link
I can't find any other site using a BIOS as recent as the 0508 version you used (on the ASUS Crosshair VII Hero). Most sites are using older versions. These days, BIOS updates surrounding processor launches make significant performance differences. We've seen this with every Intel and AMD CPU launch since the original Ryzen.Shaheen Misra - Sunday, April 22, 2018 - link
Hi , im looking to gain some insight into your testing methods. Could you please explain why you test at such high graphics settings? Im sure you have previously stated the reasons but i am not familiar with them. My understanding has always been that this creates a graphics bottleneck?Targon - Monday, April 23, 2018 - link
When you consider that people want to see benchmark results how THEY would play the games or do work, it makes sense to focus on that sort of thing. Who plays at a 720p resolution? Yes, it may show CPU performance, or eliminate the GPU being the limiting factor, but if you have a Geforce 1080 GTX, 1080p, 1440, and then 4k performance is what people will actually game at.The ability to actually run video cards at or near their ability is also important, which can be a platform issue. If you see every CPU showing the same numbers with the same video card, then yea, it makes sense to go for the lower settings/resolutions, but since there ARE differences between the processors, running these tests the way they are makes more sense from a "these are similar to what people will see in the real world" perspective.
FlashYoshi - Thursday, April 19, 2018 - link
Intel CPUs were tested with Meltdown/Spectre patches, that's probably the discrepancy you're seeing.MuhOo - Thursday, April 19, 2018 - link
Computerbase and pcgameshardware also used the patched... every other site has completely different results from anandtechsor - Thursday, April 19, 2018 - link
Fwiw I took five minutes to see what you guys are talking about. To me it looks like Toms is screwed up. If you look at the time graphs it looks to me like it’s the purple line on top most of the time, but the summaries have that CPU in 3rd or 4th place. E.G. https://img.purch.com/r/711x457/aHR0cDovL21lZGlhLm...At any rate things are generally damn close, and they largely aren’t even benchmarking the same games, so I don’t understand why a few people are complaining.