The AMD 2nd Gen Ryzen Deep Dive: The 2700X, 2700, 2600X, and 2600 Tested
by Ian Cutress on April 19, 2018 9:00 AM ESTCPU Rendering Tests
Rendering tests are a long-time favorite of reviewers and benchmarkers, as the code used by rendering packages is usually highly optimized to squeeze every little bit of performance out. Sometimes rendering programs end up being heavily memory dependent as well - when you have that many threads flying about with a ton of data, having low latency memory can be key to everything. Here we take a few of the usual rendering packages under Windows 10, as well as a few new interesting benchmarks.
All of our benchmark results can also be found in our benchmark engine, Bench.
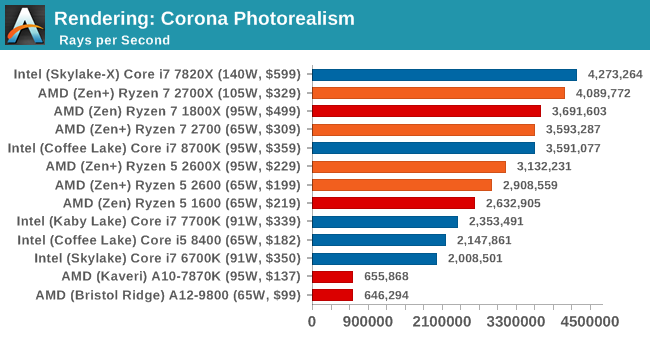
Corona 1.3: link
Corona is a standalone package designed to assist software like 3ds Max and Maya with photorealism via ray tracing. It's simple - shoot rays, get pixels. OK, it's more complicated than that, but the benchmark renders a fixed scene six times and offers results in terms of time and rays per second. The official benchmark tables list user submitted results in terms of time, however I feel rays per second is a better metric (in general, scores where higher is better seem to be easier to explain anyway). Corona likes to pile on the threads, so the results end up being very staggered based on thread count.
Blender 2.78: link
For a render that has been around for what seems like ages, Blender is still a highly popular tool. We managed to wrap up a standard workload into the February 5 nightly build of Blender and measure the time it takes to render the first frame of the scene. Being one of the bigger open source tools out there, it means both AMD and Intel work actively to help improve the codebase, for better or for worse on their own/each other's microarchitecture.
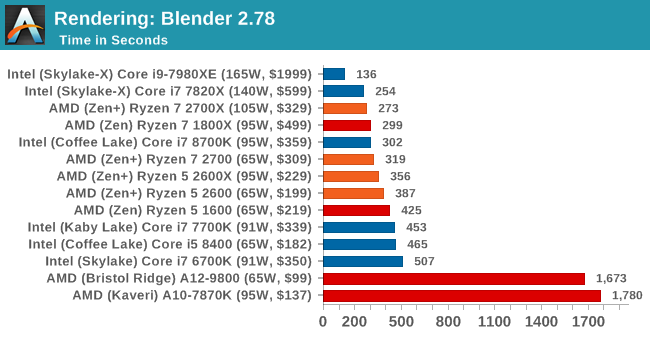
This is one multi-threaded test where the 8-core Skylake-based Intel processor wins against the new AMD Ryzen 7 2700X; the variable threaded nature of Blender means that the mesh architecture and memory bandwidth work well here. On a price/parity comparison, the Ryzen 7 2700X easily takes the win from the top performers. Users with the Core i7-6700K are being easily beaten by the Ryzen 5 2600.
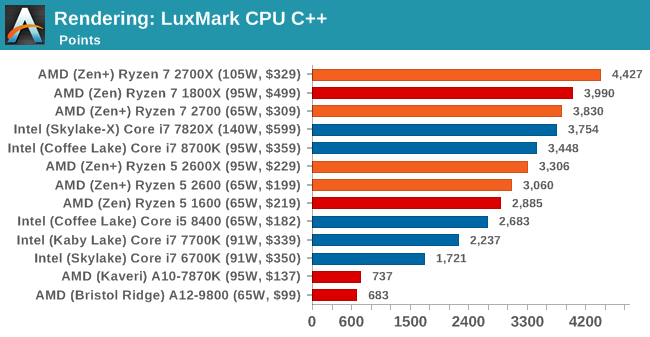
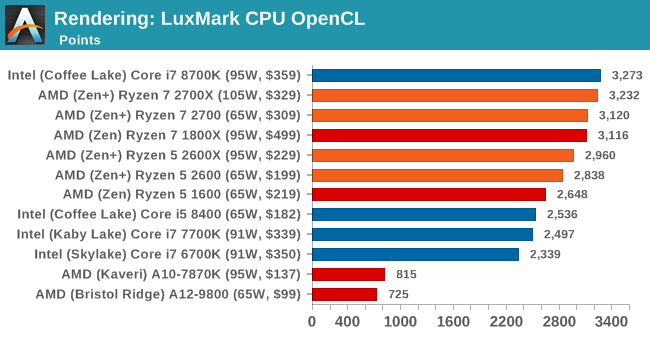
LuxMark v3.1: Link
As a synthetic, LuxMark might come across as somewhat arbitrary as a renderer, given that it's mainly used to test GPUs, but it does offer both an OpenCL and a standard C++ mode. In this instance, aside from seeing the comparison in each coding mode for cores and IPC, we also get to see the difference in performance moving from a C++ based code-stack to an OpenCL one with a CPU as the main host.
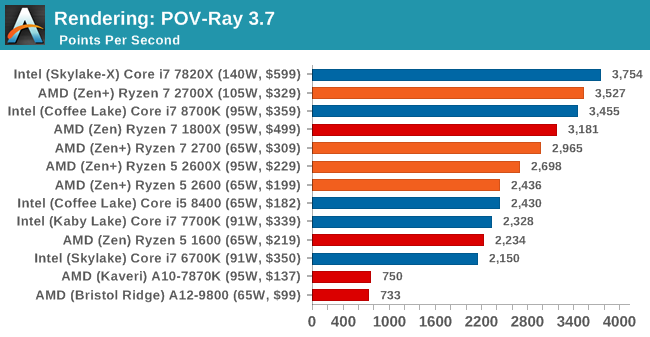
POV-Ray 3.7.1b4: link
Another regular benchmark in most suites, POV-Ray is another ray-tracer but has been around for many years. It just so happens that during the run up to AMD's Ryzen launch, the code base started to get active again with developers making changes to the code and pushing out updates. Our version and benchmarking started just before that was happening, but given time we will see where the POV-Ray code ends up and adjust in due course.
Cinebench R15: link
The latest version of CineBench has also become one of those 'used everywhere' benchmarks, particularly as an indicator of single thread performance. High IPC and high frequency gives performance in ST, whereas having good scaling and many cores is where the MT test wins out.
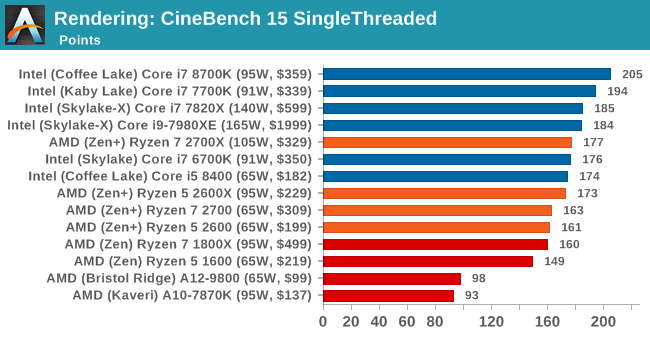
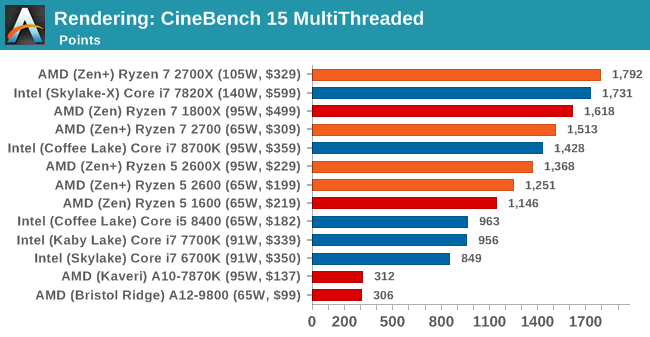
Intel is still the single thread champion in benchmarks like CineBench, but it would appear that the Ryzen 7 2700X is now taking the lead in the multithreaded test.


545 Comments
View All Comments
bsp2020 - Thursday, April 19, 2018 - link
Was AMD's recently announced Spectre mitigation used in the testing? I'm sorry if it was mentioned in the article. Too long and still in the process of reading.I'm a big fan of AMD but want to make sure the comparison is apples to apples. BTW, does anyone have link to performance impact analysis of AMD's Spectre mitigation?
fallaha56 - Thursday, April 19, 2018 - link
Yep, X470 is microcode parchedThis article as it stands is Intel Fanboi stuff
fallaha56 - Thursday, April 19, 2018 - link
As in the Toms articleSaturnusDK - Thursday, April 19, 2018 - link
Maybe he didn't notice that the tests are at stock speeds?DCide - Friday, April 20, 2018 - link
I can't find any other site using a BIOS as recent as the 0508 version you used (on the ASUS Crosshair VII Hero). Most sites are using older versions. These days, BIOS updates surrounding processor launches make significant performance differences. We've seen this with every Intel and AMD CPU launch since the original Ryzen.Shaheen Misra - Sunday, April 22, 2018 - link
Hi , im looking to gain some insight into your testing methods. Could you please explain why you test at such high graphics settings? Im sure you have previously stated the reasons but i am not familiar with them. My understanding has always been that this creates a graphics bottleneck?Targon - Monday, April 23, 2018 - link
When you consider that people want to see benchmark results how THEY would play the games or do work, it makes sense to focus on that sort of thing. Who plays at a 720p resolution? Yes, it may show CPU performance, or eliminate the GPU being the limiting factor, but if you have a Geforce 1080 GTX, 1080p, 1440, and then 4k performance is what people will actually game at.The ability to actually run video cards at or near their ability is also important, which can be a platform issue. If you see every CPU showing the same numbers with the same video card, then yea, it makes sense to go for the lower settings/resolutions, but since there ARE differences between the processors, running these tests the way they are makes more sense from a "these are similar to what people will see in the real world" perspective.
FlashYoshi - Thursday, April 19, 2018 - link
Intel CPUs were tested with Meltdown/Spectre patches, that's probably the discrepancy you're seeing.MuhOo - Thursday, April 19, 2018 - link
Computerbase and pcgameshardware also used the patched... every other site has completely different results from anandtechsor - Thursday, April 19, 2018 - link
Fwiw I took five minutes to see what you guys are talking about. To me it looks like Toms is screwed up. If you look at the time graphs it looks to me like it’s the purple line on top most of the time, but the summaries have that CPU in 3rd or 4th place. E.G. https://img.purch.com/r/711x457/aHR0cDovL21lZGlhLm...At any rate things are generally damn close, and they largely aren’t even benchmarking the same games, so I don’t understand why a few people are complaining.