The AMD 2nd Gen Ryzen Deep Dive: The 2700X, 2700, 2600X, and 2600 Tested
by Ian Cutress on April 19, 2018 9:00 AM ESTBenchmarking Setup
Testing with Spectre and Meltdown Patches Applied
For our testing on the new AMD Ryzen 2000-series processors and the Intel processors, we enabled the latest version of Microsoft Windows with the latest updates and also BIOS microcode updates to ensure that the Spectre and Meltdown vulnerabilites were as patched as could possibly be. This means that some of the data used in this review is not comparable to previous reviews, however in time we expect our benchmark database to be up to date with these patches.
Test Bed
As per our processor testing policy, we take a premium category motherboard suitable for the socket, and equip the system with a suitable amount of memory running at the manufacturer's maximum supported frequency.
It is noted that some users are not keen on this policy, stating that sometimes the maximum supported frequency is quite low, or faster memory is available at a similar price, or that the speeds can be prohibitive for performance. While these comments make sense, ultimately very few users apply memory profiles (either XMP or other) as they require interaction with the BIOS, and most users will fall back on JEDEC supported speeds - this includes home users as well as industry who might want to shave off a cent or two from the cost or stay within the margins set by the manufacturer. Where possible, we will extend out testing to include faster memory modules either at the same time as the review or a later date.
| Test Setup | |||||||
| AMD | Intel Core | ||||||
| Processor | AM4 | FM2+ | LGA1151 | LGA1151 | LGA2066 | ||
| R7 2700X R7 2700 R5 2600X R5 2600 R7 1800X R5 1600 A12-9800 |
A10-7870K | i7-8700K i7-8700 |
i7-7700K i7-6700K |
i7-7820X i9-7980XE |
|||
| Motherboards | AM4: ASUS Crosshair VII Hero FM2+: ASUS A88X Pro |
LGA1151 (CFL): ASR Z370 Gaming i7 LGA1151: GBT X170-Gaming ECC LGA2066: ASR X299 OC Formula |
|||||
| BIOS | 0508 | 2502 | P1.70 | F21e | P1.40 | ||
| Smeltdown | Yes | OS-level | Yes | Yes | Yes | ||
| Cooling | AM4: Wraith Prism RGB FM2+: Arctic Freezer 13 CO |
LGA1151: Silverstone AR10-115XS LGA2066: Thermalright TRUE Copper |
|||||
| Power Supply | Corsair AX760i PSU | ||||||
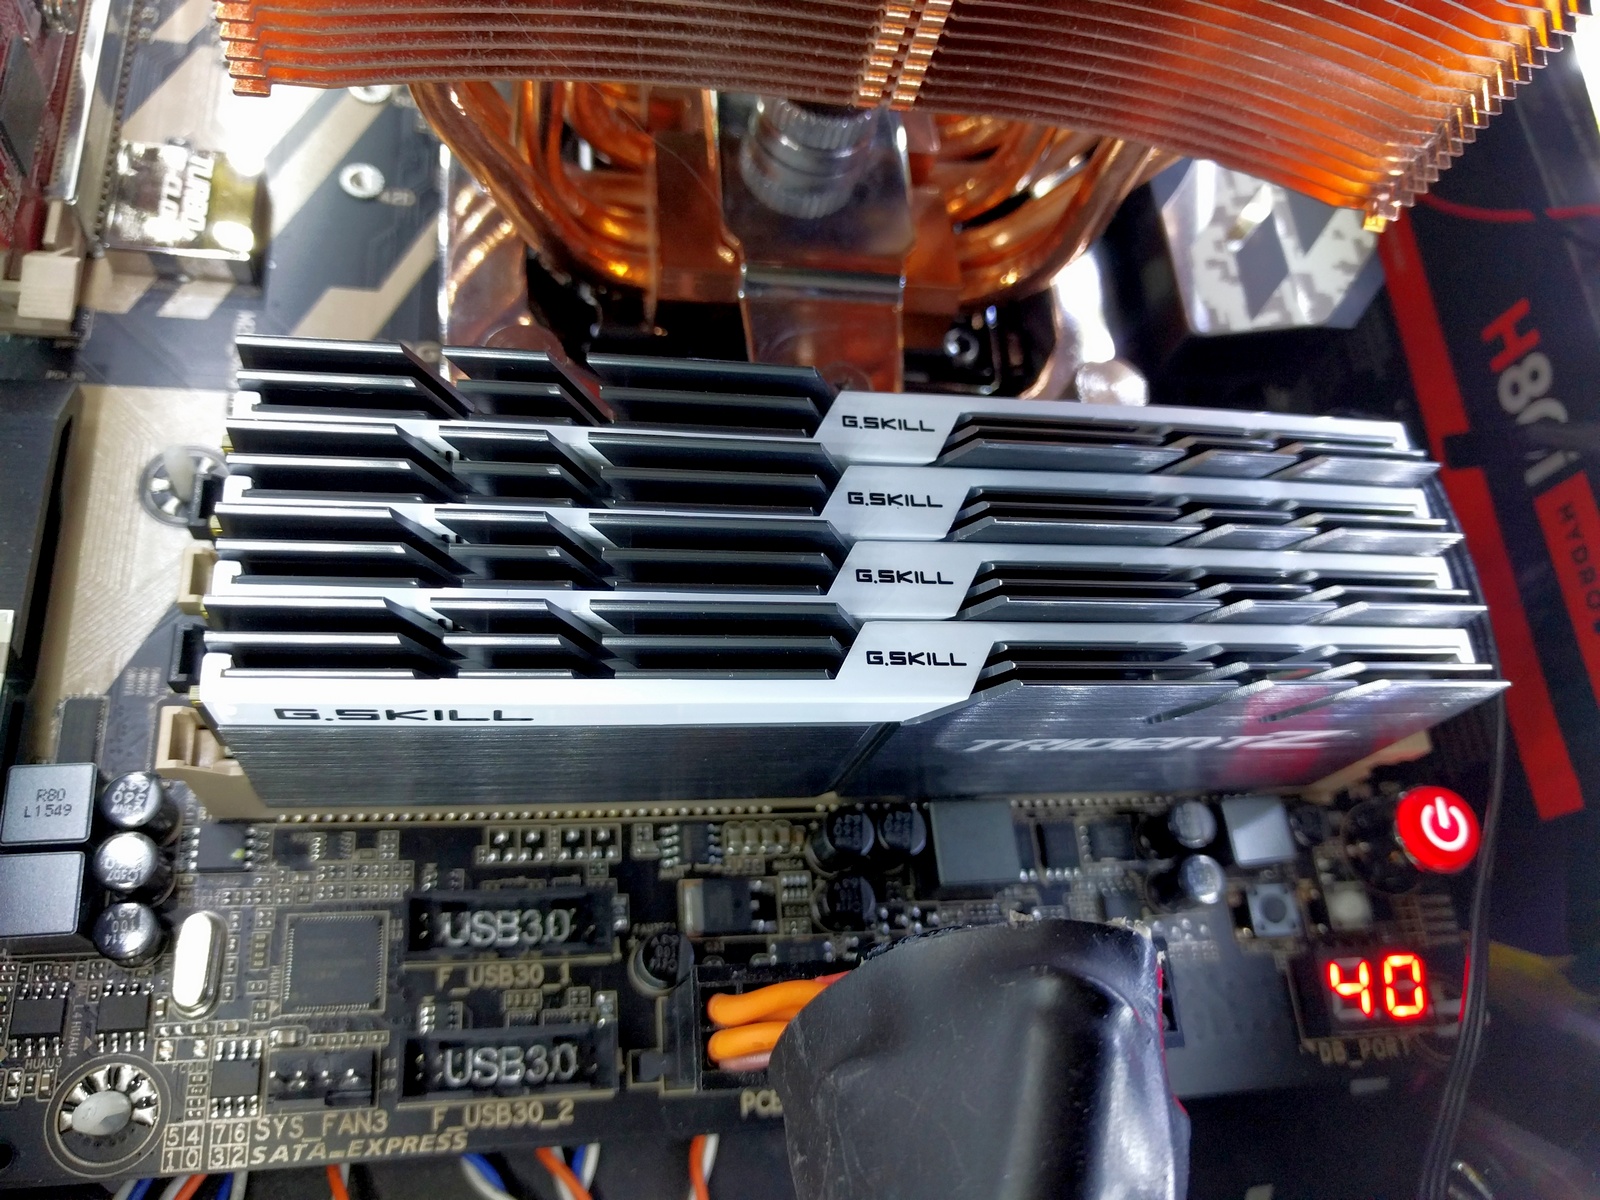
| Memory | G.Skill SniperX Crucial Ballistix G.Skill RipjawsV |
||||||
| Memory Settings | Ryzen-2000: DDR4-2933 16-17-17 Ryzen-1000: DDR4-2666 16-17-17 Bristol Ridge: DDR4-2400 15-17-17 Kaveri: DDR3-2133 9-11-11 |
Coffee Lake: DDR4-2666 16-17-17 Kaby Lake: DDR4-2400 15-15-15 Skylake: DDR4-2133 15-15-15 Skylake-X: DDR4-2400 14-16-16 |
|||||
| GPUs | MSI GTX 1080 Gaming 8G | ||||||
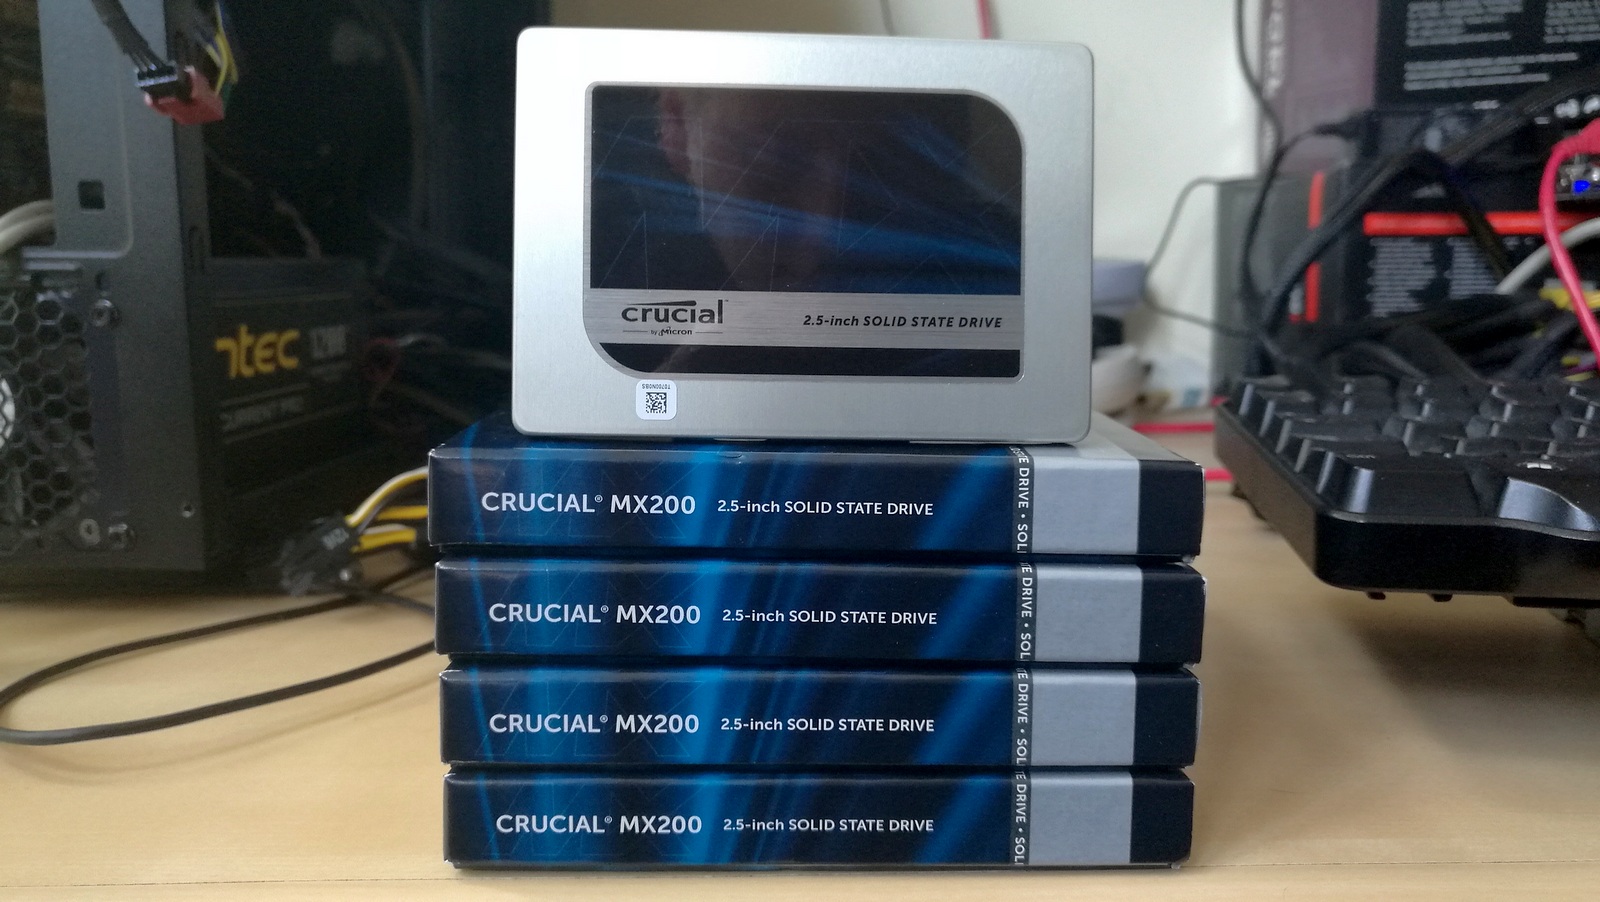
| Hard Drive | Crucial MX200 1TB | ||||||
| Optical Drive | LG GH22NS50 | ||||||
| Case | Open Test Bed | ||||||
| OS | Windows 10 Enterprise RS3 (1803) with OS Patches | ||||||
Power Analysis
One of the key debates around power comes down to how TDP is interpreted, how it is measured, and what exactly it should mean. TDP, or Thermal Design Power, is typically a value associated with the required dissipation ability of the cooler being used, rather than the power consumption. There are some finer physics-related differences for the two, but for simplicity most users consider the TDP as the rated power consumption of the processor.
What the TDP is actually indicating is somewhat more difficult to define. For any Intel processor, the rated TDP is actually the thermal dissipation requirements (or power consumption) when the processor is running at its base frequency. So for a chip like the Core i5-8400 that is rated at 65W, it means that the 65W rating only applies at 2.8 GHz. What makes this confusing is that the offical turbo rating for the Core i7-8700 is 3.8 GHz on all cores, well above the listed base frequency. The truth is that if the processor is limited in firmware to 65W, we will only see 3.2 GHz when all cores are loaded. This is important for thermally limited scenarios, but it also means that without that firmware limit, the power consumption is untied to the TDP: Intel gives no rating for TDP above that base frequency, despite the out-of-the-box turbo performance being much higher.
For AMD, TDP is calculated a little differently. It used to be defined as the peak power draw of the CPU, including turbo, under real all-core workloads (rather than a power virus). Now TDP is more of a measure for cooling performance. AMD defines TDP as the difference between the processor lid temperate and the intake fan temperature divided by the minimum thermal cooler performance required. Or to put it another way, the minimum thermal cooler performance is defined as the temperature difference divided by the TDP. As a result, we end up with a sliding scale: if AMD want to define a cooler with a stronger thermal performance, it would lower the TDP.
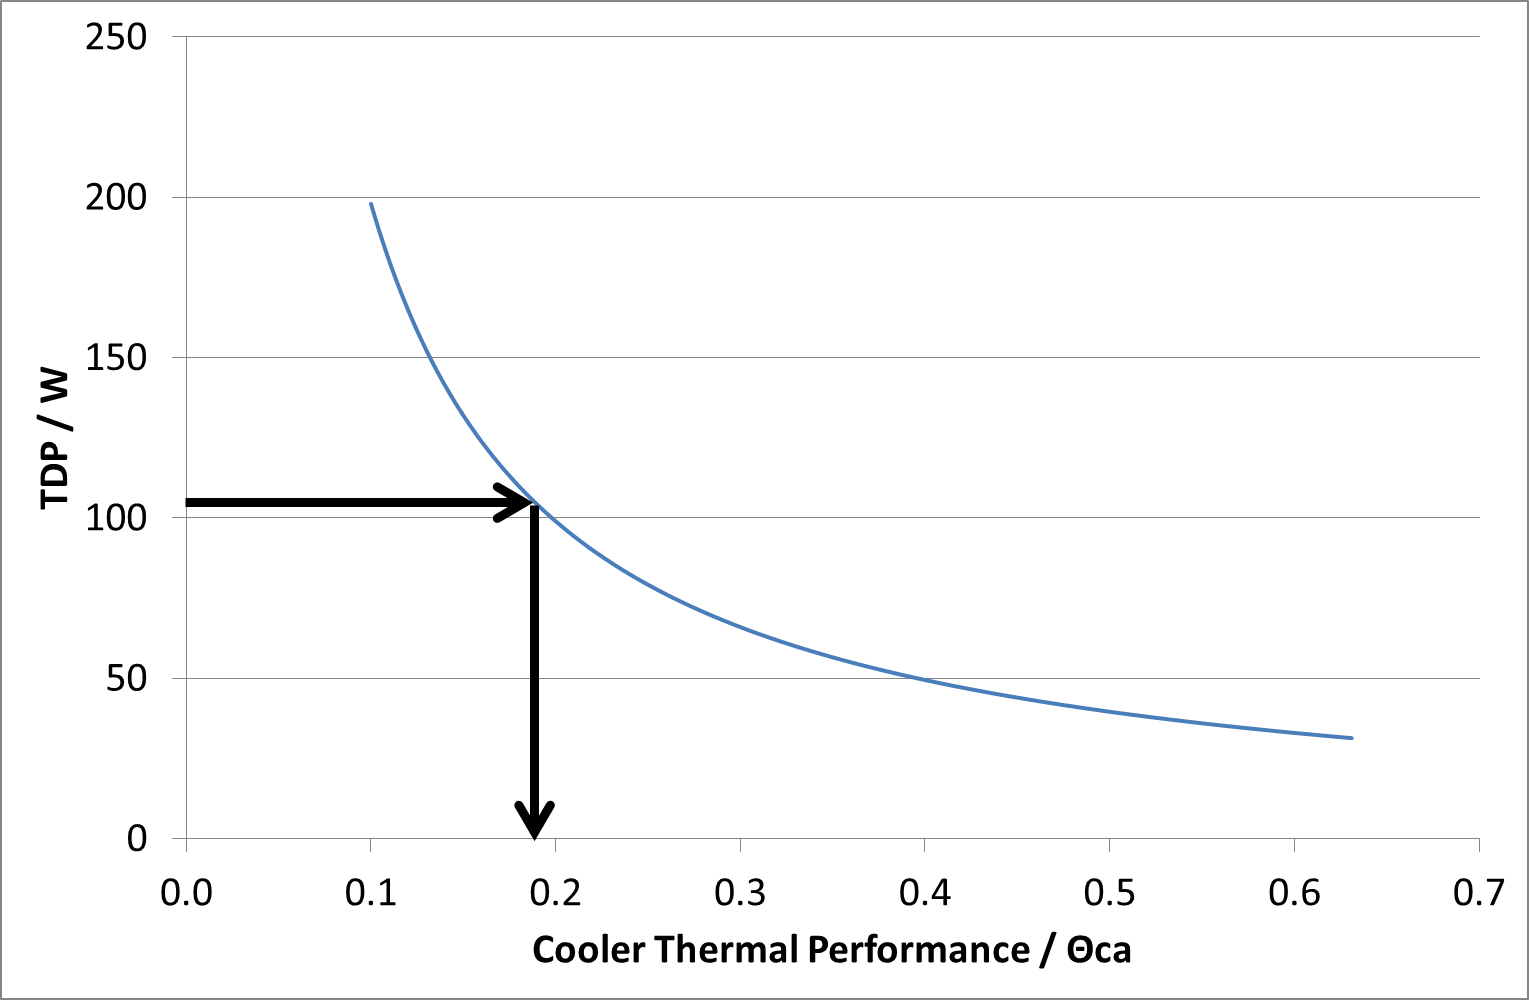
For Ryzen, AMD dictates that this temperature difference is 19.8ºC (61.8 ºC on processor when inlet is 42ºC), which means that for a 105W TDP, the cooler thermal performance needs a to be able to sustain 0.189 ºC per Watt. With a cooler thermal performance of 0.4 ºC/W, the TDP would be rated at 50W, or a value of 0.1 would give 198 W.
This ultimately makes AMD's TDP more of a measure of cooling performance than power consumption.
When testing, we are also at the whim of the motherboard manufacturer. Ultimately for some processors, turbo modes are defined by a look-up table. If the system is using X cores, then the processor should run at Y frequency. Not only can motherboard manufacturers change that table with each firmware revision, but Intel has stopped making this data official. So we cannot tell if a motherboard manufacturer is following Intel's specifications or not - in some reviews, we have had three different motherboard vendors all have different look up tables, but all three stated they were following Intel specifications. Nice and simple, then.
It should also be stated that we are at the whim of a lottery. While two processors could be stamped as the same, how the processor responds to voltage and frequency could actually be very different. The stamp on the box is merely a minimum guarantee, and the actual performance or thermal characteristics of the processor can vary from the minimu guarantee to something really, really good. Both AMD and Intel go through a process called binning, whereby every processor off the manufacturing line is tested to meet with certain standards - if it surpasses the best standards, it gets stamped as the best processor. If it doesn't meet those standards, it might be labelled as something else. There is also the fact that if a manufacturer needs more mid-range components, they might alter the percentage of parts that do meet the high standard but will be stamped as if they meet a medium standard. So a lottery it is.
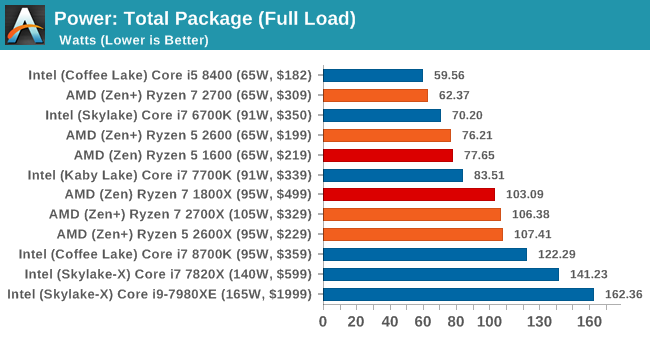
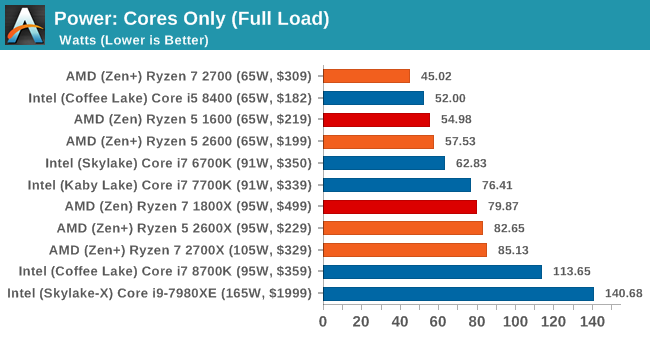
In our testing, we take the power value readings from the internal registers on the processor designed to estimate the power consumption and apply the right turbo and fan profiles. This method is strictly speaking not the most accurate - for that we would be applying our multimeters. But what it does do is give us more information than a multi-meter would. Modern multi-core processors use different voltage plans for different parts of the processor, or even for each core, so the software readings give us a good breakdown of power for the different regions. This is good if the processor makes it available, but this is not always the case. In most situations, we are able to get the two main important numbers: the estimated power consumption of the whole chip, and the estimated power consumption of just the cores (not the memory controller or interconnects).
What is noticable between the Intel and AMD chips is the difference between core-only power and full-chip power. AMD's interconnect, Infinity Fabric, combined with the other non-core components of the chip, draw a lot more power than the Intel chips do. This arguably leaves more power budget for Intel to push the frequencies. That being said, AMD is keeping power consumption around the TDP values: our Ryzen 7 2700 is especially efficient, while we seem to have an average Ryzen 5 2600. By contrast, the Intel Core i7-8700K blasts past its TDP value very easily, whereas the older Kaby Lake processors are more in line with their TDP values.
Many Thanks To
Thank you to Sapphire for providing us with several of their AMD GPUs. We met with Sapphire back at Computex 2016 and discussed a platform for our future testing on AMD GPUs with their hardware for several upcoming projects. Sapphire passed on a pair of RX 460s to be used as our CPU testing cards. The amount of GPU power available can have a direct effect on CPU performance, especially if the CPU has to spend all its time dealing with the GPU display. The RX 460 is a nice card to have here, as it is powerful yet low on power consumption and does not require any additional power connectors. The Sapphire Nitro RX 460 2GB still follows on from the Nitro philosophy, and in this case is designed to provide power at a low price point. Its 896 SPs run at 1090/1216 MHz frequencies, and it is paired with 2GB of GDDR5 at an effective 7000 MHz.
We must also say thank you to MSI for providing us with their GTX 1080 Gaming X 8GB GPUs. Despite the size of AnandTech, securing high-end graphics cards for CPU gaming tests is rather difficult. MSI stepped up to the plate in good fashion and high spirits with a pair of their high-end graphics. The MSI GTX 1080 Gaming X 8GB graphics card is their premium air cooled product, sitting below the water cooled Seahawk but above the Aero and Armor versions. The card is large with twin Torx fans, a custom PCB design, Zero-Frozr technology, enhanced PWM and a big backplate to assist with cooling. The card uses a GP104-400 silicon die from a 16nm TSMC process, contains 2560 CUDA cores, and can run up to 1847 MHz in OC mode (or 1607-1733 MHz in Silent mode). The memory interface is 8GB of GDDR5X, running at 10010 MHz. For a good amount of time, the GTX 1080 was the card at the king of the hill.
Further Reading: AnandTech’s NVIDIA GTX 1080 Founders Edition Review

Thank you to Crucial for providing us with MX200 SSDs. Crucial stepped up to the plate as our benchmark list grows larger with newer benchmarks and titles, and the 1TB MX200 units are strong performers. Based on Marvell's 88SS9189 controller and using Micron's 16nm 128Gbit MLC flash, these are 7mm high, 2.5-inch drives rated for 100K random read IOPs and 555/500 MB/s sequential read and write speeds. The 1TB models we are using here support TCG Opal 2.0 and IEEE-1667 (eDrive) encryption and have a 320TB rated endurance with a three-year warranty.
Further Reading: AnandTech's Crucial MX200 (250 GB, 500 GB & 1TB) Review
Thank you to Corsair for providing us with an AX1200i PSU. The AX1200i was the first power supply to offer digital control and management via Corsair's Link system, but under the hood it commands a 1200W rating at 50C with 80 PLUS Platinum certification. This allows for a minimum 89-92% efficiency at 115V and 90-94% at 230V. The AX1200i is completely modular, running the larger 200mm design, with a dual ball bearing 140mm fan to assist high-performance use. The AX1200i is designed to be a workhorse, with up to 8 PCIe connectors for suitable four-way GPU setups. The AX1200i also comes with a Zero RPM mode for the fan, which due to the design allows the fan to be switched off when the power supply is under 30% load.
Further Reading: AnandTech's Corsair AX1500i Power Supply Review

Thank you to G.Skill for providing us with memory. G.Skill has been a long-time supporter of AnandTech over the years, for testing beyond our CPU and motherboard memory reviews. We've reported on their high capacity and high-frequency kits, and every year at Computex G.Skill holds a world overclocking tournament with liquid nitrogen right on the show floor.
Further Reading: AnandTech's Memory Scaling on Haswell Review, with G.Skill DDR3-3000


545 Comments
View All Comments
RafaelHerschel - Thursday, April 19, 2018 - link
Hardware unboxed certainly did. It's a bit odd that you automatically assume that only Anandtech knows how to test.aliquis - Thursday, April 19, 2018 - link
If they don't rerun the tests with up to date software then they are useless.What I assume has happened here is some software, driver or firmware being "off" in the Anandtech review somehow.
RafaelHerschel - Thursday, April 19, 2018 - link
@Ryan Smith That is an excellent response.krumme - Thursday, April 19, 2018 - link
AT run bm at Jdec specs. 2666 for 8700k 2933 for 2700x. That and the security patches.Hifihedgehog - Thursday, April 19, 2018 - link
I was also totally misled. I came here first, only to find out after having misleading people online that this site’s results are completely off. I am a big AMD fan but these results need to be audited and corrected.Ryan Smith - Thursday, April 19, 2018 - link
"these results need to be audited and corrected."Validating right now.=)
stefanve - Thursday, April 19, 2018 - link
Clearly someone didn't apply his meltdown patch ....casperes1996 - Thursday, April 19, 2018 - link
Advice for the future:Don't be a prick.
Ian isn't lying to you. He's sharing the data his benchmarking showed. It being different to other reviewers is something he'll gladly look into, and is in fact looking into, but you ought to show yourself as a respectful individual when you point it out, otherwise you won't be listened to.
MadManMark - Thursday, April 19, 2018 - link
Hear, hear!bfoster68 - Thursday, April 19, 2018 - link
Chris113q,I did one for you since you seemed to be having issues.
If you read below they use a different methodology for estimating fps vs what AnandTech did in their review. the result is nearly the same. solid gains for AMD on a incremental upgrade. Was that so hard?
https://www.tomshardware.com/reviews/amd-ryzen-7-2...