The AMD 2nd Gen Ryzen Deep Dive: The 2700X, 2700, 2600X, and 2600 Tested
by Ian Cutress on April 19, 2018 9:00 AM ESTCPU Rendering Tests
Rendering tests are a long-time favorite of reviewers and benchmarkers, as the code used by rendering packages is usually highly optimized to squeeze every little bit of performance out. Sometimes rendering programs end up being heavily memory dependent as well - when you have that many threads flying about with a ton of data, having low latency memory can be key to everything. Here we take a few of the usual rendering packages under Windows 10, as well as a few new interesting benchmarks.
All of our benchmark results can also be found in our benchmark engine, Bench.
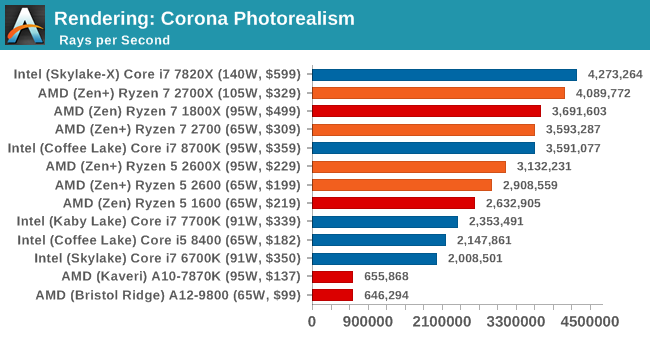
Corona 1.3: link
Corona is a standalone package designed to assist software like 3ds Max and Maya with photorealism via ray tracing. It's simple - shoot rays, get pixels. OK, it's more complicated than that, but the benchmark renders a fixed scene six times and offers results in terms of time and rays per second. The official benchmark tables list user submitted results in terms of time, however I feel rays per second is a better metric (in general, scores where higher is better seem to be easier to explain anyway). Corona likes to pile on the threads, so the results end up being very staggered based on thread count.
Blender 2.78: link
For a render that has been around for what seems like ages, Blender is still a highly popular tool. We managed to wrap up a standard workload into the February 5 nightly build of Blender and measure the time it takes to render the first frame of the scene. Being one of the bigger open source tools out there, it means both AMD and Intel work actively to help improve the codebase, for better or for worse on their own/each other's microarchitecture.
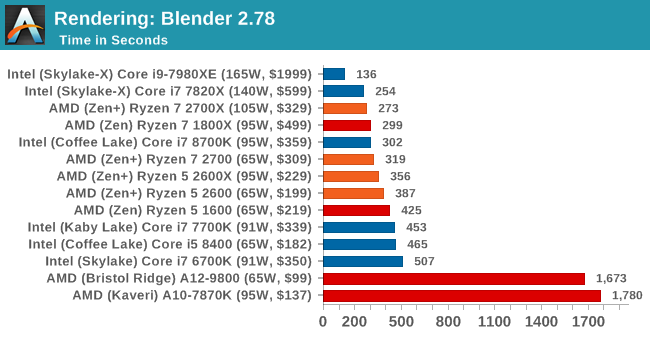
This is one multi-threaded test where the 8-core Skylake-based Intel processor wins against the new AMD Ryzen 7 2700X; the variable threaded nature of Blender means that the mesh architecture and memory bandwidth work well here. On a price/parity comparison, the Ryzen 7 2700X easily takes the win from the top performers. Users with the Core i7-6700K are being easily beaten by the Ryzen 5 2600.
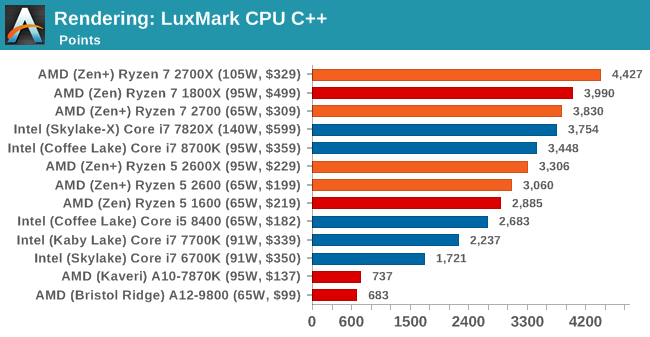
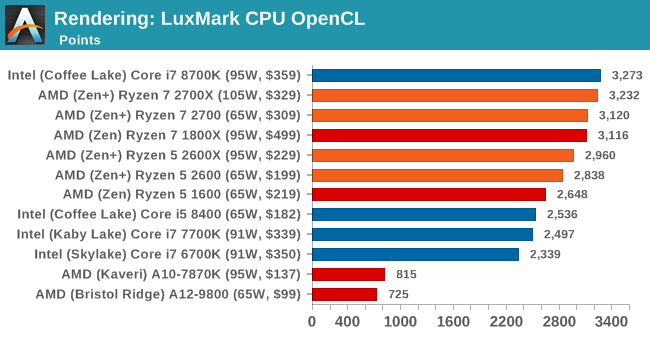
LuxMark v3.1: Link
As a synthetic, LuxMark might come across as somewhat arbitrary as a renderer, given that it's mainly used to test GPUs, but it does offer both an OpenCL and a standard C++ mode. In this instance, aside from seeing the comparison in each coding mode for cores and IPC, we also get to see the difference in performance moving from a C++ based code-stack to an OpenCL one with a CPU as the main host.
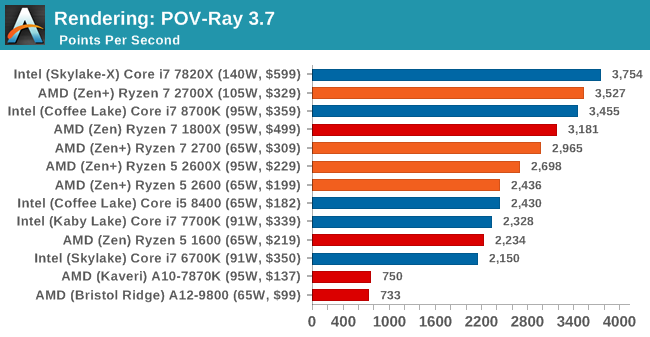
POV-Ray 3.7.1b4: link
Another regular benchmark in most suites, POV-Ray is another ray-tracer but has been around for many years. It just so happens that during the run up to AMD's Ryzen launch, the code base started to get active again with developers making changes to the code and pushing out updates. Our version and benchmarking started just before that was happening, but given time we will see where the POV-Ray code ends up and adjust in due course.
Cinebench R15: link
The latest version of CineBench has also become one of those 'used everywhere' benchmarks, particularly as an indicator of single thread performance. High IPC and high frequency gives performance in ST, whereas having good scaling and many cores is where the MT test wins out.
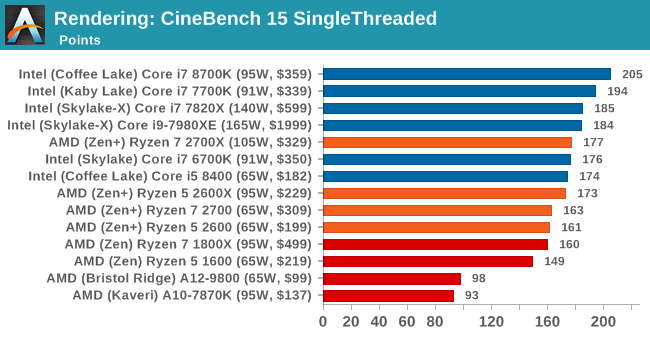
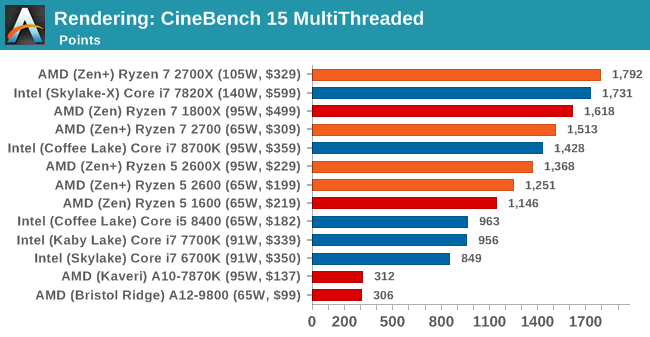
Intel is still the single thread champion in benchmarks like CineBench, but it would appear that the Ryzen 7 2700X is now taking the lead in the multithreaded test.


545 Comments
View All Comments
RafaelHerschel - Thursday, April 19, 2018 - link
Hardware unboxed certainly did. It's a bit odd that you automatically assume that only Anandtech knows how to test.aliquis - Thursday, April 19, 2018 - link
If they don't rerun the tests with up to date software then they are useless.What I assume has happened here is some software, driver or firmware being "off" in the Anandtech review somehow.
RafaelHerschel - Thursday, April 19, 2018 - link
@Ryan Smith That is an excellent response.krumme - Thursday, April 19, 2018 - link
AT run bm at Jdec specs. 2666 for 8700k 2933 for 2700x. That and the security patches.Hifihedgehog - Thursday, April 19, 2018 - link
I was also totally misled. I came here first, only to find out after having misleading people online that this site’s results are completely off. I am a big AMD fan but these results need to be audited and corrected.Ryan Smith - Thursday, April 19, 2018 - link
"these results need to be audited and corrected."Validating right now.=)
stefanve - Thursday, April 19, 2018 - link
Clearly someone didn't apply his meltdown patch ....casperes1996 - Thursday, April 19, 2018 - link
Advice for the future:Don't be a prick.
Ian isn't lying to you. He's sharing the data his benchmarking showed. It being different to other reviewers is something he'll gladly look into, and is in fact looking into, but you ought to show yourself as a respectful individual when you point it out, otherwise you won't be listened to.
MadManMark - Thursday, April 19, 2018 - link
Hear, hear!bfoster68 - Thursday, April 19, 2018 - link
Chris113q,I did one for you since you seemed to be having issues.
If you read below they use a different methodology for estimating fps vs what AnandTech did in their review. the result is nearly the same. solid gains for AMD on a incremental upgrade. Was that so hard?
https://www.tomshardware.com/reviews/amd-ryzen-7-2...