Zen and Vega DDR4 Memory Scaling on AMD's APUs
by Gavin Bonshor on June 28, 2018 9:00 AM EST- Posted in
- CPUs
- Memory
- G.Skill
- AMD
- DDR4
- DRAM
- APU
- Ryzen
- Raven Ridge
- Scaling
- Ryzen 3 2200G
- Ryzen 5 2400G
Integrated Gaming Performance
As stated on the first page, here we take both APUs from DDR4-2133 to DDR4-3466 and run our testing suite at each stage. For our gaming tests, we are only concerned with real-world resolutions and settings for these games. It would be fairly easy to adjust the settings in each game to a CPU limited scenario, however the results from such a test are mostly pointless and non-transferable to the real world in our view. Scaling takes many forms, based on GPU, resolution, detail levels, and settings, so we want to make sure the results correlate to what users will see day-to-day.
Civilization 6
First up in our APU gaming tests is Civilization 6. Originally penned by Sid Meier and his team, the Civ series of turn-based strategy games are a cult classic, and many an excuse for an all-nighter trying to get Gandhi to declare war on you due to an integer underflow. Truth be told I never actually played the first version, but every edition from the second to the sixth, including the fourth as voiced by the late Leonard Nimoy, it a game that is easy to pick up, but hard to master.

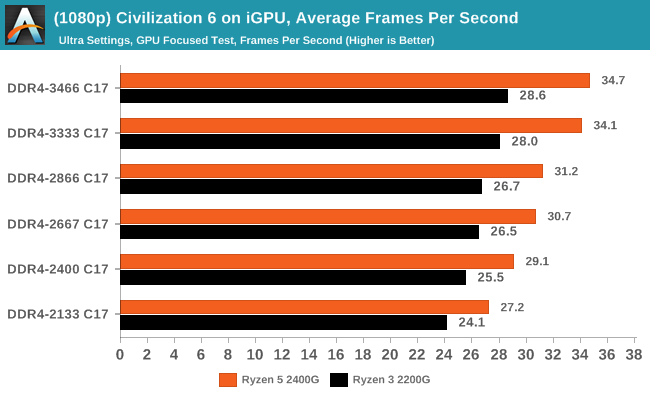
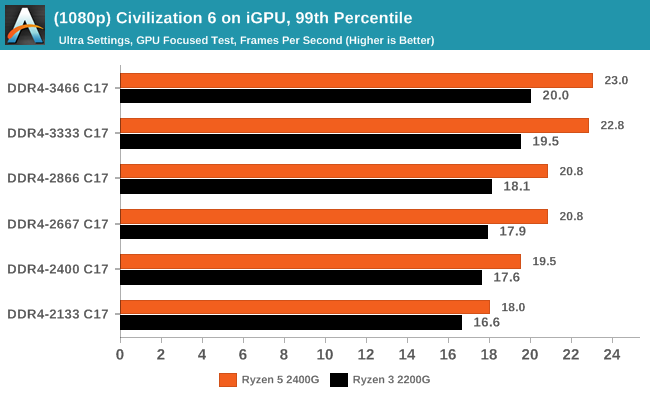
Civilazation 6 certainly appreciates faster memory on integrated graphics, showing a +28% gain for the 2400G on average framerates, or a +13% gain when compared to the APU rated memory frequency (DDR4-2666).
Ashes of the Singularity (DX12)
Seen as the holy child of DX12, Ashes of the Singularity (AoTS, or just Ashes) has been the first title to actively go and explore as many of the DX12 features as it possibly can. Stardock, the developer behind the Nitrous engine which powers the game, has ensured that the real-time strategy title takes advantage of multiple cores and multiple graphics cards, in as many configurations as possible.
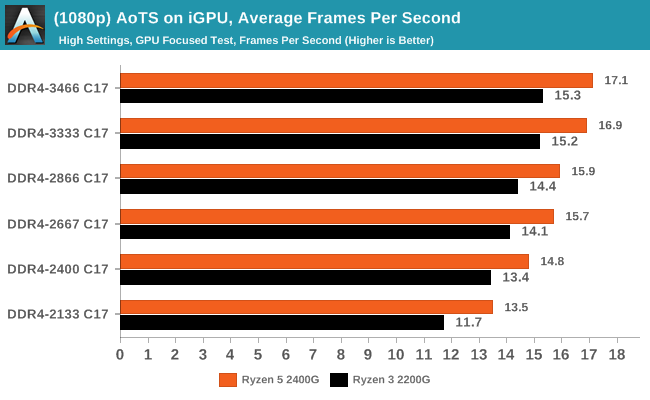
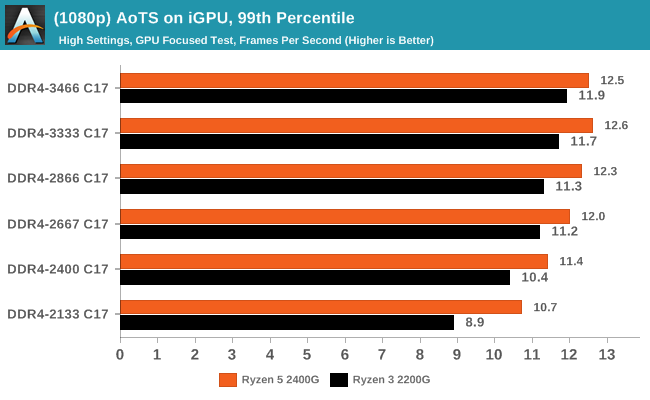
In Ashes, both CPUs saw a 26-30% gain in frame rates moving from the slow to fast memory, which is also seen in the percentile numbers.
Rise Of The Tomb Raider (DX12)
One of the newest games in the gaming benchmark suite is Rise of the Tomb Raider (RoTR), developed by Crystal Dynamics, and the sequel to the popular Tomb Raider which was loved for its automated benchmark mode. But don’t let that fool you: the benchmark mode in RoTR is very much different this time around. Visually, the previous Tomb Raider pushed realism to the limits with features such as TressFX, and the new RoTR goes one stage further when it comes to graphics fidelity. This leads to an interesting set of requirements in hardware: some sections of the game are typically GPU limited, whereas others with a lot of long-range physics can be CPU limited, depending on how the driver can translate the DirectX 12 workload.

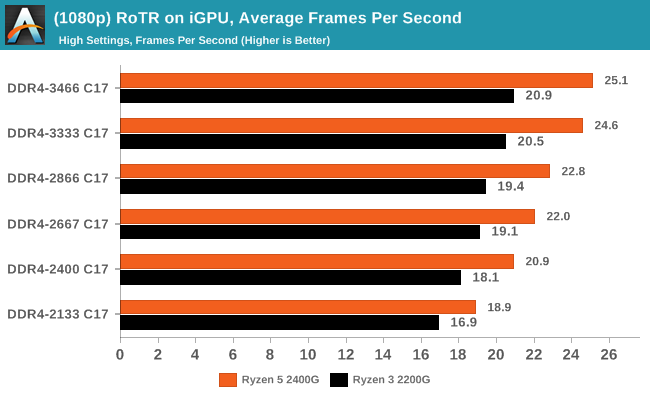
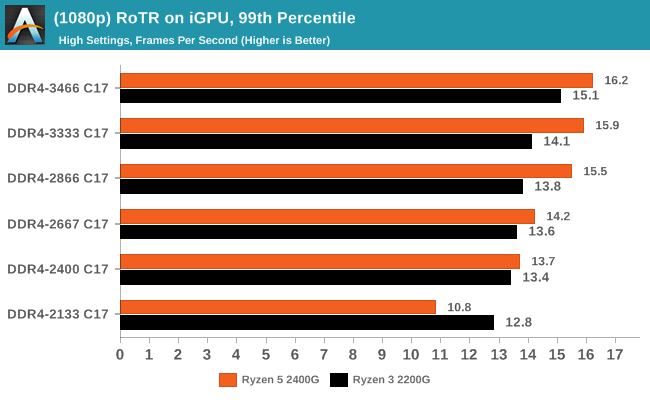
Both CPUs saw big gains in RoTR, however it is interesting to note that the 2400G gained margin over the 2200G: at DDR4-2133, the difference between the two APUs was 12%, however with the fast memory that difference grew to +20%.
Shadow of Mordor
The next title in our testing is a battle of system performance with the open world action-adventure title, Middle Earth: Shadow of Mordor (SoM for short). Produced by Monolith and using the LithTech Jupiter EX engine and numerous detail add-ons, SoM goes for detail and complexity. The main story itself was written by the same writer as Red Dead Redemption, and it received Zero Punctuation’s Game of The Year in 2014.

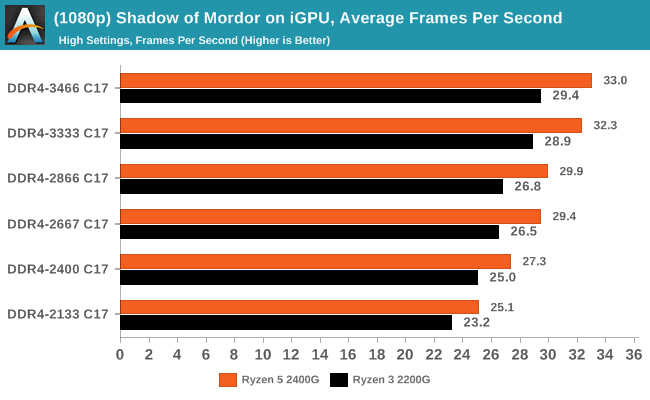
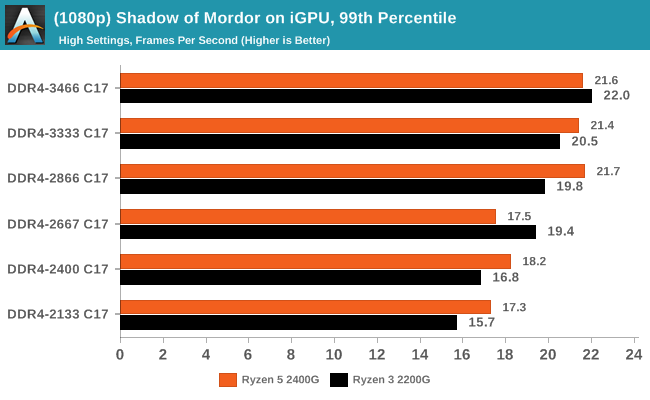
Shadow of Mordor also saw results rise from 26-32% for average frame rates, while the percentiles are a different story. The Ryzen 5 2400G seemed to top our at DDR4-2866, while the Ryzen 3 2200G was able to keep going and then beat the other APU. This is despite the fact that the 2200G has less graphical horsepower than the 2400G.
F1 2017
Released in the same year as the title suggests, F1 2017 is the ninth variant of the franchise to be published and developed by Codemasters. The game is based around the F1 2017 season and has been and licensed by the sports official governing body, the Federation Internationale de l’Automobile (FIA). F1 2017 features all twenty racing circuits, all twenty drivers across ten teams and allows F1 fans to immerse themselves into the world of Formula One with a rather comprehensive world championship season mode.
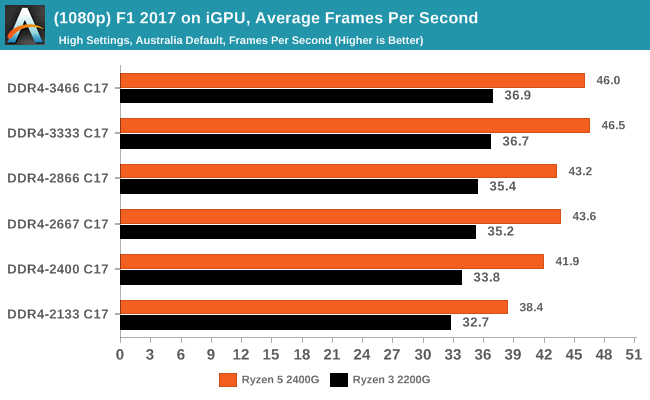
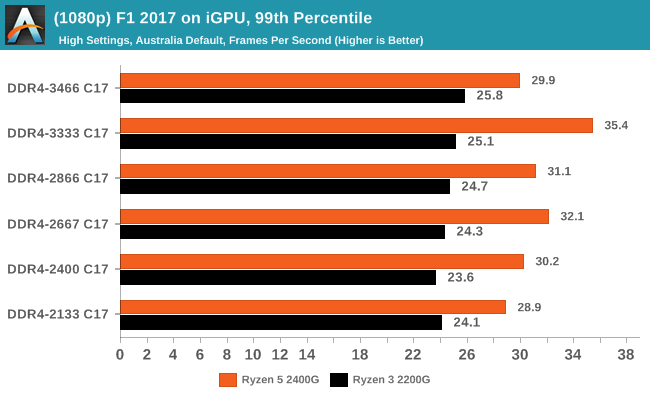
Codemasters game engines are usually very positive when memory frequency comes into play, and although positive generally in F1 2017, it didn't seem to affect performance as much as expected. While average frame rates showed a gradual rise in performance through the straps, the Ryzen 5 2400G 99th percentile results were all over the place and not consistent at all.
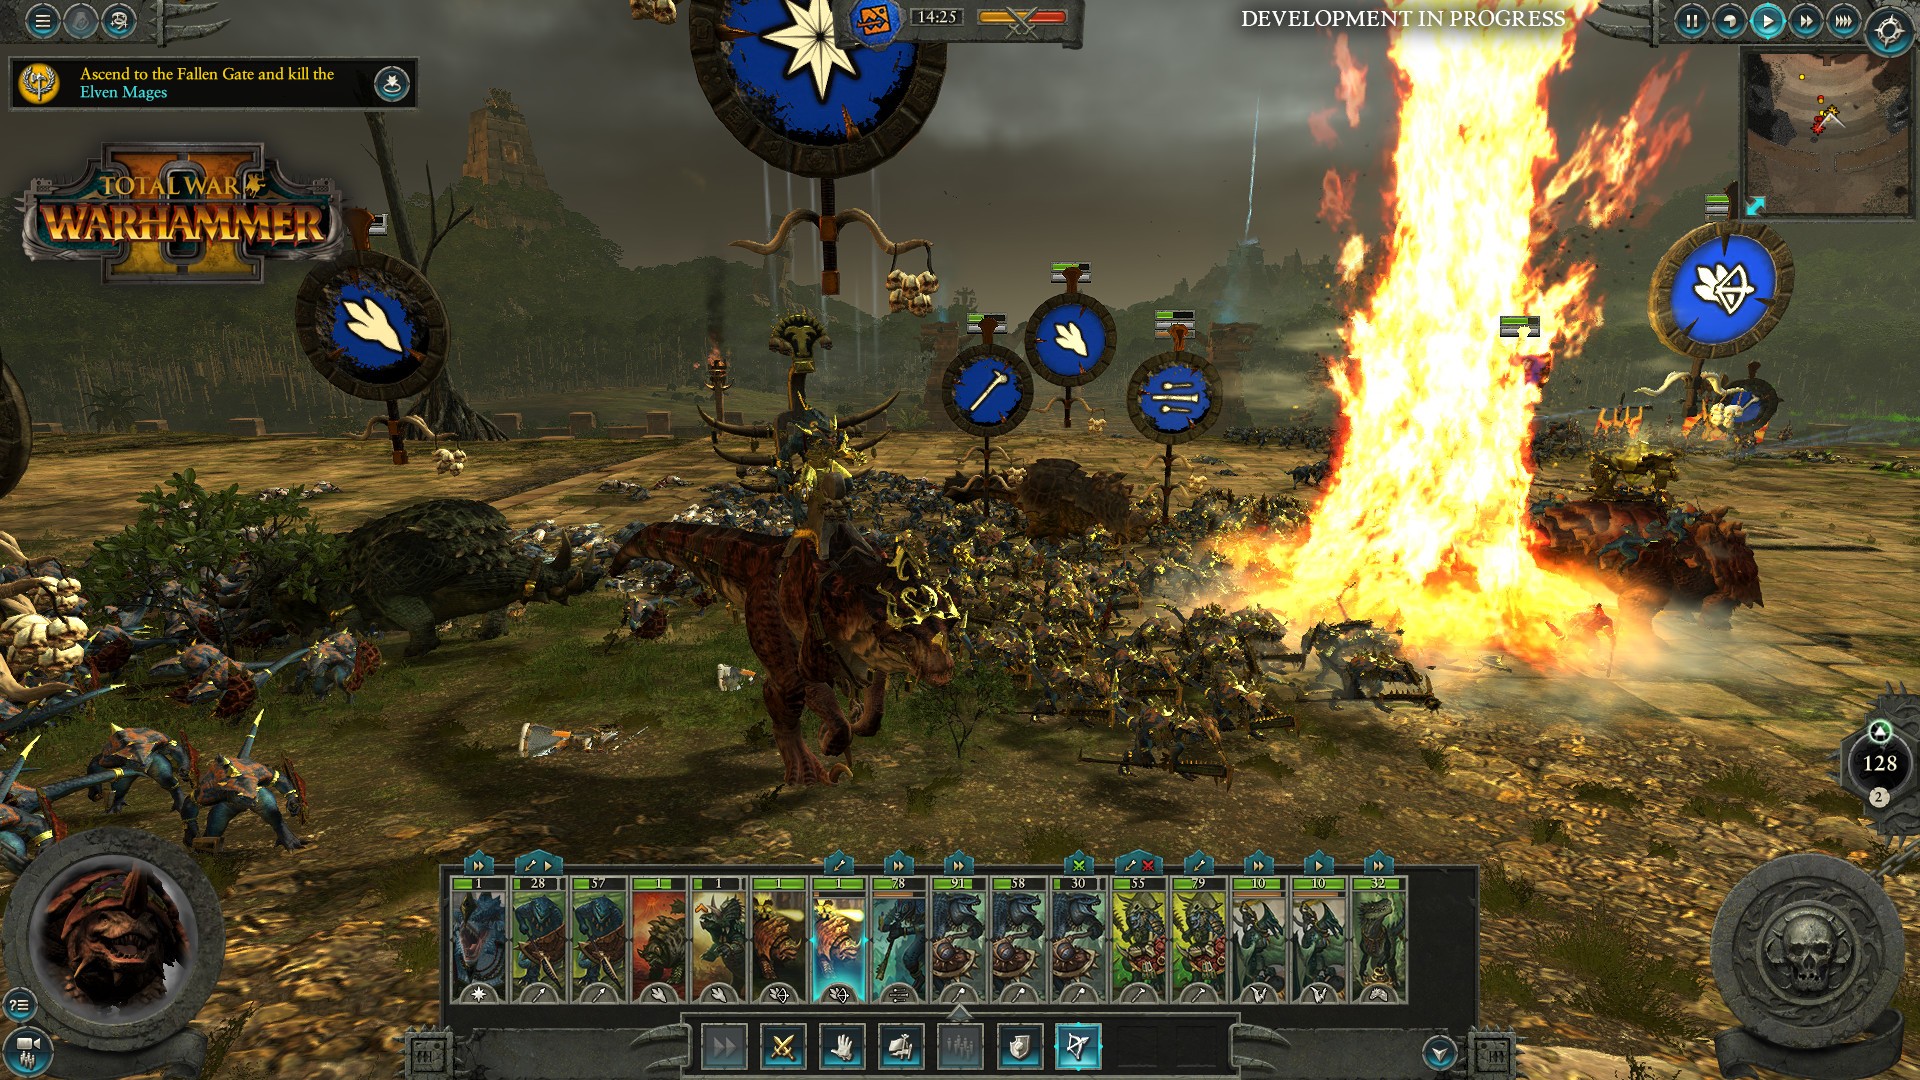
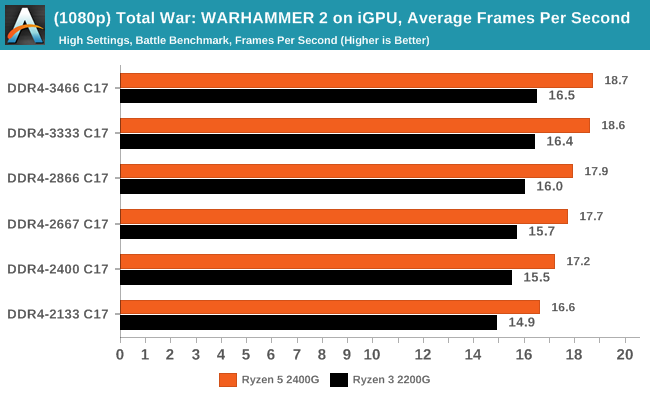
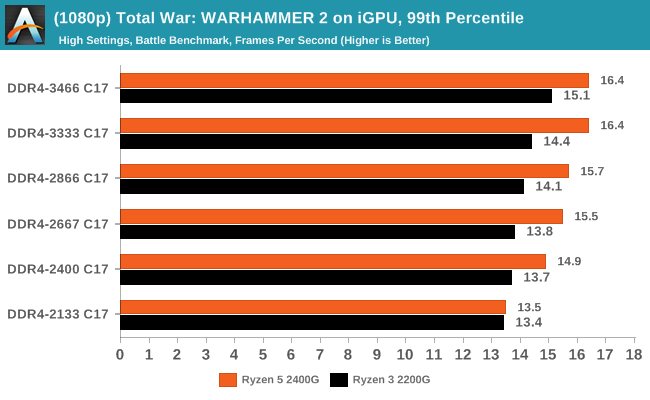
Total War: WARHAMMER 2
Not only is the Total War franchise one of the most popular real-time tactical strategy titles of all time, but Sega delve into multiple worlds such as the Roman Empire, Napoleonic era and even Attila the Hun, but more recently they nosedived into the world of Games Workshop via the WARHAMMER series. Developers Creative Assembly have used their latest RTS battle title with the much talked about DirectX 12 API, just like the original version, Total War: WARHAMMER, so that this title can benefit from all the associated features that comes with it. The game itself is very CPU intensive and is capable of pushing any top end system to their limits.


74 Comments
View All Comments
BedfordTim - Thursday, June 28, 2018 - link
To illustrate your point, even the cheapest DDR4 2133 memory is CL15JasonMZW20 - Thursday, June 28, 2018 - link
I think it's better to have the same timings as a testing reference. Yes, typically memory latencies are lower with lower clockspeeds, but really, AT are testing for memory bandwidth limitations and performance increases associated with increased memory bandwidth alone (not factoring latencies, since they're static across the range). In that sense, it's a successful test.There is a bit of performance left out for lower clockspeed kits, but that's outside the scope of this test which singled out bandwidth only.
FullmetalTitan - Thursday, June 28, 2018 - link
Seems like an effective control to me, pretty standard experimental control.This was clearly not a real-world testing scenario, but rather an artificial one where they fixed a common variable (CAS latency) in order to highlight the direct correlation of mem frequency to GPU performance. Anyone interested in this type of information should understand that these tests are very much NOT a real-world scenario.
Lonyo - Thursday, June 28, 2018 - link
They fixed the variable but didn't fix it. Fixing the CAS cycles doesn't fix the CAS delay. Adjusting the CAS cycles would provide a set CAS delay. The latency is measured in cycles, but faster RAM has faster cycles so the time-based latency decreases with the same CAS setting.e.g. 2000MHz CAS 10 has the same ns latency as 4000MHz CAS20.
DDR4-3466 at 17 CAS is 9.81s latency. DDR4-2133 at 12 CAS would be 11.26. At 17 it's 15.95ns.
Intel's XMP profiles for 2133MHz go from 9 to 13ns. For 3466MHz it's 16 or 18. 8.44ns vs 9.23ns.
If the increase in framerate is partly due to changes in latency (99th percentile may well be), then this test isn't reflective of real world performance with reasonable variables.
gglaw - Saturday, June 30, 2018 - link
This test was definitely very flawed and misleading for most average computer users. Most techies can read into the details and understand it was purely a demonstration of what happens when you lock the same timings and increase only the frequency of the RAM, but many will feel that this is an indirect review of how different memory kits perform. The reality is that the cheaper, low frequency kits are a lot closer to the high-end ones than the graphs show. A much better review would include both comparisons with and without locked timings, and if not including the real world part where the timings are also varied it should be noted in bold multiple times, perhaps even as a disclaimer below every chart. "These graphs do not demonstrate real world performance of the memory kits as they were not allowed to operate at the recommended timings." (That the huge majority of users would let them run at.)You go as far as making purchasing recommendations further indicating that the performance displayed in your charts are indicative of specific product reviews and finding a sweet spot for price/performance. This is the most flawed part. You neutered the very popular 2133-2400 segment by exaggerating how much faster the 3000+ kits are. If you allowed the lower frequencies to operate at their recommended/default timings, the price/performance recommendations would be entirely different.
mode_13h - Thursday, June 28, 2018 - link
I agree with this, but I do see value in a set of tests which varied only clock speed.What I was thinking they should've done was a second set of tests at the lowest latency usable with each speed. Now, that would lend real-world applicability you want *and* show the impact of memory latency.
peevee - Tuesday, July 3, 2018 - link
They actually VARIED the latencies, as measured properly, in time. They artificially forced longer latencies when running memory on lower frequencies. That is the problem. Maybe they have memory advertisers. Or it was gross incompetence.peevee - Thursday, June 28, 2018 - link
" specifically up to version 1.0.0.6, but now preceded by 1.1.0.1."You mean "superseded"?
.vodka - Thursday, June 28, 2018 - link
No. AGESA version number got reset after Raven Ridge's. Pinnacle's is back to 1.0.0.x.This is why tools report SummitPI/RavenPI/PinnaclePI and the version number. One without the other is a recipe for confusion.
mooninite - Thursday, June 28, 2018 - link
This has really made me reconsider a 2200G instead of a 2400G for my HTPC. The 2200G is currently $99 vs $160 for the 2400G. Why pay $60 more for ~2-4 more FPS?