Meltdown & Spectre: Analyzing Performance Impacts on Intel's NUC7i7BNH
by Ganesh T S on March 23, 2018 4:15 PM EST- Posted in
- Systems
- Spectre
- Benchmarks
- Meltdown
BAPCo and Futuremark Benchmarks
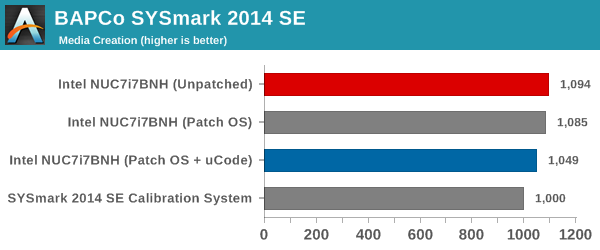
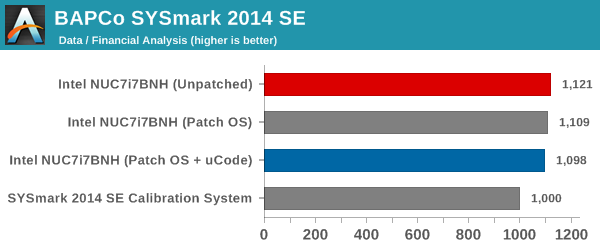
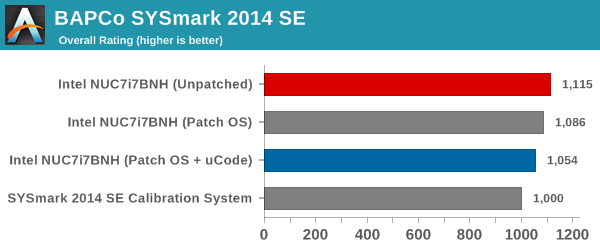
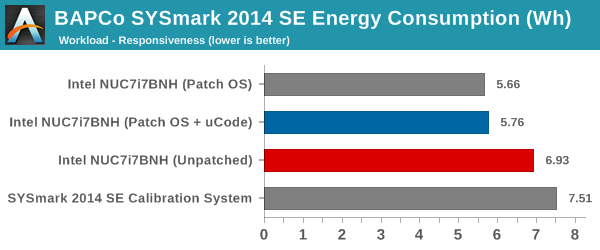
BAPCo's SYSmark 2014 SE is an application-based benchmark that uses real-world applications to replay usage patterns of business users in the areas of office productivity, media creation and data/financial analysis. In addition, it also addresses the responsiveness aspect which deals with user experience as related to application and file launches, multi-tasking etc. Scores are meant to be compared against a reference desktop (the SYSmark 2014 SE calibration system in the graphs below). While the SYSmark 2014 benchmark used a Haswell-based desktop configuration, the SYSmark 2014 SE makes the move to a Lenovo ThinkCenter M800 (Intel Core i3-6100, 4GB RAM and a 256GB SATA SSD). The calibration system scores 1000 in each of the scenarios. A score of, say, 2000, would imply that the system under test is twice as fast as the reference system.
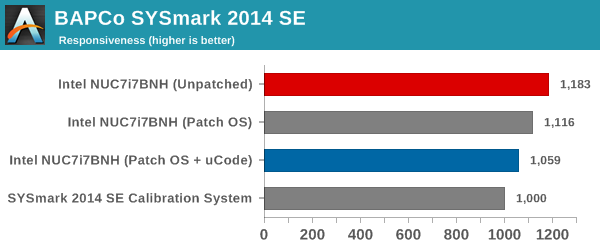
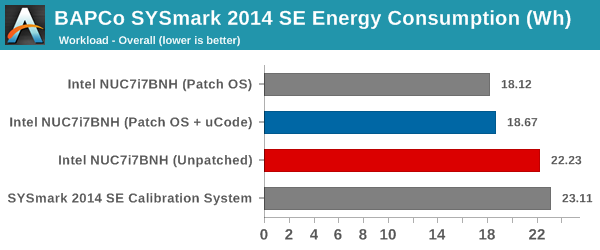
We see that the patching does have an impact on the performance. It ranges from around 5% for the Office Productivity scenario to around 10% for the Responsiveness metric.
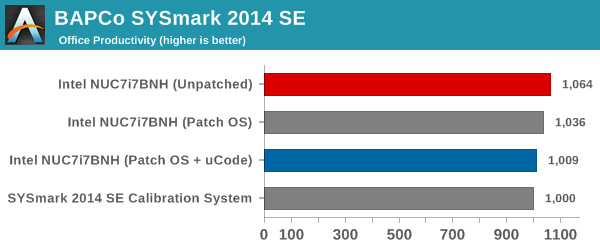
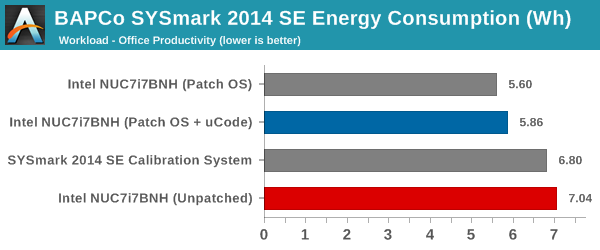
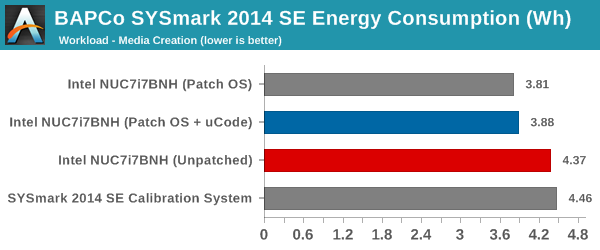
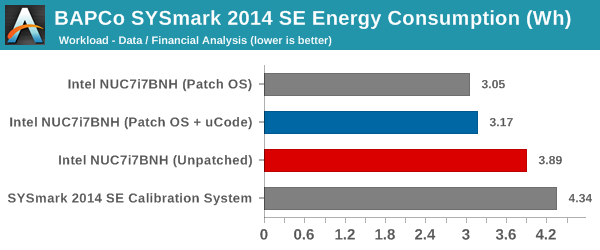
SYSmark 2014 SE also adds energy measurement to the mix. We see that the patched system, despite being slower, consumes lower energy for the completion of the tasks.
Futuremark PCMark 10
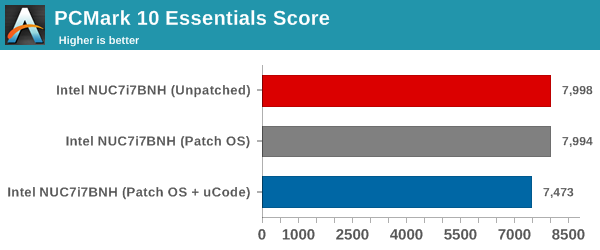
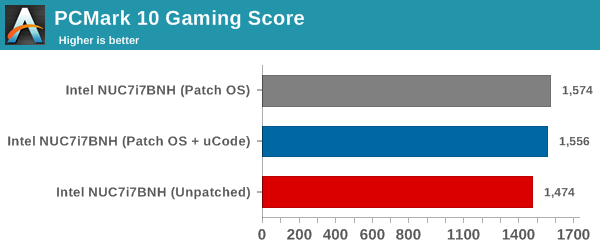
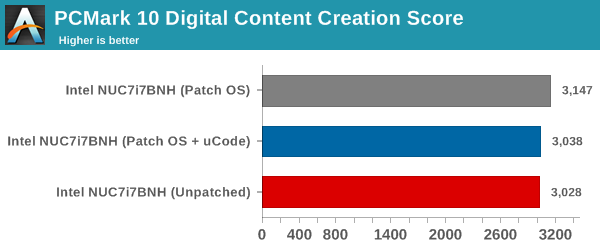
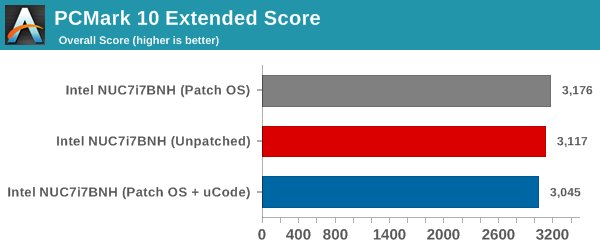
UL's PCMark 10 evaluates computing systems for various usage scenarios (generic / essential tasks such as web browsing and starting up applications, productivity tasks such as editing spreadsheets and documents, gaming, and digital content creation). We benchmarked the configurations with the PCMark 10 Extended profile and recorded the scores for various scenarios. These scores are heavily influenced by the CPU and GPU in the system, though the RAM and storage device also play a part. The power plan was set to Balanced for all the PCs while processing the PCMark 10 benchmark.
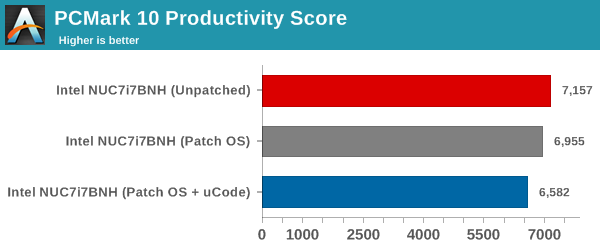
Similar to SYSmark 2014 SE, we see performance impacts in all the PCMark 10 scenarios also. For example, the Essentials workload score for the fully patched system is around 6.5% lower than the unpatched system. The gaming workload doesn't seem to be affected much by the patching, though. The overall score is around 2.3% lower.
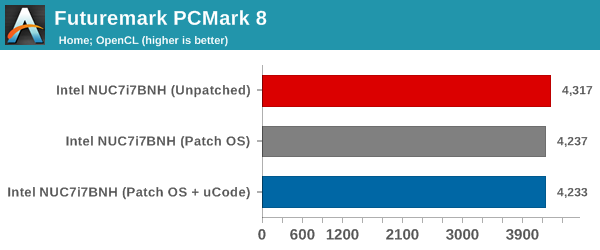
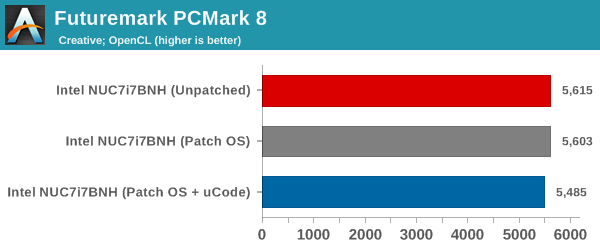
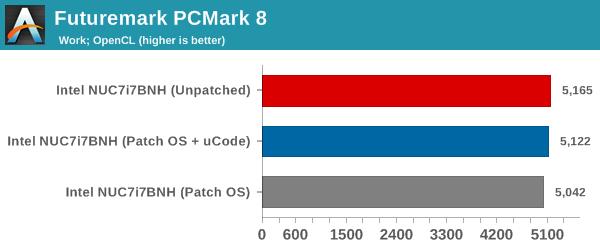
Futuremark PCMark 8
We continue to present PCMark 8 benchmark results (as those have more comparison points) while our PCMark 10 scores database for systems grows in size. PCMark 8 provides various usage scenarios (home, creative and work) and offers ways to benchmark both baseline (CPU-only) as well as OpenCL accelerated (CPU + GPU) performance. We benchmarked select PCs for the OpenCL accelerated performance in all three usage scenarios. Since these scores are heavily influenced by the CPU in the system, it is not surprising to see a performance impact. The patched configuration, on average, scores around 2% lower than the unpatched one.
Miscellaneous Futuremark Benchmarks
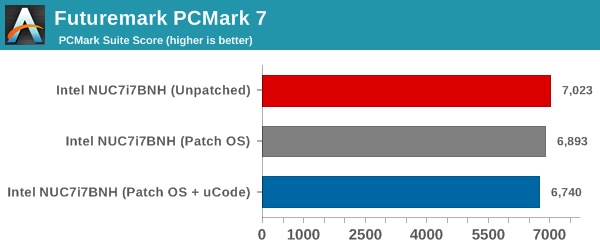
PCMark 7's PCMark Suite shows a 4% performance loss.
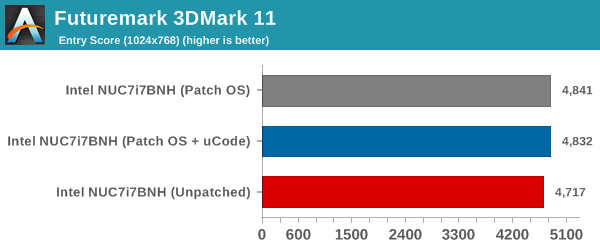
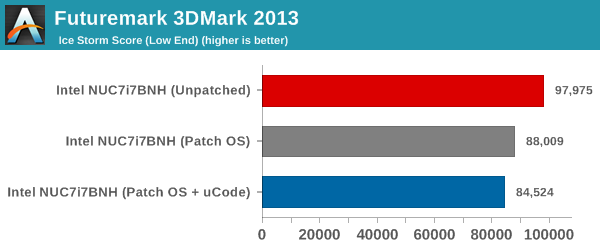
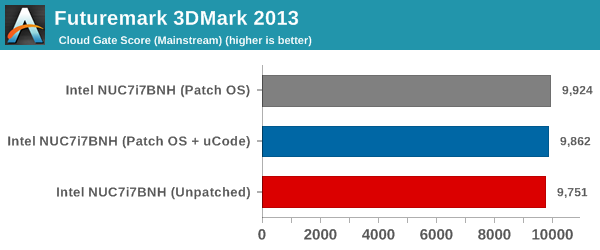
3DMark 11's entry level score and 3DMark 2013's Cloud Gate score actually end up better after the patch, but, 3DMark 2013's Ice Storm score shows a performance loss of more than 13%.
Futuremark PCMark 8 Storage Bench
PCMark 8 has a storage bench where certain common workloads such as loading games and document processing are replayed on the target drive. Results are presented in two forms, one being a benchmark number and the other, a bandwidth figure. We ran the PCMark 8 storage bench on the ADATA NVMe SSD in all the configurations.
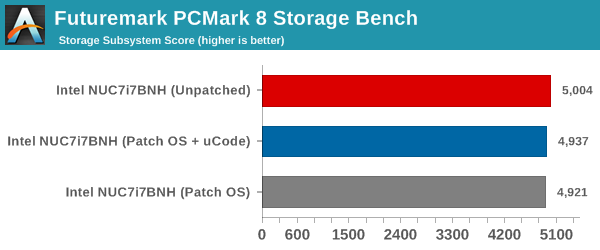
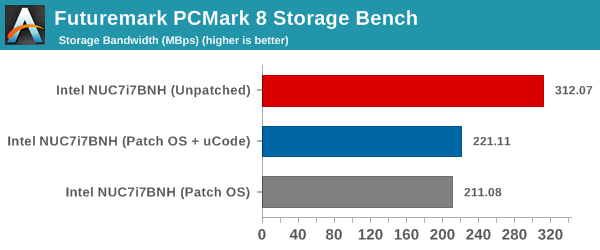
While the absolute score is just around 1.3% lower for the patched configuration, the storage bandwidth is around 29% worse. This significant performance loss is partly due to the NVMe drive performance now being CPU bound. It is highly likely that SATA drives will not experience such a drastic performance loss due to the patching.


83 Comments
View All Comments
Drazick - Saturday, March 24, 2018 - link
This is perfect!Thank You.
nocturne - Friday, March 23, 2018 - link
I'm wondering why there were different builds of windows tested, when the patches can be disabled via a simple powershell command. Performance can vary wildly for synthetic tests across subsequent builds, especially with insider builds.I can understand how this comparison gives you the /before and after/, but testing across different builds doesn't show you anything about the performance impact of the patches themselves.
ganeshts - Saturday, March 24, 2018 - link
BIOS patches (CPU microcode) can't be turned off from within the OS. But, I did use the InSpectre utility to do quick testing of the extensively affected benchmarks across all the builds (as applicable). The performance loss in those benchmarks were consistent with what we got with the final build (309) in a fully patched state (BIOS v0062).By the way, none of these builds are insider builds.
The reason we have listed these versions is just to indicate the build used to collect comprehensive data for the configuration.
The builds vary because the testing was done over the course of two months, as Intel kept revising their fix and MS also had to modify some of their patches.
ಬುಲ್ವಿಂಕಲ್ ಜೆ ಮೂಸ್ - Saturday, March 24, 2018 - link
Futuremark Storage Bench>Why are you getting 312MB/s (unpatched) bandwith for a drive that has an average read speed of 1000MB/s ?
Please clarify why this synthetic test has any basis in fact
ಬುಲ್ವಿಂಕಲ್ ಜೆ ಮೂಸ್ - Saturday, March 24, 2018 - link
I'm only asking this because I have been getting real world results that have little relationship to a synthetic testsFor example, simply swapping a CPU from a 2.6Ghz dualcore to a 3.3 Ghz quadcore while keeping all other hardware and software the same will add a couple seconds to my boot times (same O.S.)
Now, I never expected a faster quadcore to take longer to boot but it does
Is there more overhead as you add cores and could this be measured with a synthetic test?
Do you believe the synthetic test is actually measuring the bandwidth of the SSD, or how fast the CPU can process the data coming from the SSD?
How would this differ from a real world test?
hyno111 - Sunday, March 25, 2018 - link
Futuremark Storage Benchmark used real world load to test the overall disk throughput. The official sequential r/w speed does not represent actual use cases and is used for mainly for advertising.ಬುಲ್ವಿಂಕಲ್ ಜೆ ಮೂಸ್ - Sunday, March 25, 2018 - link
"Futuremark Storage Benchmark used real world load to test the overall disk throughput."----------------------------------------------------------------------------------------------------------------------
O.K., except my point was you are not measuring the disk throughput which would stay the same regardless of slowdowns in the processor
You are testing how fast the processor can handle the data coming from the disk "sorta"
The synthetic test would still not tell me that my faster quadcore would boot slower than my dualcore in the example given, therefore it also does not directly relate to a real world test
The disk hasn't changed and neither has it's actual throughput
ಬುಲ್ವಿಂಕಲ್ ಜೆ ಮೂಸ್ - Sunday, March 25, 2018 - link
"The synthetic test would still not tell me that my faster quadcore would boot slower than my dualcore in the example given, therefore it also does not directly relate to a real world test"-----------------------------------------------------------------------------------------------------------
Before you answer, I admit that the example above does not tell me the actual throughput of the disk.
It is used to show that the synthetic test does not directly relate to the results you might get in a real world test, yet both my example and AnandTech's example do not show the actual disk throughput which stays the same
akula2 - Saturday, March 24, 2018 - link
I do not have an iota of doubt that all these so-called vulnerabilities are well thought and deliberately pre-planned by the Deep State during the CPU architecture design stage. The result is huge loss of thrust in the brands like Intel who were/are part of this epic shamelessness! I'm pretty sure some of the tech media houses are in part of this syndicate willingly or not. Now, I do not give any benefit of doubt to AMD either.The gigantic problem: what is the alternative? The answer lies in nation taking the lead to setup companies away from the influence of Deep State, ideally in Asia.
FullmetalTitan - Saturday, March 24, 2018 - link
I thought I only had to deal with everyone's favorite Anandtech loony, but now we have the conspiracy nuts in here too?Can we get some forum moderation please?