Meltdown & Spectre: Analyzing Performance Impacts on Intel's NUC7i7BNH
by Ganesh T S on March 23, 2018 4:15 PM EST- Posted in
- Systems
- Spectre
- Benchmarks
- Meltdown
One of the consequences of the Meltdown and Spectre vulnerabilities, besides the immediate security concerns, is what it has meant for our ongoing testing and benchmarking operations. Along with accounting for the immediate performance changes from the required patches, we've also needed to look at how we present data and how we can (or can't) compare new patched systems to older unpatched systems. From an editorial perspective we need to ensure the continuity of our data as well as providing meaningful benchmark collections.
What we've found so far is that the impact of the Meltdown and Spectre patches varies with the workload and the type of test. Nate's GPU testing shrugs it off almost entirely, while Billy's SSD testing especially feels the pinch. In the middle of course are consumer system reviews, where workloads are more varied but also much more realistic and often more relevant as well. Of course, this is also the type hardware that we most often have to return when we're done, making it the most challenging to correct.
As everyone at AnandTech has been integrating the patches and updating their datasets in their own way, I wanted to offer some insight into what's going on for system testing. With several important systems set to launch in the first half of this year – particularly Intel's Hades Canyon – I've been going back and collecting updated results for use in those future reviews. In the process, I also wanted to document how performance has been impacted by these security patches and which benchmarks in particular have been affected.
Evaluation Setup
The Intel Kaby Lake NUC (NUC7i7BNH) was used for all the benchmarks presented in this article. It was chosen for two reasons. Being a relatively new system that consumers can still purchase in the market, evaluating it presents data of particular relevance to readers. Intel was prompt in providing BIOS updates to resolve the Meltdown and Spectre issues compared to other OEMs whose systems I had in hand for evaluation. The NUC was configured with the following specifications:
| Intel NUC7i7BNH (Unpatched) Specifications | |
| Processor | Intel Core i7-7567U Kaby Lake-U, 2C/4T, 3.5 - 4.0 GHz, 14nm+, 4 MB L2, 28W TDP |
| Memory | Crucial Ballistix Sport LT BLS16G4S240FSD.16FAD DDR4 15-15-15-35 @ 2133 MHz 2x16 GB |
| Graphics | Intel Iris Plus Graphics 650 |
| Disk Drive(s) | ADATA SX8000NP (128 GB; M.2 Type 2280 PCIe 3.0 x4 NVMe; Micron 32L 3D MLC) |
| Networking | Intel Dual Band Wireless-AC 8260 (2x2 802.11ac - 866 Mbps) 1x Intel 10/100/1000 RJ-45 GbE |
| Audio | 3.5mm Headphone Jack Capable of 5.1/7.1 digital output with HD audio bitstreaming (HDMI) |
| Miscellaneous I/O Ports | 4x USB 3.0 Type-A 1x Thunderbolt 3 USB-C 1x micro-SDXC |
| Operating System | Retail unit is barebones, but we installed Windows 10 Enterprise x64 |
| Pricing (Barebones) | USD 445 |
| Full Specifications | Intel NUC7i7BNH Specifications |
Three different patch configurations were benchmarked:
- Completely unpatched
- Only OS patches activated (Graph entry : Patch OS)
- Completely patched with updates to both the OS and the CPU microcode (Graph entry : Patch OS + uCode)
While it will (eventually) be an uncommon configuration, right now a lot of systems are still only running OS patches without their associated microcode updates, as the latter is still being distributed. At the same time, because the microcode patches are primarily for Spectre – Meltdown fixes are implemented at an OS level – this allows us to see just how much of an impact the Spectre fixes have on top of the existing Meltdown fixes.
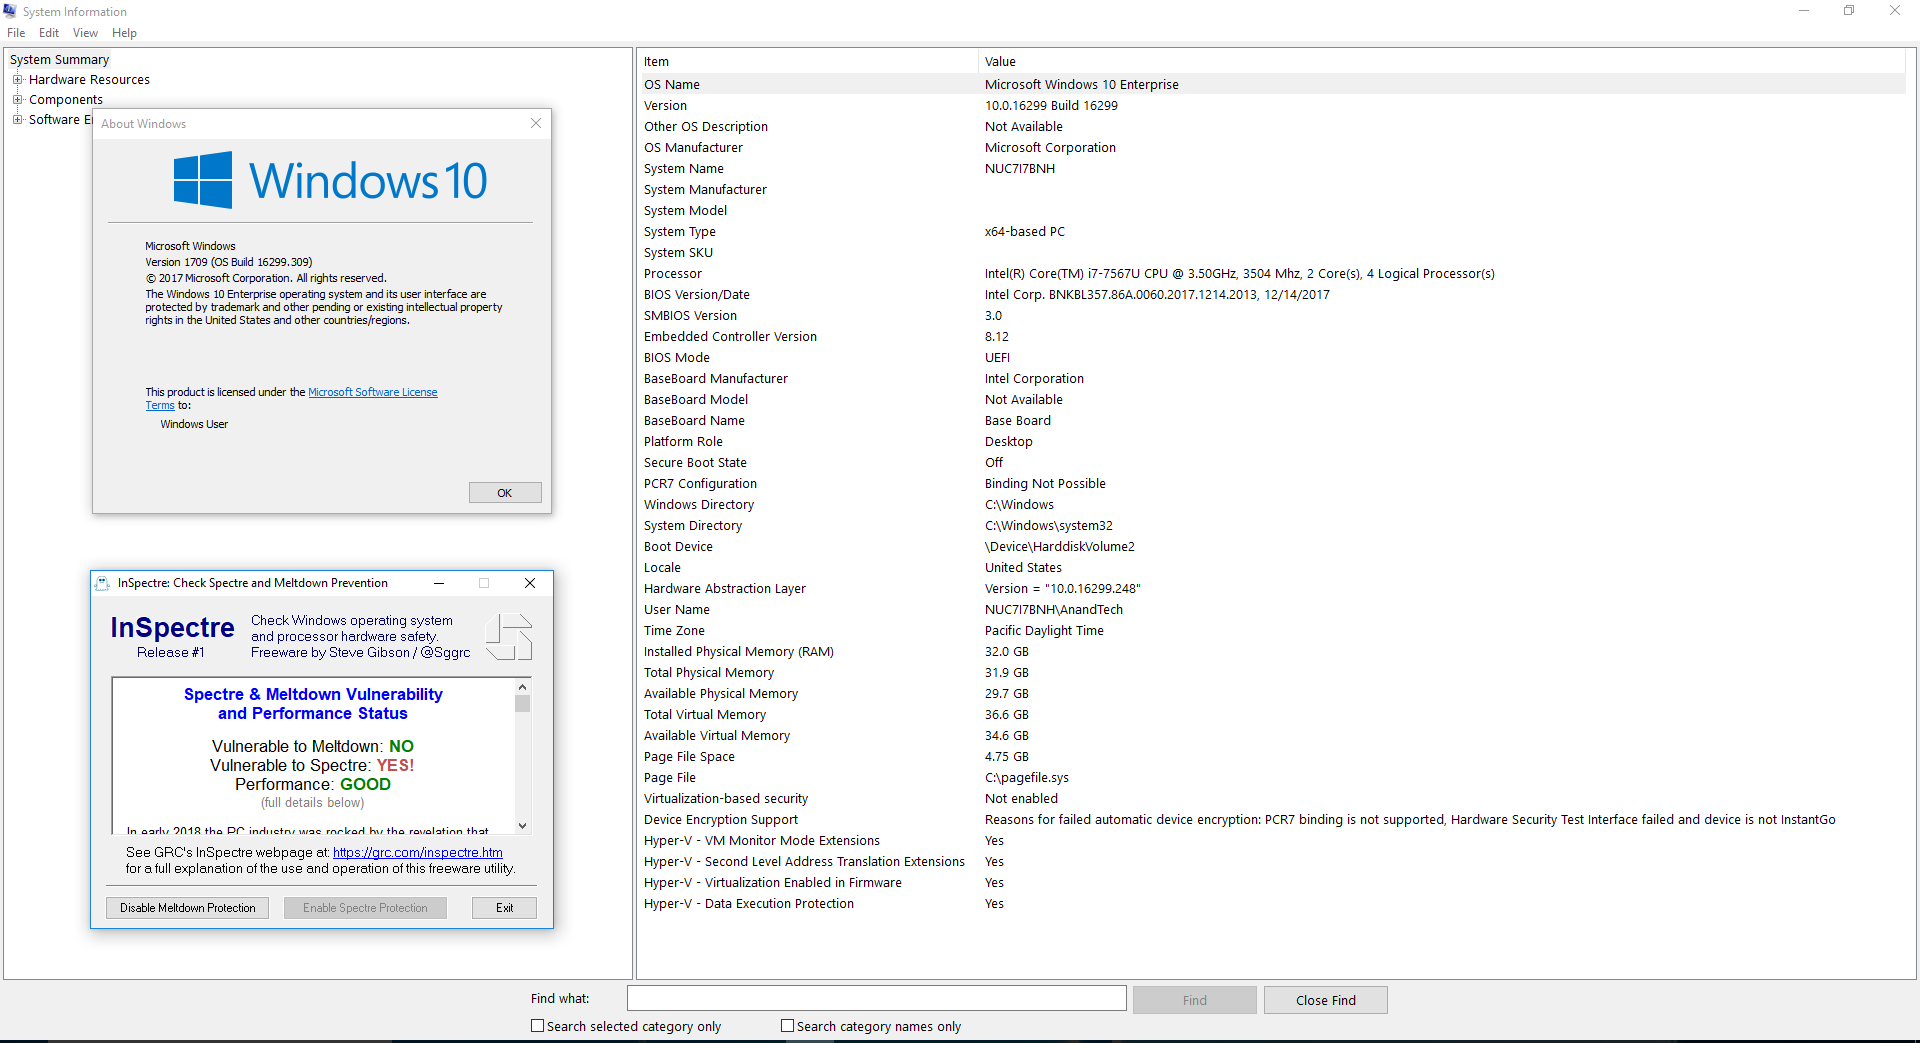
The completely unpatched system used Windows 10 version 16299.125 with BIOS v0054. As evident from the screenshot below, the system is susceptible to both Spectre and Meltdown.

The second configuration was processed with Windows 10 version 16299.309 with BIOS v0060. The screenshot below shows that the system is protected against Meltdown, but, not Spectre.
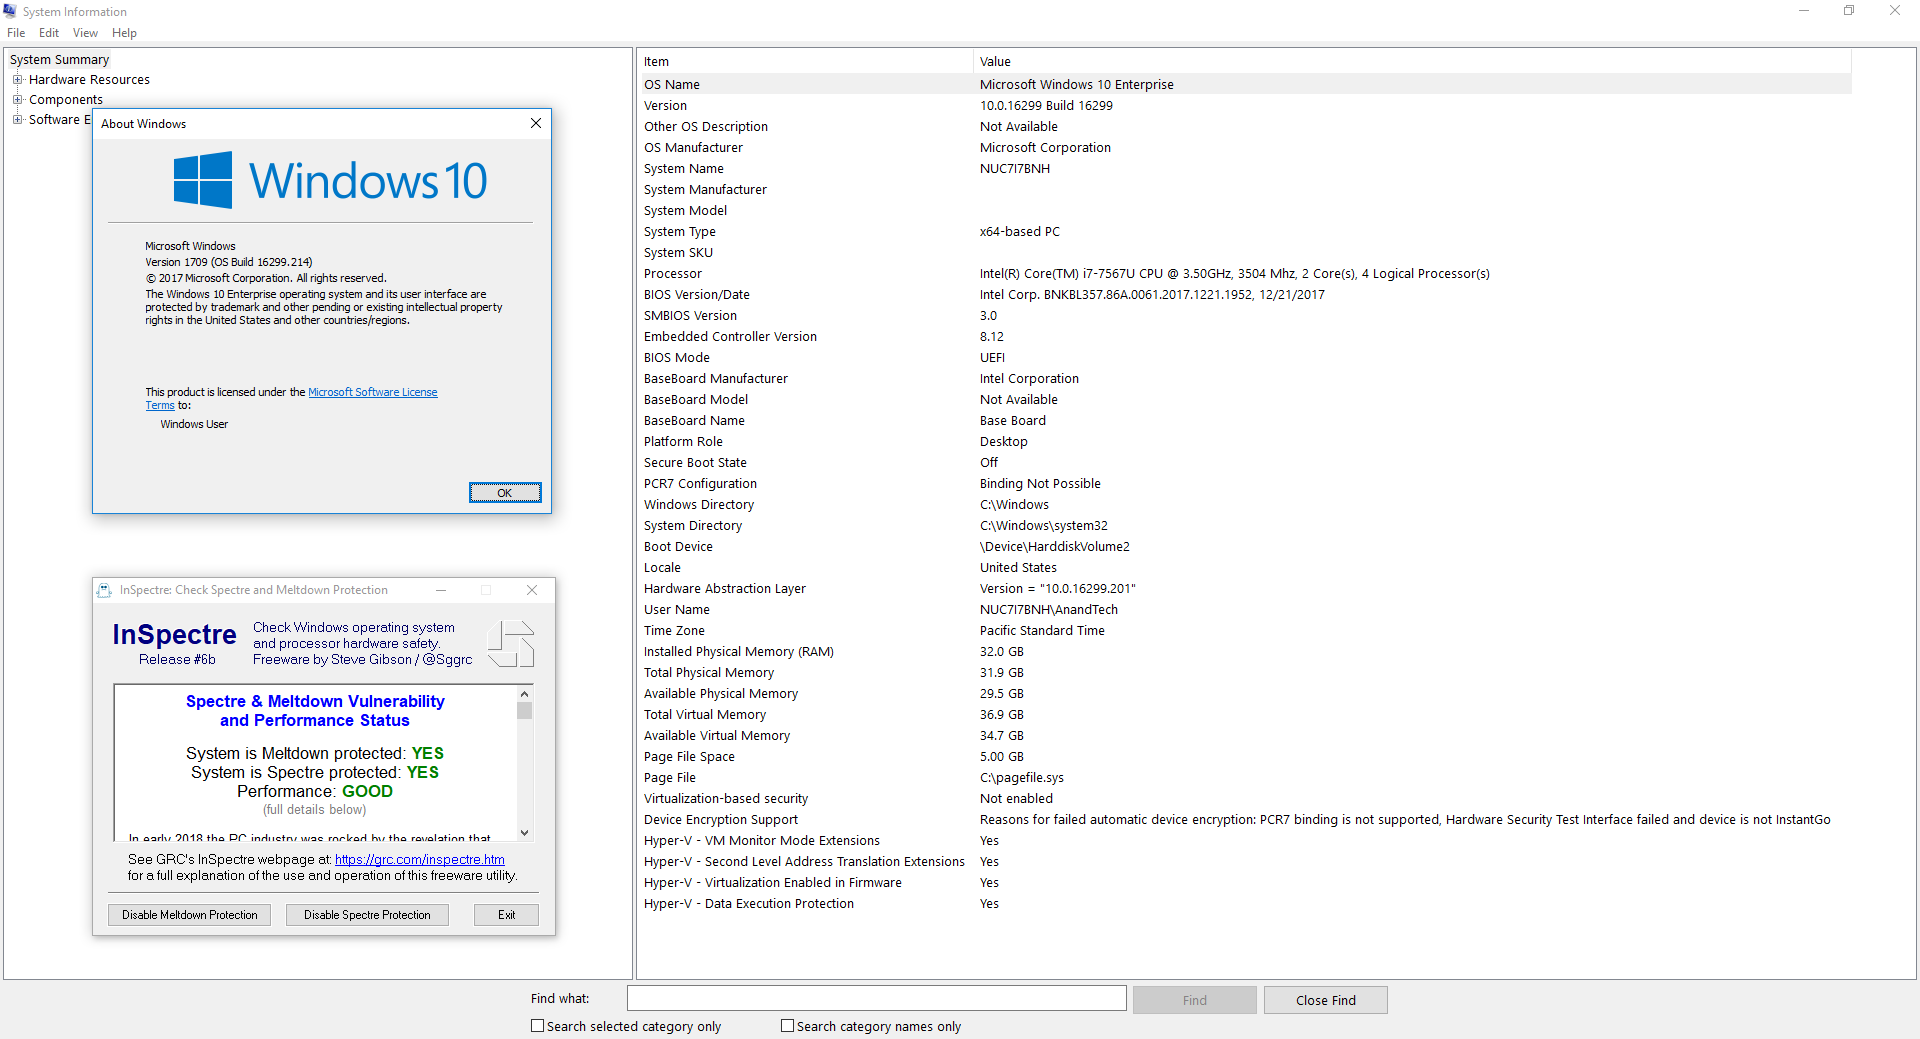
The final fully patched configuration was process with Windows 10 version 16299.214 and BIOS v0061. The current BIOS is v0062 (the one we used was available briefly before it was pulled to undergo additional QA for possible random restarts). This configuration shows full protection against both Meltdown and Spectre.
We used our standard test suite for low power desktops / industrial PCs in order to evaluate the impact of the patching on the performance of the system.


83 Comments
View All Comments
Drazick - Saturday, March 24, 2018 - link
This is perfect!Thank You.
nocturne - Friday, March 23, 2018 - link
I'm wondering why there were different builds of windows tested, when the patches can be disabled via a simple powershell command. Performance can vary wildly for synthetic tests across subsequent builds, especially with insider builds.I can understand how this comparison gives you the /before and after/, but testing across different builds doesn't show you anything about the performance impact of the patches themselves.
ganeshts - Saturday, March 24, 2018 - link
BIOS patches (CPU microcode) can't be turned off from within the OS. But, I did use the InSpectre utility to do quick testing of the extensively affected benchmarks across all the builds (as applicable). The performance loss in those benchmarks were consistent with what we got with the final build (309) in a fully patched state (BIOS v0062).By the way, none of these builds are insider builds.
The reason we have listed these versions is just to indicate the build used to collect comprehensive data for the configuration.
The builds vary because the testing was done over the course of two months, as Intel kept revising their fix and MS also had to modify some of their patches.
ಬುಲ್ವಿಂಕಲ್ ಜೆ ಮೂಸ್ - Saturday, March 24, 2018 - link
Futuremark Storage Bench>Why are you getting 312MB/s (unpatched) bandwith for a drive that has an average read speed of 1000MB/s ?
Please clarify why this synthetic test has any basis in fact
ಬುಲ್ವಿಂಕಲ್ ಜೆ ಮೂಸ್ - Saturday, March 24, 2018 - link
I'm only asking this because I have been getting real world results that have little relationship to a synthetic testsFor example, simply swapping a CPU from a 2.6Ghz dualcore to a 3.3 Ghz quadcore while keeping all other hardware and software the same will add a couple seconds to my boot times (same O.S.)
Now, I never expected a faster quadcore to take longer to boot but it does
Is there more overhead as you add cores and could this be measured with a synthetic test?
Do you believe the synthetic test is actually measuring the bandwidth of the SSD, or how fast the CPU can process the data coming from the SSD?
How would this differ from a real world test?
hyno111 - Sunday, March 25, 2018 - link
Futuremark Storage Benchmark used real world load to test the overall disk throughput. The official sequential r/w speed does not represent actual use cases and is used for mainly for advertising.ಬುಲ್ವಿಂಕಲ್ ಜೆ ಮೂಸ್ - Sunday, March 25, 2018 - link
"Futuremark Storage Benchmark used real world load to test the overall disk throughput."----------------------------------------------------------------------------------------------------------------------
O.K., except my point was you are not measuring the disk throughput which would stay the same regardless of slowdowns in the processor
You are testing how fast the processor can handle the data coming from the disk "sorta"
The synthetic test would still not tell me that my faster quadcore would boot slower than my dualcore in the example given, therefore it also does not directly relate to a real world test
The disk hasn't changed and neither has it's actual throughput
ಬುಲ್ವಿಂಕಲ್ ಜೆ ಮೂಸ್ - Sunday, March 25, 2018 - link
"The synthetic test would still not tell me that my faster quadcore would boot slower than my dualcore in the example given, therefore it also does not directly relate to a real world test"-----------------------------------------------------------------------------------------------------------
Before you answer, I admit that the example above does not tell me the actual throughput of the disk.
It is used to show that the synthetic test does not directly relate to the results you might get in a real world test, yet both my example and AnandTech's example do not show the actual disk throughput which stays the same
akula2 - Saturday, March 24, 2018 - link
I do not have an iota of doubt that all these so-called vulnerabilities are well thought and deliberately pre-planned by the Deep State during the CPU architecture design stage. The result is huge loss of thrust in the brands like Intel who were/are part of this epic shamelessness! I'm pretty sure some of the tech media houses are in part of this syndicate willingly or not. Now, I do not give any benefit of doubt to AMD either.The gigantic problem: what is the alternative? The answer lies in nation taking the lead to setup companies away from the influence of Deep State, ideally in Asia.
FullmetalTitan - Saturday, March 24, 2018 - link
I thought I only had to deal with everyone's favorite Anandtech loony, but now we have the conspiracy nuts in here too?Can we get some forum moderation please?