The Samsung Galaxy S9 and S9+ Review: Exynos and Snapdragon at 960fps
by Andrei Frumusanu on March 26, 2018 10:00 AM ESTGPU Performance & Power
Moving on to 3D and GPU workloads, we’re having a bit of a change in benchmarking format. I was very vocal about the current issue of peak and sustained performance in the Kirin 970 review article. Particularly last year’s generation exasperated the issue of devices posting unrealistic performance figures which at the end were unsustainable for longer periods of time. This delta has become quite large to the point that posting only peak performance is just outright misleading and I no longer wish to support this reporting style anymore. Starting with today’s review, we’ll be showcasing GPU performance benchmarks with both their peak and sustained performances, and focusing on the sustained performance for evaluating things such as gaming performance.
For the Galaxy S9 we have on one side Qualcomm’s Adreno 630 GPU running at 710 MHz. The new Adreno brings large architectural changes as Qualcomm has made significant alterations. Qualcomm is still very secretive about its GPU architecture, but we know that among the biggest high level changes are a doubling of the ALU pipelines in the GPU, doubling the compute performance over last year’s Adreno 540. Qualcomm has also improved texturing throughput by 50% and seemingly has 24 TMUs with 16 ROPs. Qualcomm has also consolidated its GPU cores – the Adreno 540 was a quad-core GPU while the new Adreno 630 is a two-core GPU. This mean each core seemingly has 256 ALU lanes at least capable of FP32 FMADDs, 12 TMUs and 8 ROPs. In raw theoretical specs this means at least 727 GFLOPs (counting FMADDs only), 17GTexels/s and 11.3GPixels/s.
On the Exynos Galaxy S9 we also see the new ARM Mali G72MP18 running at 572 MHz. The new GPU doesn’t have any higher level changes in raw specifications, however it promises micro-architectural improvements that improves the IPC of the GPU. A raw theoretical spec calculation results in 247 GFLOPs (FMADD only – 370 GFLOPs when adding the FADD units), 10.3 GTexels and GPixels/s. From the raw specifications we see that the Adreno outmatches the G72M18 by a significant margin, and we’ll see how that translates into real performance.
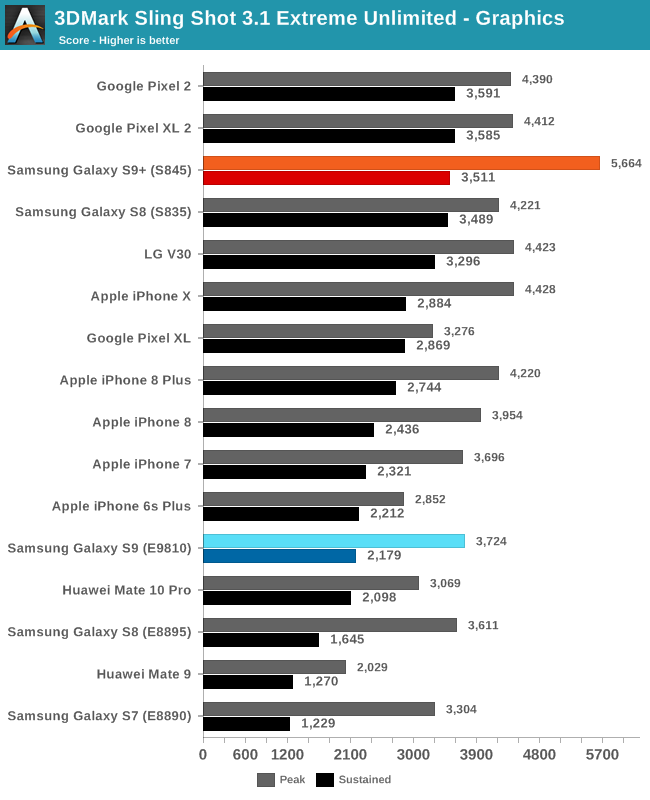
Starting with Futuremark’s 3DMark Sling Shot 3.1 Extreme Unlimited we see the Snapdragon 845 Galaxy S9+ achieving some great peak scores – as expected from our performance preview of the platform. However when looking at sustained performance, the new Snapdragon surprises, in a bad way. The Galaxy S9 Snapdragon here does not manage to exceed any of last year’s Snapdragon 835 devices in sustained performance, which is very odd. Qualcomm promised a 30% increase in efficiency on the GPU so reduced power should directly result in better performance, unless Samsung decided to target a lower TDP for the Galaxy S9. Indeed in terms of temperature the device remained very reasonable, but that was already the case with last year’s Galaxy S8.
The Exynos 9810 Galaxy S9 doesn’t manage to post significant peak performance improvements over the Exynos 8895, however the sustained scores are 32% better which is a very respectable jump and exceeds S.LSI’s promises of the SoC. The Mali GPUs unfortunately are just outmatched by the competition as they just lack in raw ALU performance.
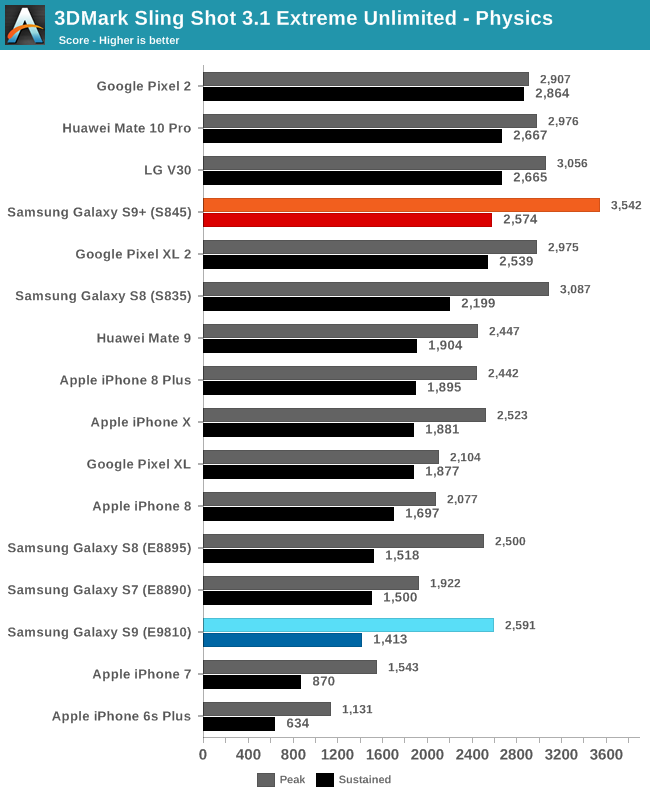
The physics benchmark of Sling Shot isn’t particularly a GPU benchmark but rather a CPU benchmark meaning to represent gaming workloads. How representative this is of games is another argument. Here the Snapdragon Galaxy S9 provides a good gain in peak performance, however the sustained performance isn’t able to distinguish itself from Snapdragon 835 devices with better thermal dissipation characteristics.
The Exynos S9’s peak performance is underwhelming given the new M3 cores but that’s already a story we covered in the system performance section. More disappointing is the fact that the sustained score sees a large regression and actually ends up worse than the Exynos Galaxy S7 and Galaxy S8’s.
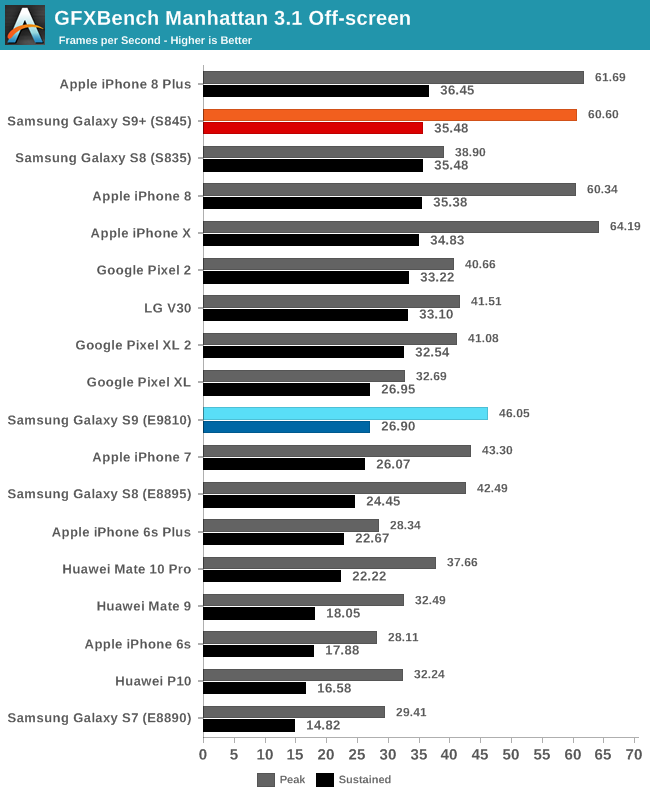
In GFXBench Manhattan 3.1 we see the again very impressive peak scores of the Snapdragon 845 Galaxy S9+ - however when we look again at the sustained scores it becomes very apparent that those figures are just wishful thinking that don’t last in prolonged gaming sessions. This criticism doesn’t only apply to the Snapdragon 845 but also very valid for Apple’s A11 GPU which sees enormous performance regressions after the device has heated up. The iPhone 8 Plus manages to edge out the top position in the ranking because of its higher thermal dissipation capacity thanks to its larger frame. The Snapdragon 845 Galaxy S9 manages to end up with the exactly same sustained performance as the Snapdragon 835 S8, posting no improvement.
The Exynos 9810 again lags behind, posting only a very slight improvement over last year’s Exynos 8895.
| GFXBench Manhattan 3.1 Offscreen Power Efficiency (System Active Power) |
||||
| Mfc. Process | FPS | Avg. Power (W) |
Perf/W Efficiency |
|
| Qualcomm QRD (Snapdragon 845) | 10LPP | 60.90 | ~4.38 | 13.90 fps/W |
| Galaxy S9+ (Snapdragon 845) | 10LPP | 61.16 | 5.01 | 11.99 fps/W |
| Galaxy S9 (Exynos 9810) | 10LPP | 46.04 | 4.08 | 11.28 fps/W |
| Galaxy S8 (Snapdragon 835) | 10LPE | 38.90 | 3.79 | 10.26 fps/W |
| LeEco Le Pro3 (Snapdragon 821) | 14LPP | 33.04 | 4.18 | 7.90 fps/W |
| Galaxy S7 (Snapdragon 820) | 14LPP | 30.98 | 3.98 | 7.78 fps/W |
| Huawei Mate 10 (Kirin 970) | 10FF | 37.66 | 6.33 | 5.94 fps/W |
| Galaxy S8 (Exynos 8895) | 10LPE | 42.49 | 7.35 | 5.78 fps/W |
| Galaxy S7 (Exynos 8890) | 14LPP | 29.41 | 5.95 | 4.94 fps/W |
| Meizu PRO 5 (Exynos 7420) | 14LPE | 14.45 | 3.47 | 4.16 fps/W |
| Nexus 6P (Snapdragon 810 v2.1) | 20Soc | 21.94 | 5.44 | 4.03 fps/W |
| Huawei Mate 8 (Kirin 950) | 16FF+ | 10.37 | 2.75 | 3.77 fps/W |
| Huawei Mate 9 (Kirin 960) | 16FFC | 32.49 | 8.63 | 3.77 fps/W |
| Huawei P9 (Kirin 955) | 16FF+ | 10.59 | 2.98 | 3.55 fps/W |
When looking at power consumption in GFXBench, we see that the Snapdragon 845 Galaxy S9+ posts worse power than the estimate we measured on the QRD845 from Qualcomm. The QRD platform had very high idle power – I had assumed much of that was due to platform components, however it looks like a large amount actually also part of the SoC. I had subtracted the idle power from the total device power consumption and that’s how we ended up with the posted power figure. The Galaxy S9+ doesn’t have any issues with idle power and thus we’re able to get a much better active power figure of the Snapdragon 845.
Unfortunately it looks like a very large amount of Qualcomm’s performance gains come through increased power – a notorious way to increase performance that I had hoped Qualcomm would have avoided and the root cause which led me to switch to the new testing methodology, and the timing couldn’t be better to catch the Snapdragon 845’s non-improvement in the Galaxy S9.
The Exynos 9810’s Mali G72MP18 shows some outstandingly good efficiency improvements over the lacklustre G71 of last year. At peak performance in Manhattan 3.1 we see a massive 95% efficiency improvement and we finally see the Exynos SoC return to rather reasonable power after 2 generations of exploding TDPs. Although the Exynos 9810 shows similar efficiency as the Snapdragon 845, the Snapdragon does so at much higher performance levels. At iso-performance Qualcomm still maintains a significant lead in efficiency. It’s curious to see that both the Galaxy S9’s showcase what seems to be worse sustained performance even though efficiency should have gone up – it’s possible that Samsung decided to limit the S9 to lower sustainable TDPs for cooler devices or longer battery life. We’ll have to verify this theory in another Snapdragon 845 device in the future – the sustained GPU performance might be higher in that case.
| GFXBench T-Rex Offscreen Power Efficiency (System Active Power) |
||||
| Mfc. Process | FPS | Avg. Power (W) |
Perf/W Efficiency |
|
| Qualcomm QRD (Snapdragon 845) | 10LPP | 150.80 | ~4.02 | 37.51 fps/W |
| Galaxy S9+ (Snapdragon 845) | 10LPP | 150.40 | 4.42 | 34.00 fps/W |
| Galaxy S9 (Exynos 9810) | 10LPP | 141.91 | 4.34 | 32.67 fps/W |
| Galaxy S8 (Snapdragon 835) | 10LPE | 108.20 | 3.45 | 31.31 fps/W |
| LeEco Le Pro3 (Snapdragon 821) | 14LPP | 94.97 | 3.91 | 24.26 fps/W |
| Galaxy S7 (Snapdragon 820) | 14LPP | 90.59 | 4.18 | 21.67 fps/W |
| Galaxy S8 (Exynos 8895) | 10LPE | 121.00 | 5.86 | 20.65 fps/W |
| Galaxy S7 (Exynos 8890) | 14LPP | 87.00 | 4.70 | 18.51 fps/W |
| Huawei Mate 10 (Kirin 970) | 10FF | 127.25 | 7.93 | 16.04 fps/W |
| Meizu PRO 5 (Exynos 7420) | 14LPE | 55.67 | 3.83 | 14.54 fps/W |
| Nexus 6P (Snapdragon 810 v2.1) | 20Soc | 58.97 | 4.70 | 12.54 fps/W |
| Huawei Mate 8 (Kirin 950) | 16FF+ | 41.69 | 3.58 | 11.64 fps/W |
| Huawei P9 (Kirin 955) | 16FF+ | 40.42 | 3.68 | 10.98 fps/W |
| Huawei Mate 9 (Kirin 960) | 16FFC | 99.16 | 9.51 | 10.42 fps/W |
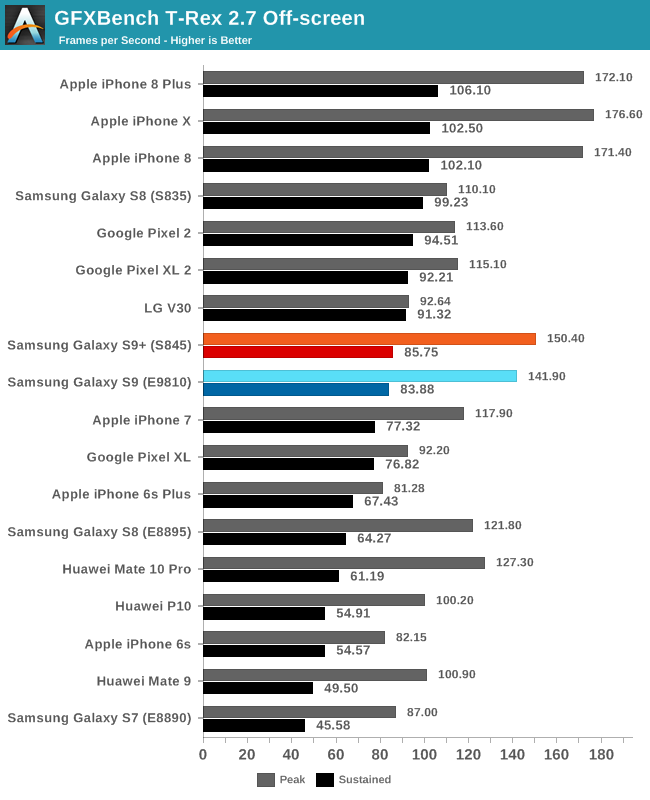
Finally in T-Rex the new Mali G72 again makes outstandingly good efficiency leaps, beating last year’s Exynos 8895 by considerable margins and even outmatching the Snapdragon 835. It’s not enough to quite match the Snapdragon 845 but it’s a close fight. Both Galaxy S9 variants end up with similar sustained performance here.
The Exynos 9810’s massive GPU improvements greatly change the evaluation of ARM’s G72 GPU as it significantly better than its predecessor and even HiSilicon’s implementation in the Kirin 970.
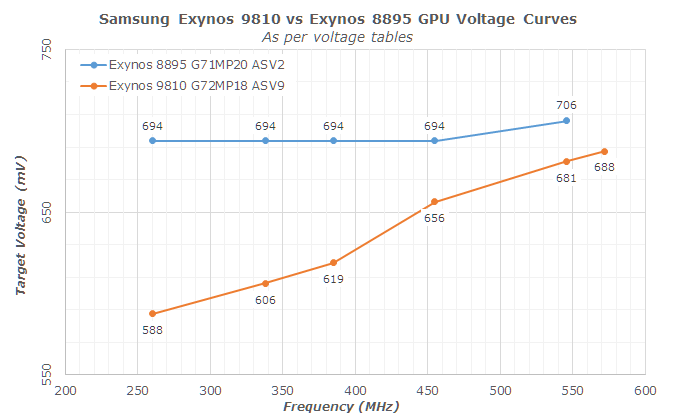
Looking at the voltage tables it looks like S.LSI also fixed the yield and voltage issues. The Exynos 8895 had terrible binnings for the GPU block as it was the by far worst yielded block among units. This caused the voltage to generally look extremely flat – something which is no longer an issue on the Exynos 9810’s G72, which should bode even better for efficiency at lower clocks.
Overall for GPU workloads the Exynos 9810 provided the far bigger jumps in the Galaxy S9. Again unfortunately the Exynos isn’t compared in a vacuum and Qualcomm still has a significant lead in performance and efficiency, even if the Snapdragon 845 in the Galaxy S9+ ended up below our projections and expectations. Fortunately for Qualcomm they were in such a lead anyway that having a hiccup this generation isn’t much of a big deal for the Galaxy S9 – however it did allow for the competition to slightly catch up. The Adreno especially has significant advantage in ALU heavy workloads, something that will become the norm in 3D workloads as the mobile ecosystem will evolve in that direction for increased graphics quality.
I will also add that I encountered a very embarrassing issue on the Snapdragon Galaxy S9+. While testing the sustained performance in the benchmarks the phone suddenly started to quit the app with a warning that the phone was overheating. The phone was warm but in no ways any hotter than one would normally expect from today’s phones and some problematic units from the past.
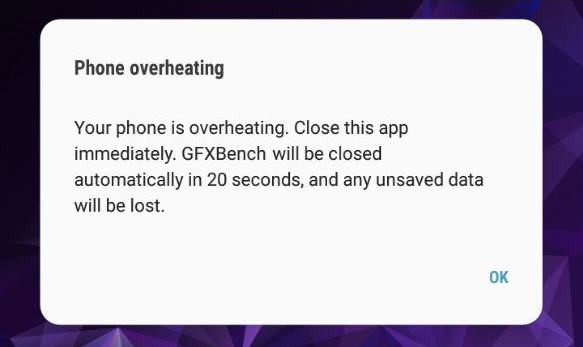
Snapdragon 845 Galaxy S9+ Prompt
The issue that did actually shock me was that that while the prompt forcibly quit GFXBench, running 3DMark Sling Shot while the device was warm kept crashing and rebooting the phone. The last time I’ve had a phone crash on me like that was Huawei’s Mate 7 on its release firmware, and that was because it was removing the thermal limits through benchmark detection. Samsung doesn’t seem to do any benchmark detection here and it’s throttling – but still having the thermal drivers insufficiently calibrated and allow for the SoC to reach thermal panic is quite embarrassing.
With that said, as disclaimer, we’ve reached out to Samsung about the issue and they are sending a replacement unit. I haven’t seen other issues with this unit so I’m tending towards the possibility of simply uncalibrated thermal drivers rather than defective units. We’ll retest the unit once it arrives and if it shows different behaviour or different power characteristics we’ll update the article accordingly.
Update April 3rd: I've received and replicated the same GPU behaviour of the Snapdragon 845 variant of the S9+, which point out to this beind a firmware issue.


190 Comments
View All Comments
lopri - Monday, March 26, 2018 - link
Oh and there is no Fraps on Android or (gasp) iOS as far as I know. One that actually works.jjj - Tuesday, March 27, 2018 - link
Anything is better than synthetic.What happens in this review is a great example because judgements are made about how perf and power are balanced, without any testing in appropriate workloads. The SoC needs to be tuned for actual workloads, and aside from anecdotal evidence, there is no data. AT loves to say that it's data driven but if you don't have the relevant data.... You can't determine the color of the sky by licking a wall.
Synthetic benchmarks are a best effort from a developer but they can never match real world apps. PCMark for example, some phones with 8xA53 at 2GHz can score over 5k points so almost as much as the Exynos here.
It's been 10 years and nobody makes any effort to review phones. Even battery life, it's either synthetic or browsing with nothing else going on, utterly unrealistic.
ZolaIII - Tuesday, March 27, 2018 - link
You can profile individual apps & use them while doing so but the results will vary to much even if your usage is minor like for instance video player & same video. Simply Android platformom has to much back processes and noise for reliable measuring especially if those are lite tasks.techconc - Tuesday, April 17, 2018 - link
Do you understand the sub tests in something like Geekbench for example? Are you going to claim that they are not representative of real world functions that your phone uses on a regular basis? Screaming no synthetic benchmarks like a lunatic without offering a better and generally accepted alternative is not helpful.peevee - Friday, April 6, 2018 - link
Firefox. With an adblocker installed.name99 - Tuesday, March 27, 2018 - link
Oh FFS.Different benchmarks test DIFFERENT THINGS. What you call a synthetic benchmark is a great test of very specific parts of the CPU or memory system.
If you don't care about details, don't freaking look at the synthetic benchmarks and go straight to whatever whole system benchmark it is that floats your boat.
But don't throw a hissy fit because the guys who ARE interested in **CPU** performance don't want to see numbers that are fscked up by the OS behavior, the performance of the flash, or whatever other random nonsense gets it to confuse the issue.
lilmoe - Wednesday, March 28, 2018 - link
Of course, synthetics at constant max load have never reflected real world performance of mobile devices. We know this. What I like about these deep dives is the fact that you can evaluate the data yourself and make educated assumptions about what one might expect. Here's a rough summary of what I believe is applicable to both chips in the S9 with the current firmware:- Exynos is the faster chip. But it's handicapped for feature and performance parity with the SD. Optimizations in Oreo might have contributed to how such a conservative scheduler passed QC.
- Snapdragon will be snappier (no pun intended) in certain workloads and general app load times.
- Exynos will last longer in games, video playback and streaming.
- Snapdragon might last longer in web browsing.
- Snapdragon Will last longer in video and voice calls in unoptimized messaging apps.
These are examples I thought of quickly. It's funny, but I also watch some youtubers doing their "tests". Combine these tests with the data presented here and there you go.
eastcoast_pete - Monday, March 26, 2018 - link
For me, the winner is - the one that didn't compete here: the S8+ (with the 835 chipset). Seriously. With the S9/9+ now out, an S8 or S8+ can be had for hundreds of $ less than the corresponding S9 or S9+ , and that makes the S8 or S8+ right now the best value for money among higher-end Sammys. To boot, nobody will notice it's last year's model, as the S8 and S9 look almost identical. IMO, the main upside for an S9+ is the camera, especially the video capabilities, but, at what a price -ouch!Processors: Progress - What progress? The 845 did a bit better than the 835, mostly by being clocked higher (and eating a bit more power), while the new M3-based Exynos was really disappointing. I am also disappointed with Qualcomm's 845, and here is why: the 845 is manufactured in the (supposedly) more energy efficient 10 nm LPP (Samsung's newest and hottest), so - where are the power savings? I can't help but wonder how an 835 manufactured in 10 nm LPP would have fared? As is, the 835 mostly holds it's own where it counts (real life situations), and is far from being outclassed by the 845 (or the M3 Exynos, but that is kicking a chip when it's down).
Lastly, regarding Andrei's comment on Samsung's software: right on. Samsung has pretty consistently made the best or among the best Android smartphones out there - I have owned a few of them. But, while Samsung's hardware generally get's a A or A- , the software that Samsung loads (burdens) their phones with has ranged between annoying to debilitating; apparently, that carelessness on the software side extends all the way down to low-level programming this time - not good.
Several years ago and for a short time, one could buy a Samsung phone with stock Android from Google directly. While I realize that won't happen again any time soon, I would love to see an S8+ (835) with just plain-vanilla Android 8.1 (or 9?), no skin, no bloatware. I might even buy one, before they're gone.
BigDH01 - Monday, March 26, 2018 - link
The perf/W graph is confusing to me as it's measured in fps/W. This breaks down into (frames/sec)/(J/s). Why not just frames/joule?Andrei Frumusanu - Monday, March 26, 2018 - link
Because Watts are important to note as a thermal indicator. It gives more information than frames/J.