Marrying Vega and Zen: The AMD Ryzen 5 2400G Review
by Ian Cutress on February 12, 2018 9:00 AM ESTPower Consumption
For our power consumption metrics, we use a Prime 95 blend on fixed threads to generate a strong load, and then poll the internal power registers that determine power state calculations to get the power consumption. Each processor is different in how it reports its power, which depends on the level of control the processor has: some of the more advanced CPUs, such as Ryzen, will provide per-core power numbers, while the latest Intel CPUs only give a figure for the CPUs as a whole but also include DRAM controller and uncore power consumption.
An interesting element to the power consumption on the Ryzen APUs, due to the unified power delivery subsystem in play feeding the CPU and the integrated graphics, is that the power registers only report half the power consumption when probed (e.g. when 14W, shows 7W). As of yet, we are unsure if this has a knock-on effect on how the processor adjusts its turbo modes in response to power consumption. Nonetheless, a simple scaling factor gives the following results.
Total Package: The Whole Processor
For this data, we take the values of the processor as a whole, which includes all the interconnect, memory controllers, PCIe root complexes, etc. The system is still only loading the CPU cores with minimal effect on the rest of the system, however depending on how the power is managed, some of the sub-systems still remain enabled.
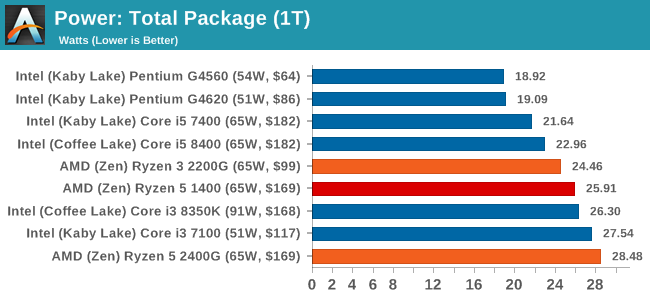
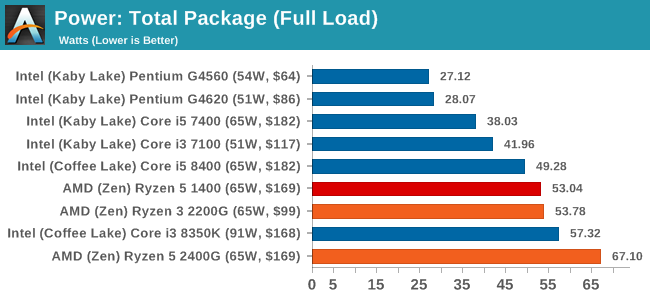
At full load, the difference between the Ryzen 5 and the other Ryzen CPUs shows that the 2400G is using more of its upper margin, compared to the 1400 which is rated at the same power (note TDP is only determined at the base frequency), but the extra frequency of the 2400G means that there is extra power draw overall. Part of this is due to the Infinity Fabric, which we will see below. But what these tests also underline is that in a quad-core configuration, the Intel CPUs are still very power efficient.
Cores Only: Pure Work
For the processors that split out the data, we can look at the power consumption of the cores on their own, without any of the sub-systems, like uncore, mesh, or infinity fabric. This usually paints a different picture to the package power.
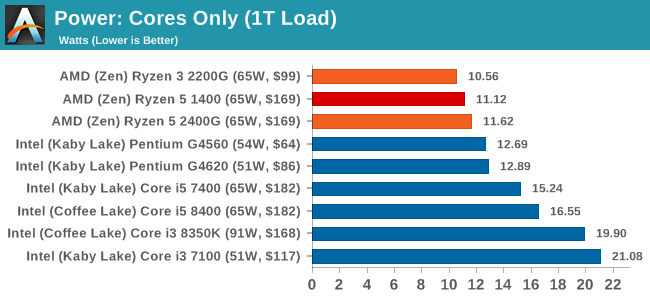
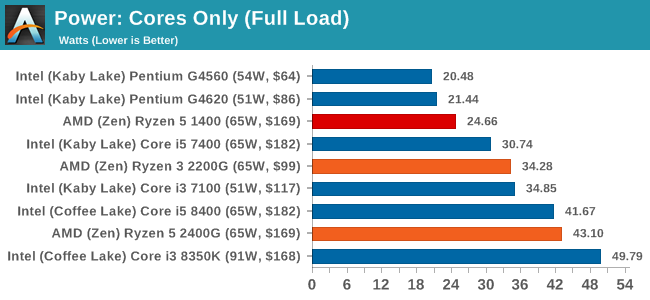
For the core only power, the Ryzen 5 2400G uses less power than the Core i3-8350K, despite the situation being reversed when considering the whole package. This means that Infinity Fabric takes a lot of power here, and the ring bus solution that Intel uses benefits from being simpler, and Intel can push more power to its individual cores.


177 Comments
View All Comments
jjj - Monday, February 12, 2018 - link
Playable means 30FPS and has been that for.. ever.AndrewJacksonZA - Monday, February 12, 2018 - link
Typo page 1: "Fast forward almost two years, to the start of 2018. Intel did have a second generation eDRAM product"The linked article is from 2 May 2016, not the start of 2018.
richardginn - Monday, February 12, 2018 - link
If only the ram used in the 2400G review kits was not so god damn expensive. It is more expensive than the CPU.Ian Cutress - Monday, February 12, 2018 - link
This is true - technically we were sampled a different DDR4-3200 kit to be used. Normally our policy here is to use the maximum supported DRAM frequency of the processor for these tests - in the past there is a war of words when reviews do not, from readers and companies. When we do our memory scaling piece, it'll be with a wide range of offerings.richardginn - Monday, February 12, 2018 - link
I certainly want to see the memory scaling piece before making a purchase.RBD117 - Monday, February 12, 2018 - link
Hey Ian, thanks for the great review. I think your Cinebench-1T scores should be higher, in the 151-160 range for the 2200G and 2400G respectively. AMD pushed a microcode update through BIOS to testers very very late last week. A lot of the changes significantly boosted single-thread performance in general, even in some games. Did you folks end up getting this?Ian Cutress - Monday, February 12, 2018 - link
I only started testing with the new BIOS: can you confirm the difference is on both the motherboards AMD sampled? Some got MSI, others got GIGABYTE. We had MSI.RBD117 - Monday, February 12, 2018 - link
Ah okay. I believe it should have been updated on both MSI and Gigabyte...at least, I was told it should have landed on both platforms for standardization.jrs77 - Monday, February 12, 2018 - link
I would've loved to see you compare the 2400G against the i7-5775C with regards to 1080p gaming, as I can play games like Borderlands, WoW or Diablo in 1080p with medium settings on my Broadwell Iris graphics just fine.If the 2400G doesn't allow for higher graphics settings than the i7-5775C, than I don't really see them taking the crown for integrated graphics. intel is just too stoopid to use what they have it seems.
nierd - Monday, February 12, 2018 - link
When that i7 cost less than 150 then it will make the chart. At the price point it's at I can buy one of these chips and a $200 graphics card and do laps around the i7 all day.