HiSilicon Kirin 970 - Android SoC Power & Performance Overview
by Andrei Frumusanu on January 22, 2018 9:15 AM ESTGPU Performance
For 3D graphics and games the Kirin 970 is the first GPU to make use of ARM’s second generation Bifrost GPU architecture, Heimdall / G72. The new IP is an evolutionary update over last year’s Mali G71 with density and efficiency updates.
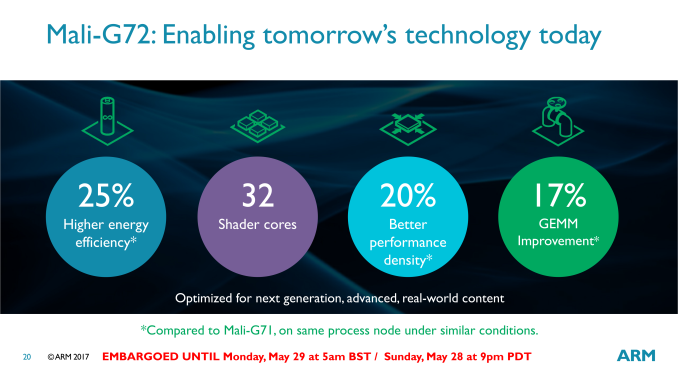
The density increase as well as the process node shrink allowed HiSilicon to increase the GPU core count by 50% from 8 to 12 while still reducing the GPU block complex in terms of absolute silicon area. There is no mincing around with words on last year’s G71 performance: The GPU unfortunately came nowhere near the projected efficiency goals stated by ARM in neither the Exynos 8895 nor the Kirin 960. The Kirin 960 especially was remarkable in terms of how we saw devices powered by it reach until then unheard of average power figures at the peak performance states, ranging at around the 9W mark for the Mate 9. I still remember 2 years ago I had praised HiSilicon for implementing a GPU conservative enough that it could properly sustain its maximum performance state within the device thermal envelope, staying below 4W. Nevertheless before continuing the power argument any power figures of the Kirin 970, let’s go over the peak performance figures of the most commonly used industry 3D benchmarks.
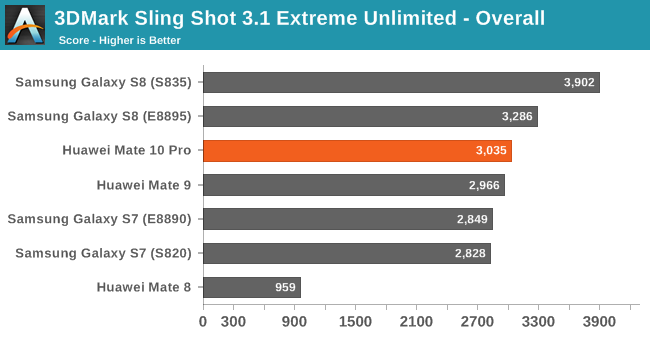
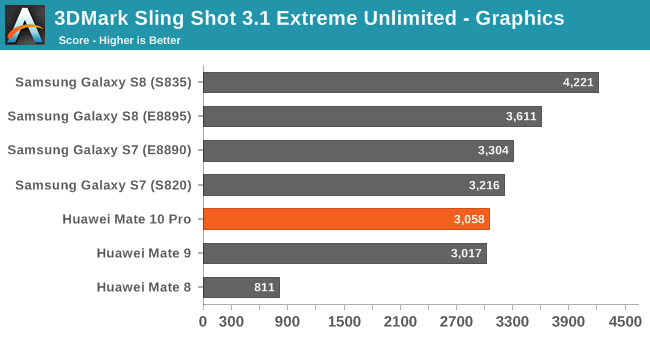
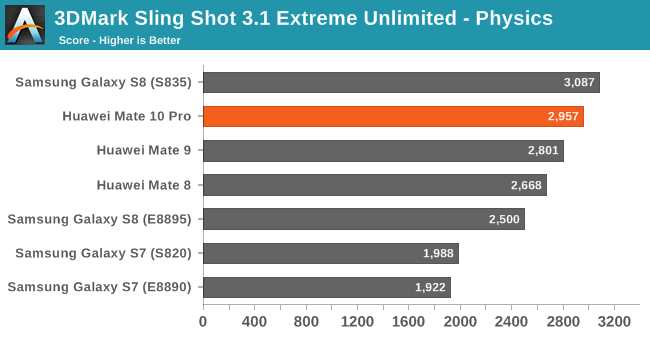
In 3DMark Sling Shot 3.1 Extreme Unlimited we see the G72 on the Kirin 970, oddly enough, not improving at all. I ran the benchmark several times and made sure thermals weren’t the causen but still the phone wasn’t able to increase performance over the Kirin 960 save for a small increase in the physics score. I’m not yet sure what the cause is here – I wasn’t able to monitor GPU frequency as I haven’t rooted the device yet so I can’t be sure that it’s using some kind of limitation mechanism.
Moving on to Kishonti’s GFXBench we see the Kirin 970 achieve its theoretical gains of 15-20%. As a reminder while the GPU core count increased 50% from 8 to 12 cores, the frequency has been vastly reduced from the maximum 1033MHz down to 746MHz, leaving only a more marginal performance upgrade to be expected.
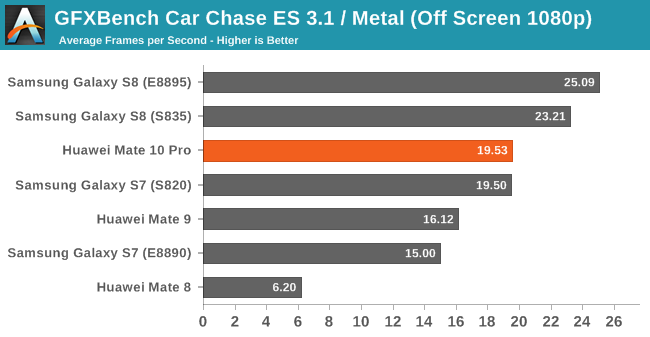
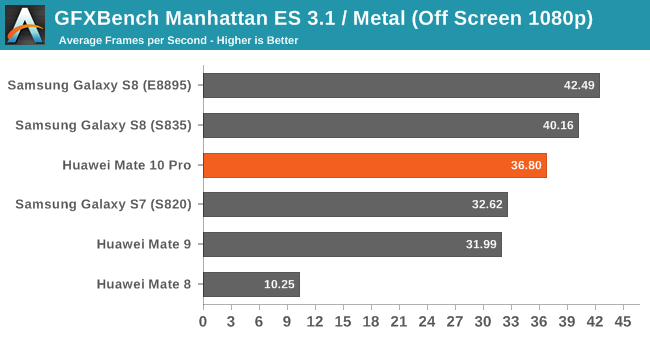
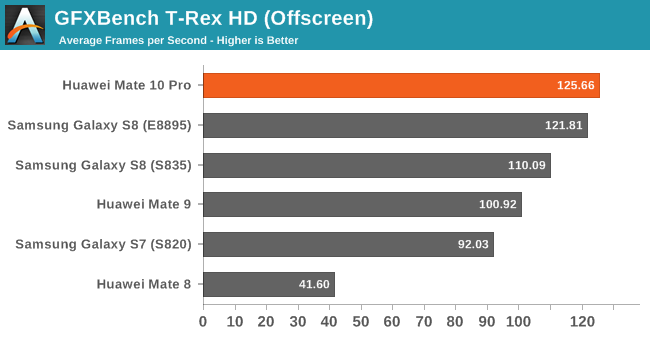
The Kirin 970’s G71MP12 ends up slightly below the Exynos 8895’s G71MP20 and the Snapdragon 835’s Adreno 540 in more compute bound workloads such as Manhattan 3.1 or Car Chase. In TRex the GPU has a slight lead over the Exynos 8895, but only when the device is cool as it quickly starts throttling down from its maximum frequencies at slightly more elevated temperatures.
GPU Power Efficiency
| GFXBench Manhattan 3.1 Offscreen Power Efficiency (System Active Power) |
||||
| Mfc. Process | FPS | Avg. Power (W) |
Perf/W Efficiency |
|
| Galaxy S8 (Snapdragon 835) | 10LPE | 38.90 | 3.79 | 10.26 fps/W |
| LeEco Le Pro3 (Snapdragon 821) | 14LPP | 33.04 | 4.18 | 7.90 fps/W |
| Galaxy S7 (Snapdragon 820) | 14LPP | 30.98 | 3.98 | 7.78 fps/W |
| Huawei Mate 10 (Kirin 970) | 10FF | 37.66 | 6.33 | 5.94 fps/W |
| Galaxy S8 (Exynos 8895) | 10LPE | 42.49 | 7.35 | 5.78 fps/W |
| Meizu PRO 5 (Exynos 7420) | 14LPE | 14.45 | 3.47 | 4.16 fps/W |
| Nexus 6P (Snapdragon 810 v2.1) | 20Soc | 21.94 | 5.44 | 4.03 fps/W |
| Huawei Mate 8 (Kirin 950) | 16FF+ | 10.37 | 2.75 | 3.77 fps/W |
| Huawei Mate 9 (Kirin 960) | 16FFC | 32.49 | 8.63 | 3.77 fps/W |
| Huawei P9 (Kirin 955) | 16FF+ | 10.59 | 2.98 | 3.55 fps/W |
In terms of average platform active power consumption, the Mate 10 shows as significant improvement over last year’s Mate 9. In Manhattan we go down from 8.6W to 6.33W. In terms of efficiency at similar peak performance the Kirin 970 managed only slightly outpace the Exynos 8895 and Mali G71. The architectural improvements that the G72 is promised to bring is counter-acted by the fact that the Exynos uses more cores at lower frequencies (and efficient voltages), with both ending up at a similar performance and efficiency point. The same effect applies between the Kirin 960 and 970, but in reverse. Here the addition of more cores at a lower frequency amplifies the process and architectural efficiency gains versus the G71, resulting in an absolute efficiency gain of 57% at peak performance, which comes near to Huawei’s stated claims of 50% efficiency gain. It’s to be noted that the true efficiency gain at same performance points is likely near the 100% mark, meaning for the same peak Kirin 960 performance levels the Kirin 970 and G72 implementation will be nearly double its efficiency.
Whilst this all might sound optimistic in terms of performance and efficiency gains, it’s all rather meaningless as the Mate 10 and Kirin 970 average power drains are still far above sustainable thermal envelopes at 6.3W.
| GFXBench T-Rex Offscreen Power Efficiency (System Active Power) |
||||
| Mfc. Process | FPS | Avg. Power (W) |
Perf/W Efficiency |
|
| Galaxy S8 (Snapdragon 835) | 10LPE | 108.20 | 3.45 | 31.31 fps/W |
| LeEco Le Pro3 (Snapdragon 821) | 14LPP | 94.97 | 3.91 | 24.26 fps/W |
| Galaxy S7 (Snapdragon 820) | 14LPP | 90.59 | 4.18 | 21.67 fps/W |
| Galaxy S8 (Exynos 8895) | 10LPE | 121.00 | 5.86 | 20.65 fps/W |
| Galaxy S7 (Exynos 8890) | 14LPP | 87.00 | 4.70 | 18.51 fps/W |
| Huawei Mate 10 (Kirin 970) | 10FF | 127.25 | 7.93 | 16.04 fps/W |
| Meizu PRO 5 (Exynos 7420) | 14LPE | 55.67 | 3.83 | 14.54 fps/W |
| Nexus 6P (Snapdragon 810 v2.1) | 20Soc | 58.97 | 4.70 | 12.54 fps/W |
| Huawei Mate 8 (Kirin 950) | 16FF+ | 41.69 | 3.58 | 11.64 fps/W |
| Huawei P9 (Kirin 955) | 16FF+ | 40.42 | 3.68 | 10.98 fps/W |
| Huawei Mate 9 (Kirin 960) | 16FFC | 99.16 | 9.51 | 10.42 fps/W |
Again on T-Rex, which is less ALU heavy and more texture, fill-rate and triangle rate bound we see the Kirin 970 reach impressive performance levels at impressively bad power figures. At 7.93W the phone doesn’t seem to be able to sustain the peak frequencies for long as even on a second consecutive run we see performance go down as thermal throttling kicks in. So while the Kirin 970 slightly outpaces the Exynos 8895 in performance it does so at 25% lower efficiency.
Against the Kirin 960 as again the previous paragraph might sound dire, it’s a vast improvement in comparison. So disastrous was the peak power of the Mate 9 that still at 28% higher peak performance, the Mate 10 still manages to be 53% more efficient, again validating Huawei’s marketing claims. At iso-performance again I estimate that the Kirin 970 is likely near twice as efficient over the Kirin 960.
In all this you’ll have probably noticed Qualcomm consistently at the top of the charts. Indeed over the last few generations it seems Qualcomm is the only company which has managed to increase performance by architectural and process node improvements without ever increasing and exploding the power budget. On the contrary, Qualcomm seems to steadily able to lower the average power generation after generation, reaching an extremely impressive 3.5-3.8W on the Snapdragon 835. It’s widely quoted that mobile GPU’s power budget is 1.5-2W, but over the last few years the only high-end GPU able to achieve that seems to be Adreno, and this gap seems to be ever increasing generation after generation.
In my review of the Mate 8 there were a lot of users in the comments section who still deemed the performance of the T880MP4 in the Kirin 950 unsatisfactory and uncompetitive. Unfortunately this view is the common widespread notion among most users and most media, and was one of main complaints of Huawei devices in the past. Today Huawei is able to compete at the top of the benchmarks, but at a rather ghastly hidden cost of efficiency and unsustainable power that is perfectly honest a lot harder to test and to communicate to users.
AnandTech is also partly guilty here; you have to just look at the top of the page: I really shouldn’t have published those performance benchmarks as they’re outright misleading and rewarding the misplaced design decisions made by the silicon vendors. I’m still not sure what to do here and to whom the onus falls onto. As long as vendors keep away from configuring devices with unreachable and unsustainable performance states on 3D workloads and keep within reasonable levels then the whole topic becomes a non-issue. If things don’t improve then we’ll have to have a hard look on how to handle these situations I’m considering simply no longer posting any GPU peak performance figures in device reviews and keeping them in separate more technical SoC pieces such as this one.
Overall I think we’re at a critical point in time for the mobile GPU landscape. Qualcomm currently holds such an enormous lead in performance, density and efficiency that other silicon vendors who rely on IP vendors for their GPUs are in a tight and precarious situation in terms of their ability to offer competitive products. I see this as a key catalyst as to why Apple has stated to planning to abandon Imagination as their GPU IP provider in upcoming SoCs and why Samsung has accelerated efforts to replace Mali and also introduce their in-house S-GPU maybe as early as 2019. Over the course of the next 2 years we’ll be seeing some exciting shake-ups of the SoC GPU space, that’s for sure.


116 Comments
View All Comments
Hairses - Monday, January 22, 2018 - link
I think I see what you mean, but the graphs themselves need work. It's not clear which axis belongs to which data point, and the scaling/notation on the left axis makes no sense. If you look at some of them, quite often the longest data bar has a mark showing a value somewhere halfway between two data points with bars smaller than it. So it less to confusion; is the length of the bar one metric, and the mark another? And it's not that the bars are reversed scale either. It's not even clear why there are two axis at all, now I take a second look.It's a good idea for a viz, but needs some rejigging. Maybe it looks clearer on desktop, mobile may be too small.
GreenReaper - Thursday, January 25, 2018 - link
I agree with Hairses; that the graph - and in particular its legend - could do with revision.At first I thought the CPU was faster than the NPU because the arrows seemed to be pointing at the end which related to the measurement in question - instead it seems the intent was "travelling in this direction". You could perhaps keep the text and arrows the same, but position them at the relevant sides of the graph.
gregounech - Monday, January 22, 2018 - link
This is the reason why I read Anandtech, good job Andrei.hlovatt - Monday, January 22, 2018 - link
Great article. Any chance of same for Apple?Andrei Frumusanu - Monday, January 22, 2018 - link
As mentioned in the article, Apple stuff is a lot harder. Measuring power efficiency for example requires me to tear down an iPhone to tap the battery. It's my goal for the future as I work through the backlog of articles.lilmoe - Monday, January 22, 2018 - link
If you're going the extra mile, it would be nice to see multiple generations of Apple SoCs tested, not just the A11. Thanks.mczak - Monday, January 22, 2018 - link
Great article.I'd have liked to see though GPU efficiency figures at sustained power levels. Not that it should reverse the outcome, but I would expect the efficiency of the newest Samsung/Qualcomm/Hisilicon chips to be a bit closer then.
Andrei Frumusanu - Monday, January 22, 2018 - link
It's something that I'm considering doing for device reviews (Sustained power levels obviously differ between devices).jospoortvliet - Saturday, January 27, 2018 - link
Another issue might be the silicon lottery... hard to deal with but especially small differences might be due to a particularly leaky or good piece of silicon...Wardrive86 - Monday, January 22, 2018 - link
Excellent article! Hope to see many more like this. I wish the mid range could also be included but I understand how time consuming these tests were. Great job, well done!