HiSilicon Kirin 970 - Android SoC Power & Performance Overview
by Andrei Frumusanu on January 22, 2018 9:15 AM ESTCPU Performance: SPEC2006
SPEC2006 has been a natural goal to aim for as a keystone analysis benchmark as it’s a respected industry standard benchmark that even silicon vendors use for architecture analysis and development. As we saw SPEC2017 released last year SPEC2006 is getting officially retired on January 9th, a funny coincidence as we now finally start using it.
As Android SoCs improve in power efficiency and performance it’s now becoming more practical to use SPEC2006 on consumer smartphones. The main concerns of the past were memory usage for subtests such as MCF, but more importantly sheer test runtimes for battery powered devices. For a couple of weeks I’ve been busy in porting over SPEC2006 to a custom Android application harness.
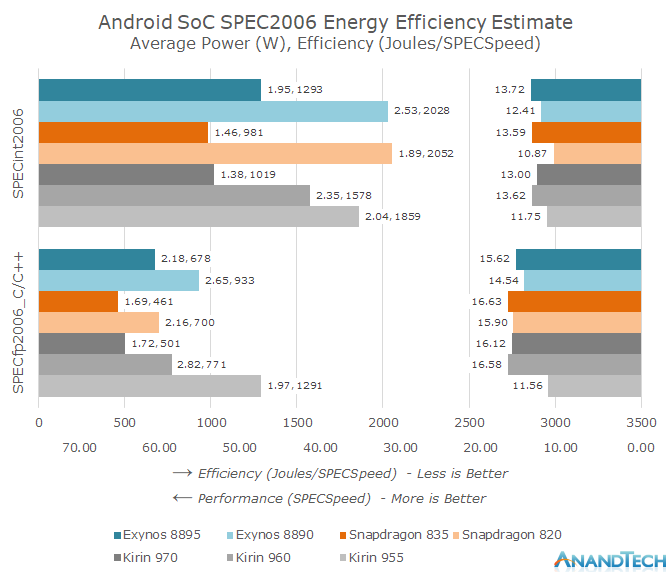
The results are quite remarkable as we see both the generational performance as well as efficiency improvements from the various Android SoC vendors. The Kirin 970 in particular closes in on the efficiency of the Snapdragon 835, leapfrogging the Kirin 960 and Exynos SoCs. We also see a non-improvement in absolute performance as the Kirin 970 showcases a slight performance degradation over the Kirin 960 – with all SoC vendors showing just meagre performance gains over the past generation.
Going Into The Details
Our new SPEC2006 harness is compiled using the official Android NDK. For this article the NDK version used in r16rc1 and Clang/LLVM were used as the compilers with just the –Ofast optimization flags (alongside applicable test portability flags). Clang was chosen over of GCC because Google has deprecated GCC in the NDK toolchain and will be removing the compiler altogether in 2018, making it unlikely that we’ll revisit GCC results in the future. It should be noted that in my testing GCC 4.9 still produced faster code in some SPEC subtests when compared to Clang. Nevertheless the choice of Clang should in the future also facilitate better Androids-to-Apples comparisons in the future. While there are arguments that SPEC scores should be published with the best compiler flags for each architecture I wanted a more apples-to-apples approach using identical binaries (Which is also what we expect to see distributed among real applications). As such for this article the I’ve chosen to pass to the compiler the –mcpu=cortex-a53 flag as it gave the best average overall score among all tested CPUs. The only exception was the Exynos M2 which profited from an additional 14% performance boost in perlbench when compiled with its corresponding CPU architecture target flag.
As the following SPEC scores are not submitted to the SPEC website we have to disclose that they represent only estimated values and thus are not officially validated submissions.
Alongside the full suite for CINT2006 we are also running the C/C++ subtests of CFP2006. Unfortunately 10 out of the 17 tests in the CFP2006 suite are written in Fortran and can only be compiled with hardship with GCC on Android and the NDK Clang lacks a Fortran front-end.
As an overview of the various run subtests, here are the various application areas and descriptions as listed on the official SPEC website:
| SPEC2006 C/C++ Benchmarks | ||||||
| Suite | Benchmark | Application Area | Description | |||
| SPECint2006 (Complete Suite) |
400.perlbench | Programming Language | Derived from Perl V5.8.7. The workload includes SpamAssassin, MHonArc (an email indexer), and specdiff (SPEC's tool that checks benchmark outputs). | |||
| 401.bzip2 | Compression | Julian Seward's bzip2 version 1.0.3, modified to do most work in memory, rather than doing I/O. | ||||
| 403.gcc | C Compiler | Based on gcc Version 3.2, generates code for Opteron. | ||||
| 429.mcf | Combinatorial Optimization | Vehicle scheduling. Uses a network simplex algorithm (which is also used in commercial products) to schedule public transport. | ||||
| 445.gobmk | Artificial Intelligence: Go | Plays the game of Go, a simply described but deeply complex game. | ||||
| 456.hmmer | Search Gene Sequence | Protein sequence analysis using profile hidden Markov models (profile HMMs) | ||||
| 458.sjeng | Artificial Intelligence: chess | A highly-ranked chess program that also plays several chess variants. | ||||
| 462.libquantum | Physics / Quantum Computing | Simulates a quantum computer, running Shor's polynomial-time factorization algorithm. | ||||
| 464.h264ref | Video Compression | A reference implementation of H.264/AVC, encodes a videostream using 2 parameter sets. The H.264/AVC standard is expected to replace MPEG2 | ||||
| 471.omnetpp | Discrete Event Simulation | Uses the OMNet++ discrete event simulator to model a large Ethernet campus network. | ||||
| 473.astar | Path-finding Algorithms | Pathfinding library for 2D maps, including the well known A* algorithm. | ||||
| 483.xalancbmk | XML Processing | A modified version of Xalan-C++, which transforms XML documents to other document types. | ||||
| SPECfp2006 (C/C++ Subtests) |
433.milc | Physics / Quantum Chromodynamics | A gauge field generating program for lattice gauge theory programs with dynamical quarks. | |||
| 444.namd | Biology / Molecular Dynamics | Simulates large biomolecular systems. The test case has 92,224 atoms of apolipoprotein A-I. | ||||
| 447.dealII | Finite Element Analysis | deal.II is a C++ program library targeted at adaptive finite elements and error estimation. The testcase solves a Helmholtz-type equation with non-constant coefficients. | ||||
| 450.soplex | Linear Programming, Optimization | Solves a linear program using a simplex algorithm and sparse linear algebra. Test cases include railroad planning and military airlift models. | ||||
| 453.povray | Image Ray-tracing | Image rendering. The testcase is a 1280x1024 anti-aliased image of a landscape with some abstract objects with textures using a Perlin noise function. | ||||
| 470.lbm | Fluid Dynamics | Implements the "Lattice-Boltzmann Method" to simulate incompressible fluids in 3D | ||||
| 482.sphinx3 | Speech recognition | A widely-known speech recognition system from Carnegie Mellon University | ||||
It’s important to note one extremely distinguishing aspect of SPEC CPU versus other CPU benchmarks such as GeekBench: it’s not just a CPU benchmark, but rather a system benchmark. While benchmarks such as GeekBench serve as a good quick view of basic workloads, the vastly greater workload and codebase size of SPEC CPU stresses the memory subsystem to a much greater degree. To demonstrate this we can see the individual subtest performance differences when solely limiting the memory controller frequency, in this case on the Mate 10 Pro with the Kirin 970.

An increase in main memory latency from just 80ns to 115ns (Random access within access window) can have dramatic effects on many of the more memory access sensitive tests in SPEC CPU. Meanwhile the same handicap essentially has no effect on the GeekBench 4 single-threaded scores and only marginal effect on some subtests of the multi-threaded scores.
In general the benchmarks can be grouped in three categories: memory-bound, balanced memory and execution-bound, and finally execution bound benchmarks. From the memory latency sensitivity chart it’s relatively easy to find out which benchmarks belong to which category based on the performance degradation. The worst memory bound benchmarks include the infamous 429.mcf but alongside we also see 433.milc, 450.soplex, 470.lbm and 482.sphinx3. The least affected such as 400.perlbench, 445.gobmk, 456.hmmer, 464.h264ref, 444.namd, 453.povray and with even 458.sjeng and 462.libquantum slightly increasing in performance pointing out to very saturated execution units. The remaining benchmarks are more balanced and see a reduced impact on the performance. Of course this is an oversimplification and the results will differ between architectures and platforms, but it gives us a solid hint in terms of separation between execution and memory-access bound tests.
As well as tracking performance (SPECspeed) I also included a power tracking mechanisms which relies on the device’s fuel-gauge for current measurements. The values published here represent only the active power of the platform, meaning it subtracts idle power from total absolute load power during the workloads to compensate for platform components such as the displays. Again I have to emphasize that the power and energy figures don't just represent the CPU, but the SoC system as a whole, including interconnects, memory controllers, DRAM, and PMIC overhead.
Alongside the current generation SoCs I also included a few predecessors to be able to track the progress that has happened over the last 2 years in the Android space and over CPU microarchitecture generations. Because the runtime of all benchmarks is in excess of 5 hours for the fastest devices we are actively cooling the phones with an external fan to ensure consistent DVFS frequencies across all of the subtests and that we don’t favour the early tests.


116 Comments
View All Comments
Hairses - Monday, January 22, 2018 - link
I think I see what you mean, but the graphs themselves need work. It's not clear which axis belongs to which data point, and the scaling/notation on the left axis makes no sense. If you look at some of them, quite often the longest data bar has a mark showing a value somewhere halfway between two data points with bars smaller than it. So it less to confusion; is the length of the bar one metric, and the mark another? And it's not that the bars are reversed scale either. It's not even clear why there are two axis at all, now I take a second look.It's a good idea for a viz, but needs some rejigging. Maybe it looks clearer on desktop, mobile may be too small.
GreenReaper - Thursday, January 25, 2018 - link
I agree with Hairses; that the graph - and in particular its legend - could do with revision.At first I thought the CPU was faster than the NPU because the arrows seemed to be pointing at the end which related to the measurement in question - instead it seems the intent was "travelling in this direction". You could perhaps keep the text and arrows the same, but position them at the relevant sides of the graph.
gregounech - Monday, January 22, 2018 - link
This is the reason why I read Anandtech, good job Andrei.hlovatt - Monday, January 22, 2018 - link
Great article. Any chance of same for Apple?Andrei Frumusanu - Monday, January 22, 2018 - link
As mentioned in the article, Apple stuff is a lot harder. Measuring power efficiency for example requires me to tear down an iPhone to tap the battery. It's my goal for the future as I work through the backlog of articles.lilmoe - Monday, January 22, 2018 - link
If you're going the extra mile, it would be nice to see multiple generations of Apple SoCs tested, not just the A11. Thanks.mczak - Monday, January 22, 2018 - link
Great article.I'd have liked to see though GPU efficiency figures at sustained power levels. Not that it should reverse the outcome, but I would expect the efficiency of the newest Samsung/Qualcomm/Hisilicon chips to be a bit closer then.
Andrei Frumusanu - Monday, January 22, 2018 - link
It's something that I'm considering doing for device reviews (Sustained power levels obviously differ between devices).jospoortvliet - Saturday, January 27, 2018 - link
Another issue might be the silicon lottery... hard to deal with but especially small differences might be due to a particularly leaky or good piece of silicon...Wardrive86 - Monday, January 22, 2018 - link
Excellent article! Hope to see many more like this. I wish the mid range could also be included but I understand how time consuming these tests were. Great job, well done!