The AnandTech Coffee Lake Review: Initial Numbers on the Core i7-8700K and Core i5-8400
by Ian Cutress on October 5, 2017 9:00 AM EST- Posted in
- CPUs
- Intel
- Core i5
- Core i7
- Core i3
- 14nm
- Coffee Lake
- 14++
- Hex-Core
- Hyperthreading
Benchmarking Performance: CPU Office Tests
The office programs we use for benchmarking aren't specific programs per-se, but industry standard tests that hold weight with professionals. The goal of these tests is to use an array of software and techniques that a typical office user might encounter, such as video conferencing, document editing, architectural modeling, and so on and so forth.
All of our benchmark results can also be found in our benchmark engine, Bench.
Chromium Compile (v56)
Our new compilation test uses Windows 10 Pro, VS Community 2015.3 with the Win10 SDK to compile a nightly build of Chromium. We've fixed the test for a build in late March 2017, and we run a fresh full compile in our test. Compilation is the typical example given of a variable threaded workload - some of the compile and linking is linear, whereas other parts are multithreaded.
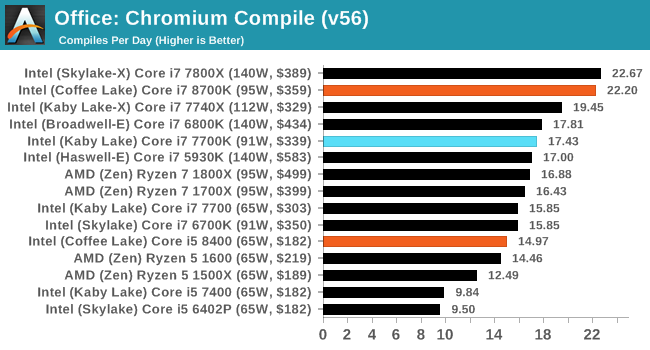
For our compile test, it would appear that the extra memory width afforded by the quad-channel memory of Skylake-X can have a direct benefit in compile performance.
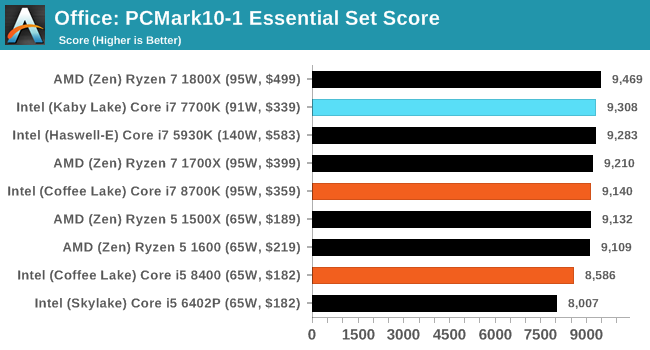
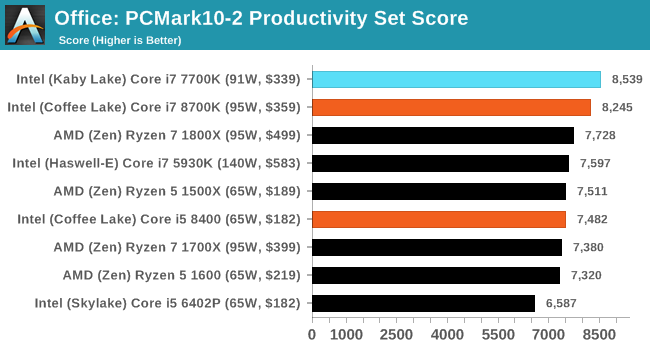
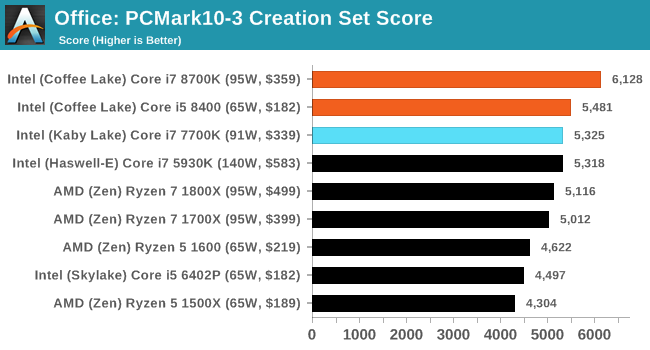
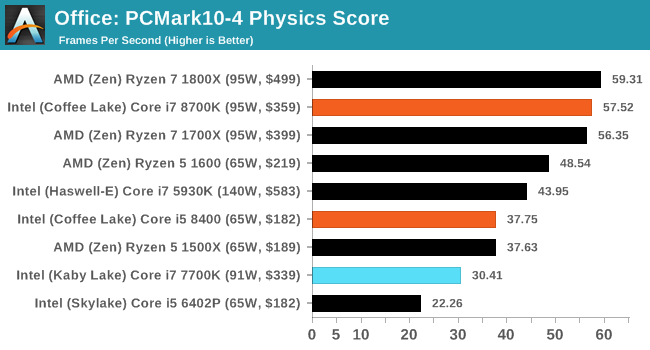
PCMark 10
PCMark 10 is the 2017 update to the family favorite, PCMark 8. PCMark 8 has been part of our test bed since the latest update in Q1. For the most part it runs well, although for some processors it doesn’t recognize, some tests will not complete, leading to holes in our benchmark data (there’s also an odd directory quirk in one test that causes issues). The newest version, PCMark 10, is the answer.
The new test is adapted for more 2016/2017 workflows. With the advent of office applications that perform deeper compute tasks, or the wave of online gamers and streamers, the idea behind PCMark 10 is to give a better ‘single number’ result that can provide a comparable metric between systems. Single metrics never tell the whole story, so we’re glad that Futuremark provides a very detailed breakdown of what goes on.
Ganesh’s article on PCMark 10 goes into more detail than I will here, but the ‘Extended Benchmark’ runs through four different sets of tests: Essential, Productivity, Creation and Gaming. Each of these have sub-test results as well, including startup performance, web performance, video conferencing, photo/video editing, spreadsheets, rendering, and physics, which you can find in Bench.
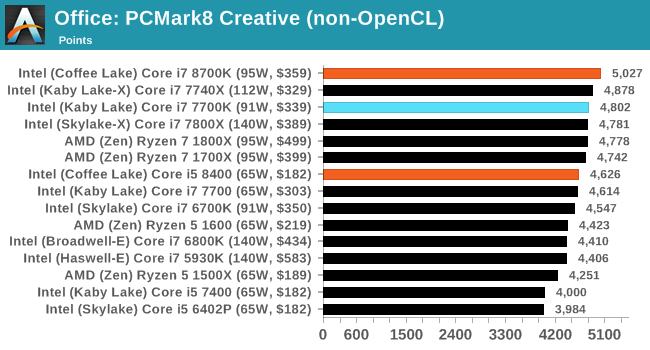
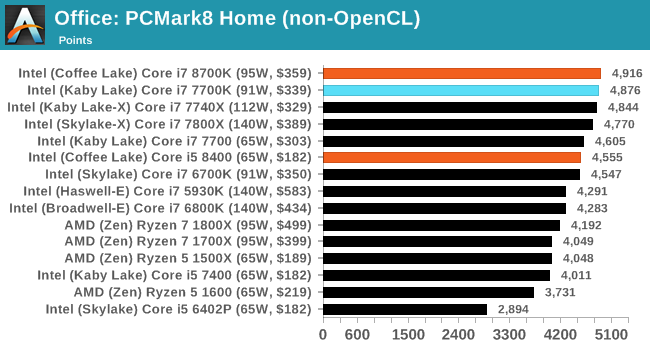
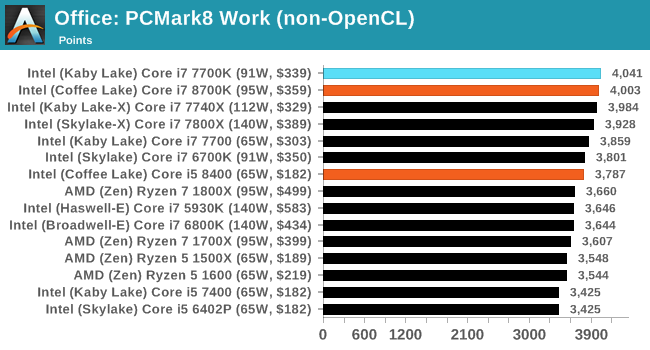
PCMark8: link
Despite originally coming out in 2008/2009, Futuremark has maintained PCMark8 to remain relevant in 2017. On the scale of complicated tasks, PCMark focuses more on the low-to-mid range of professional workloads, making it a good indicator for what people consider 'office' work. We run the benchmark from the commandline in 'conventional' mode, meaning C++ over OpenCL, to remove the graphics card from the equation and focus purely on the CPU. PCMark8 offers Home, Work and Creative workloads, with some software tests shared and others unique to each benchmark set.


222 Comments
View All Comments
watzupken - Thursday, October 5, 2017 - link
I don't know how you define as "best" for review graph. The point is that we are seeing new 6 cores solution from Intel, so very logically, people will be trying to compare apples with apples, i.e. 6 core solutions from both camps. So omitting the results from 1600 actually looks more than meets the eye to me, especially when you folks previously did a R5 1600X review.Ian Cutress - Thursday, October 5, 2017 - link
I'm adding the R5 1600 data. It'll take 10-15 minutes, it's not a quick process. brbwatzupken - Thursday, October 5, 2017 - link
Thank you Ian. Please do add the data for R5 1600/X. From what I read elsewhere, it appears there is good competition between the Core i5 and R5 1600/X series.Ian Cutress - Thursday, October 5, 2017 - link
OK, should be added. You might have to CTRL+F5 to clear the cache to see the updated versions.WinterCharm - Thursday, October 5, 2017 - link
Thanks Ian!It really is the most logical and fair comparison.
WinterCharm - Thursday, October 5, 2017 - link
You really should have chosen SIMILARLY priced chips (So, 1700 / 1600 / 1600X) because it would have shown "here's the performance you get per dollar" which ultimately is what matters.Ian Cutress - Thursday, October 5, 2017 - link
My ultimate goal is to have a graph widget that lets you select which CPU you want to focus on, and it automatically pulls in several around that price point as well as some of the same family. I'm not that skilled, thoughError415 - Thursday, October 5, 2017 - link
Performane per dollar doesn't matter, out right performance matters. SMH, only a fool buys the second best cpu when the best is only a few dollars more.zuber - Thursday, October 5, 2017 - link
You basically just said "performance per dollar doesn't matter, only a fool ignores performance per dollar".sonny73n - Friday, October 6, 2017 - link
+1