The AMD Ryzen Threadripper 1950X and 1920X Review: CPUs on Steroids
by Ian Cutress on August 10, 2017 9:00 AM ESTRise of the Tomb Raider (1080p, 4K)
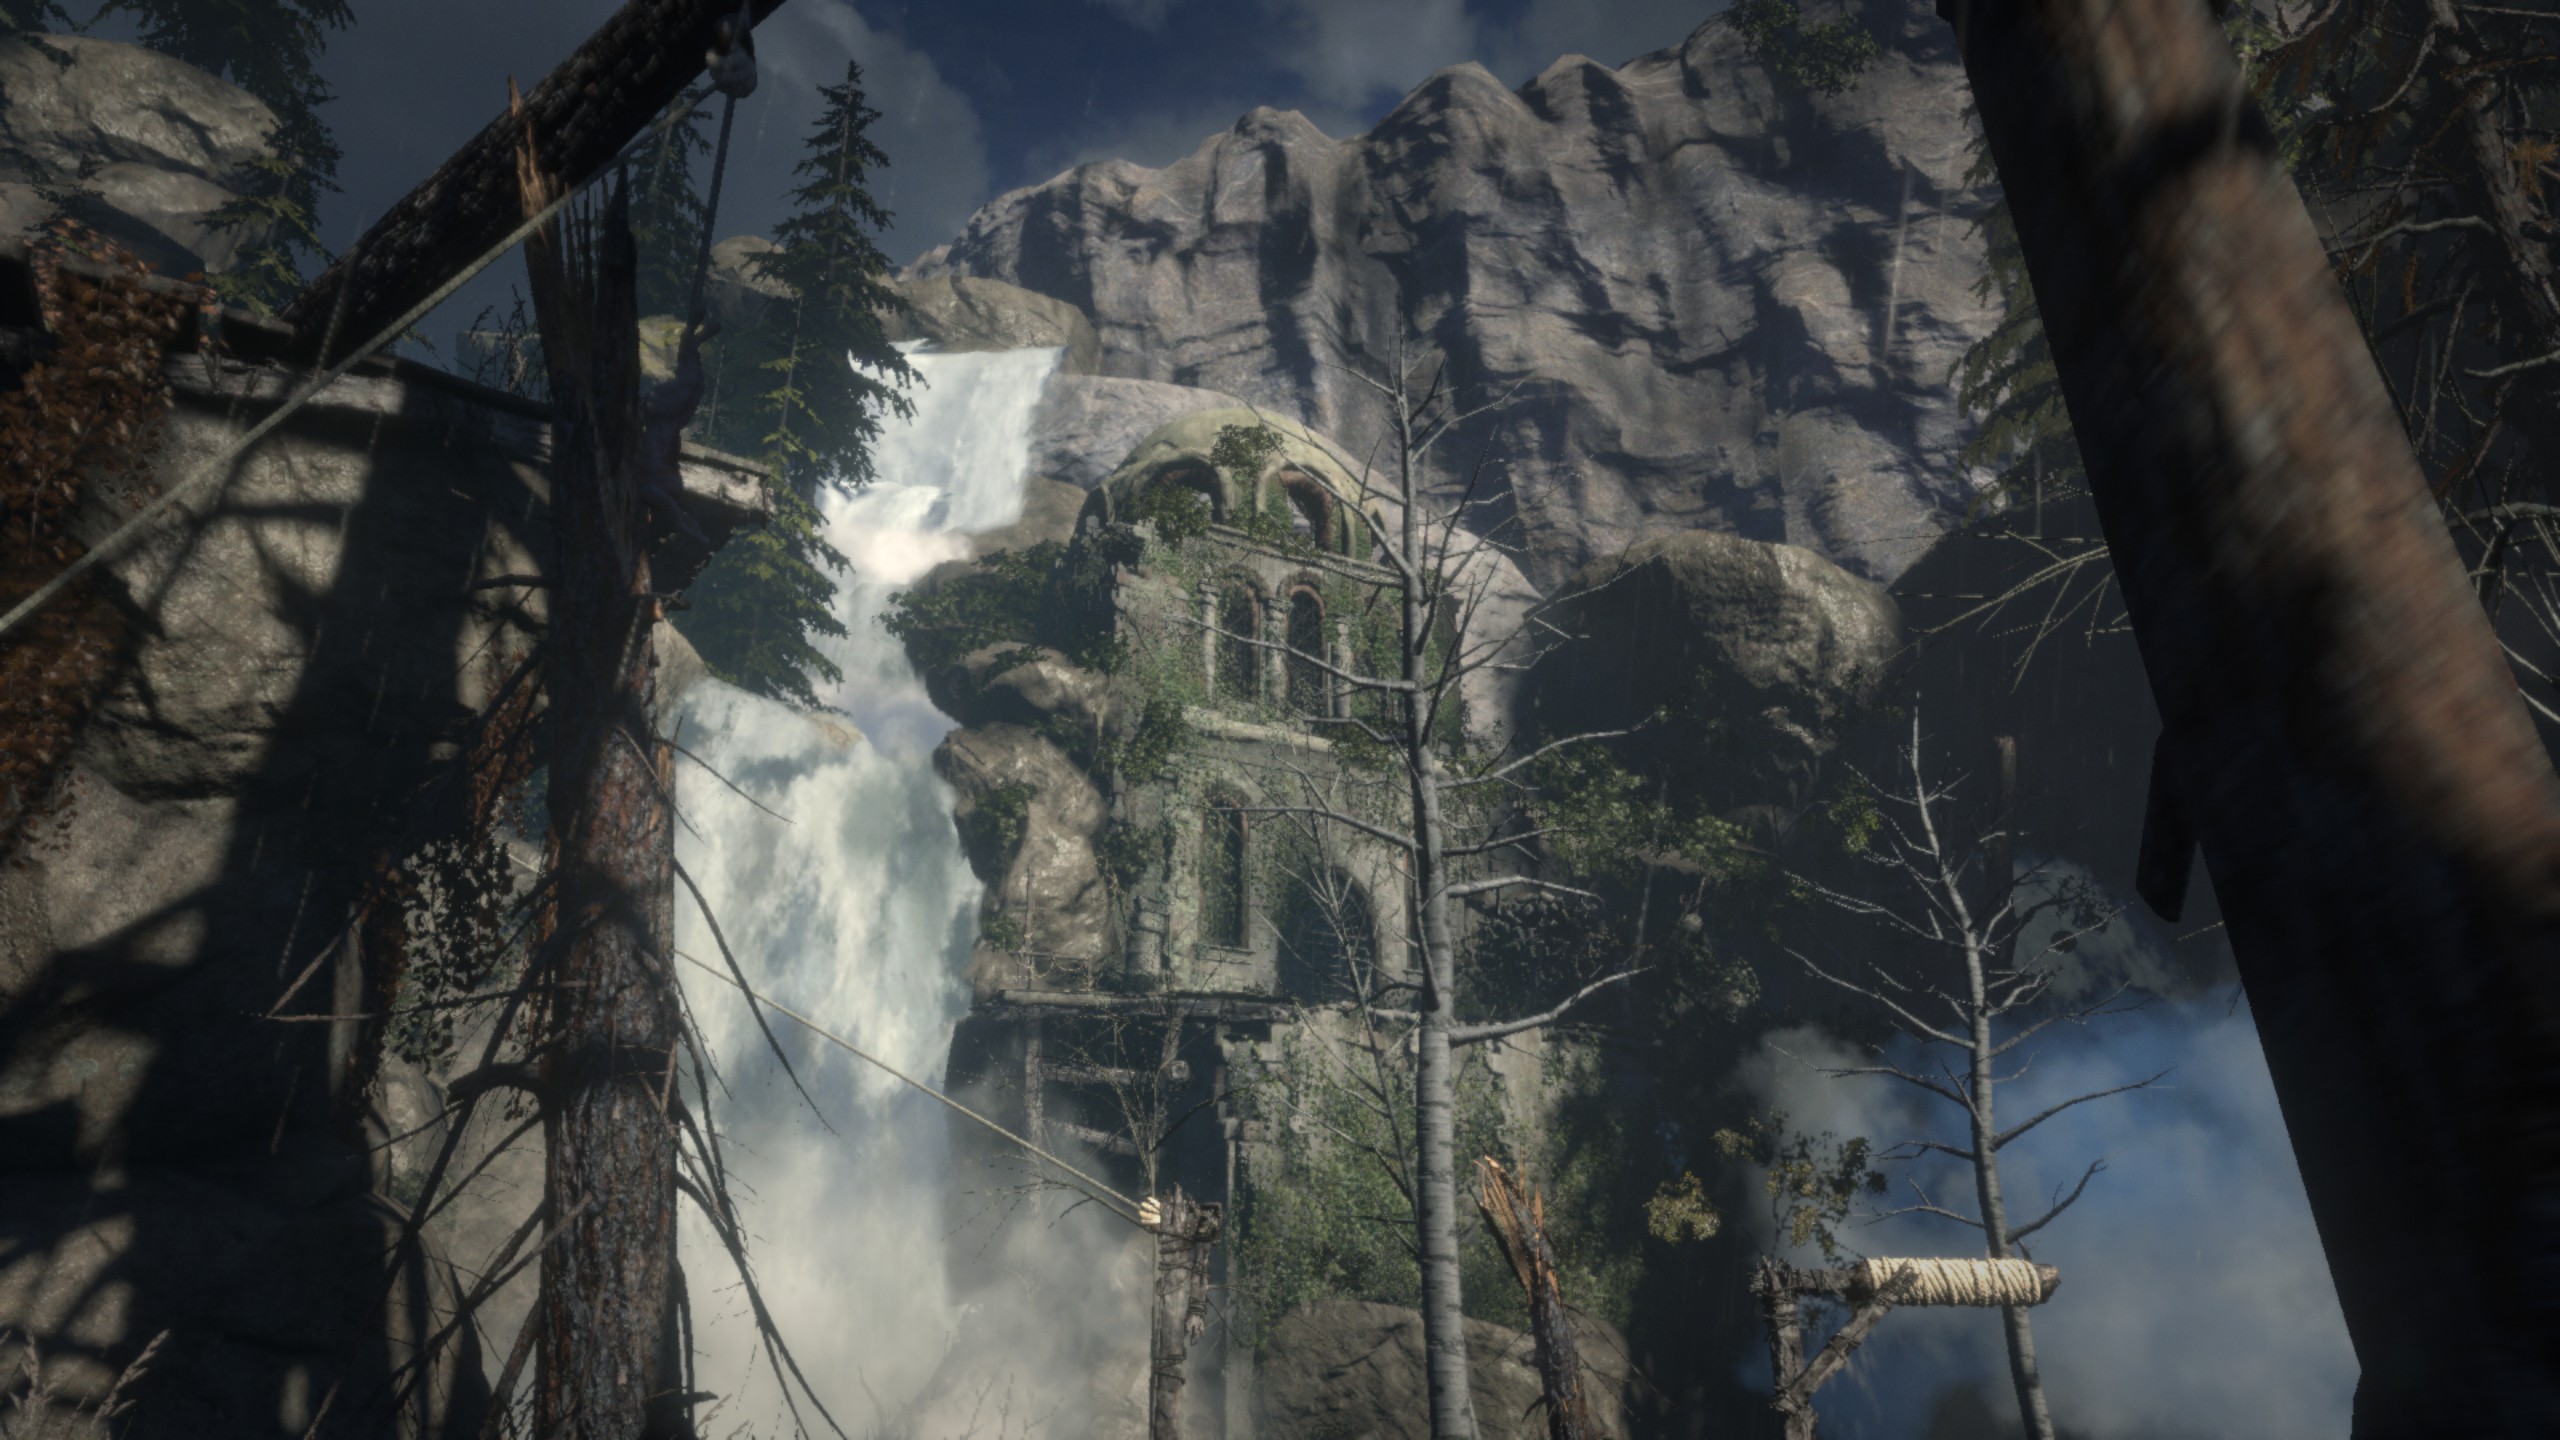
One of the newest games in the gaming benchmark suite is Rise of the Tomb Raider (RoTR), developed by Crystal Dynamics, and the sequel to the popular Tomb Raider which was loved for its automated benchmark mode. But don’t let that fool you: the benchmark mode in RoTR is very much different this time around.
Visually, the previous Tomb Raider pushed realism to the limits with features such as TressFX, and the new RoTR goes one stage further when it comes to graphics fidelity. This leads to an interesting set of requirements in hardware: some sections of the game are typically GPU limited, whereas others with a lot of long-range physics can be CPU limited, depending on how the driver can translate the DirectX 12 workload.
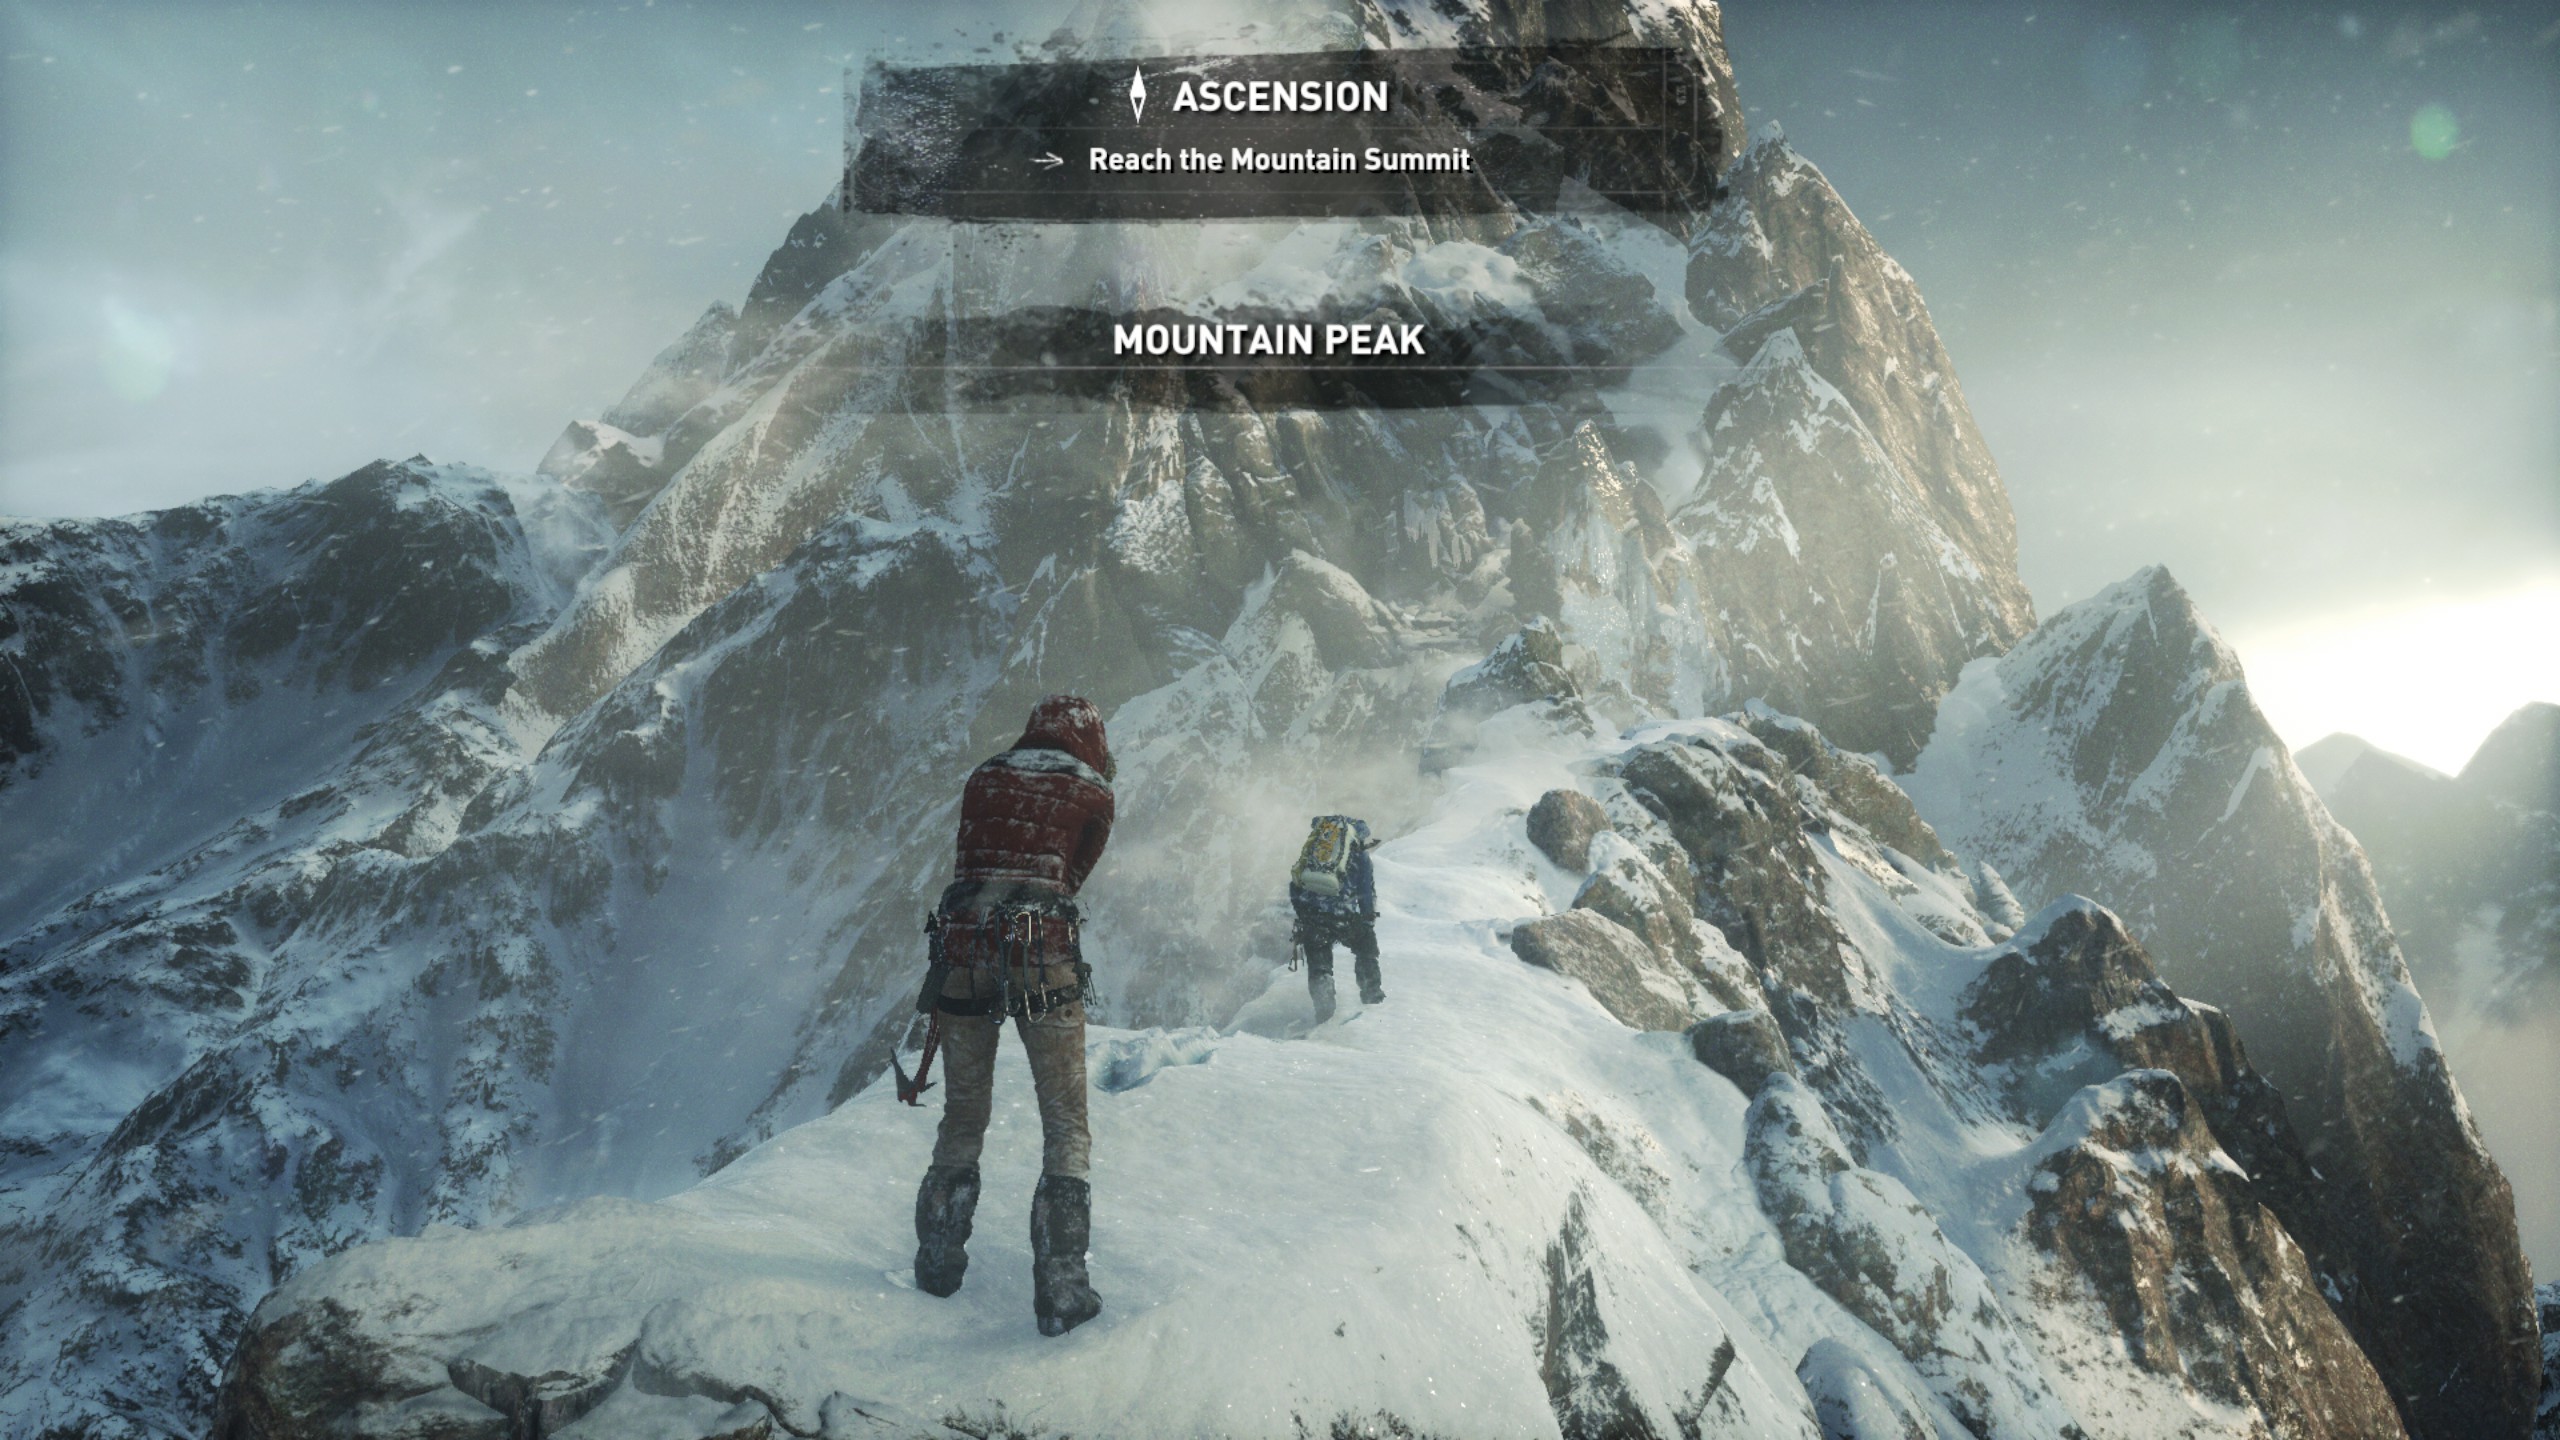
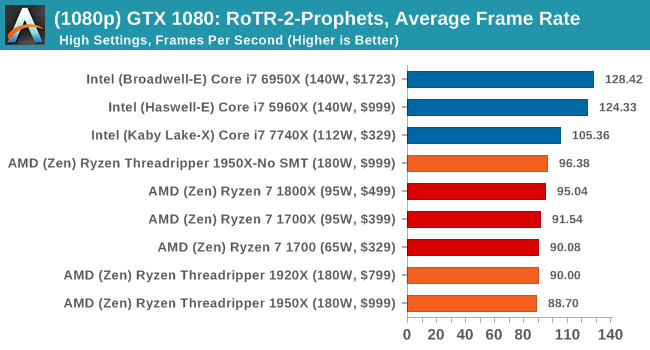
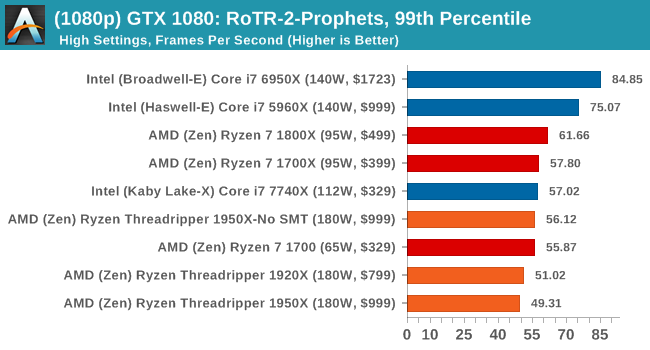
Where the old game had one benchmark scene, the new game has three different scenes with different requirements: Spine of the Mountain (1-Valley), Prophet’s Tomb (2-Prophet) and Geothermal Valley (3-Mountain) - and we test all three (and yes, I need to relabel them - I got them wrong when I set up the tests). These are three scenes designed to be taken from the game, but it has been noted that scenes like 2-Prophet shown in the benchmark can be the most CPU limited elements of that entire level, and the scene shown is only a small portion of that level. Because of this, we report the results for each scene on each graphics card separately.
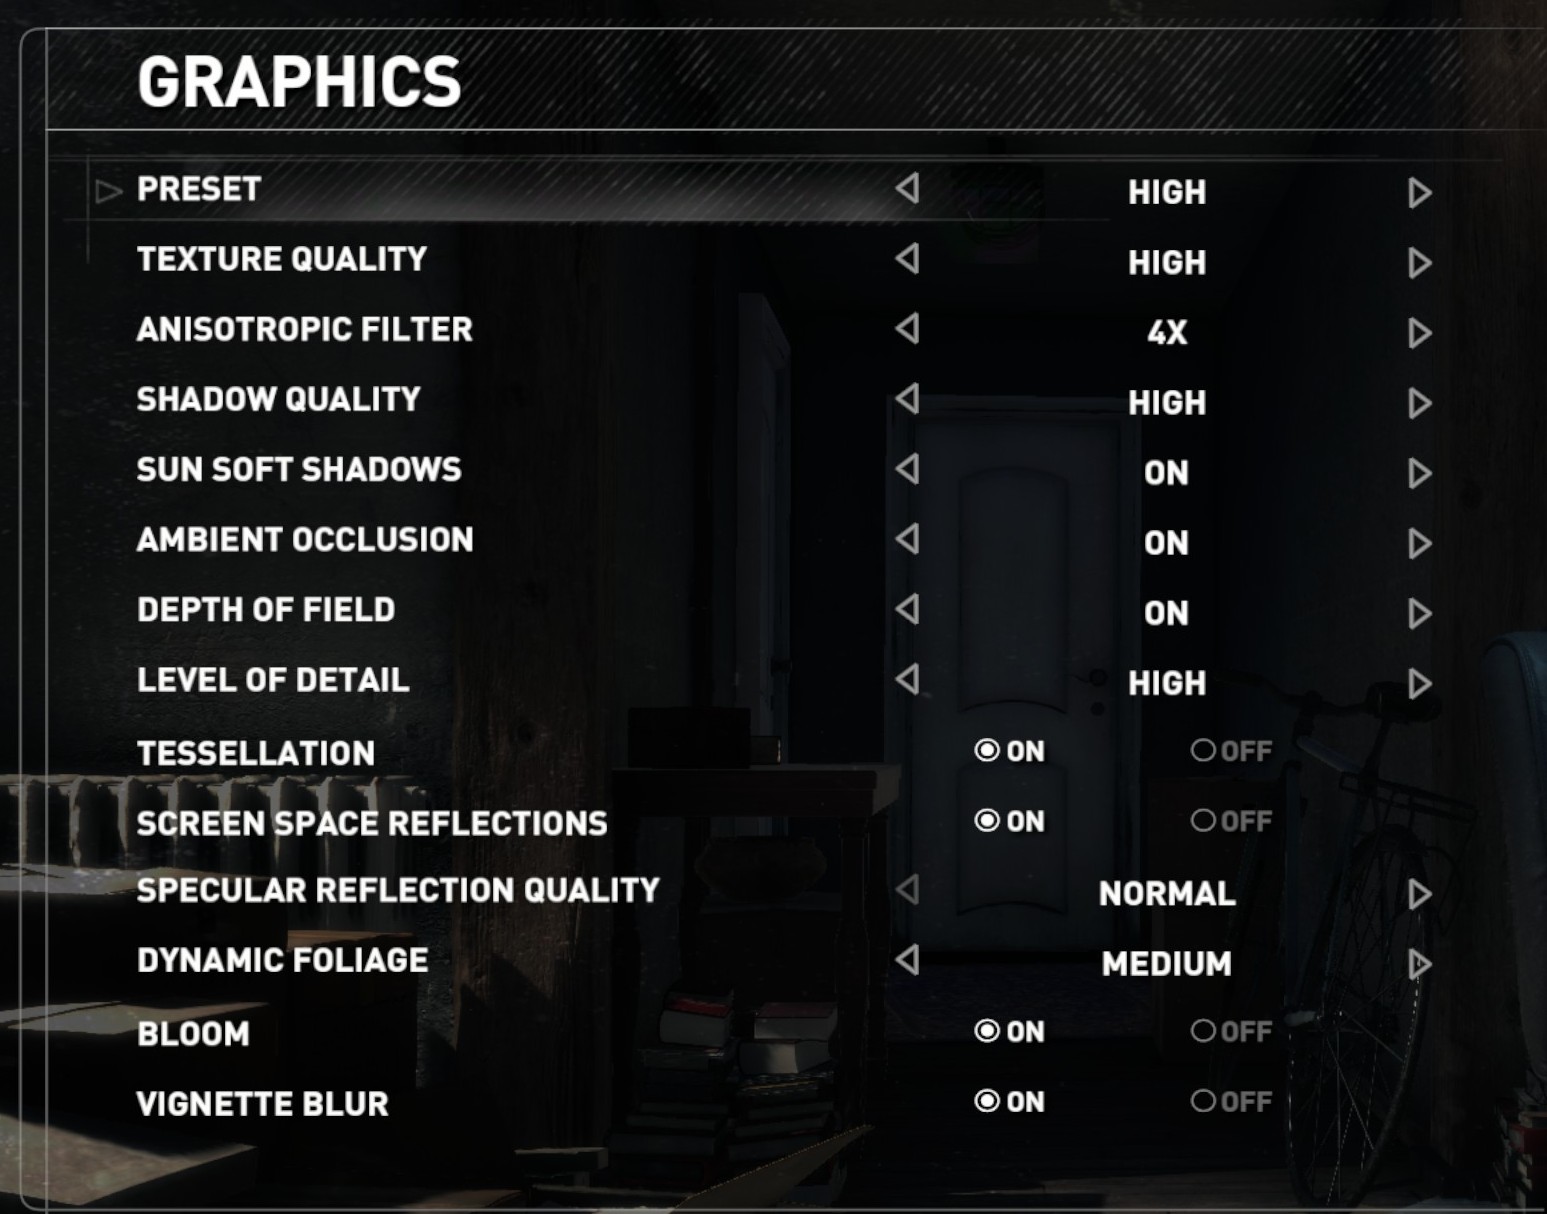
Graphics options for RoTR are similar to other games in this type, offering some presets or allowing the user to configure texture quality, anisotropic filter levels, shadow quality, soft shadows, occlusion, depth of field, tessellation, reflections, foliage, bloom, and features like PureHair which updates on TressFX in the previous game.
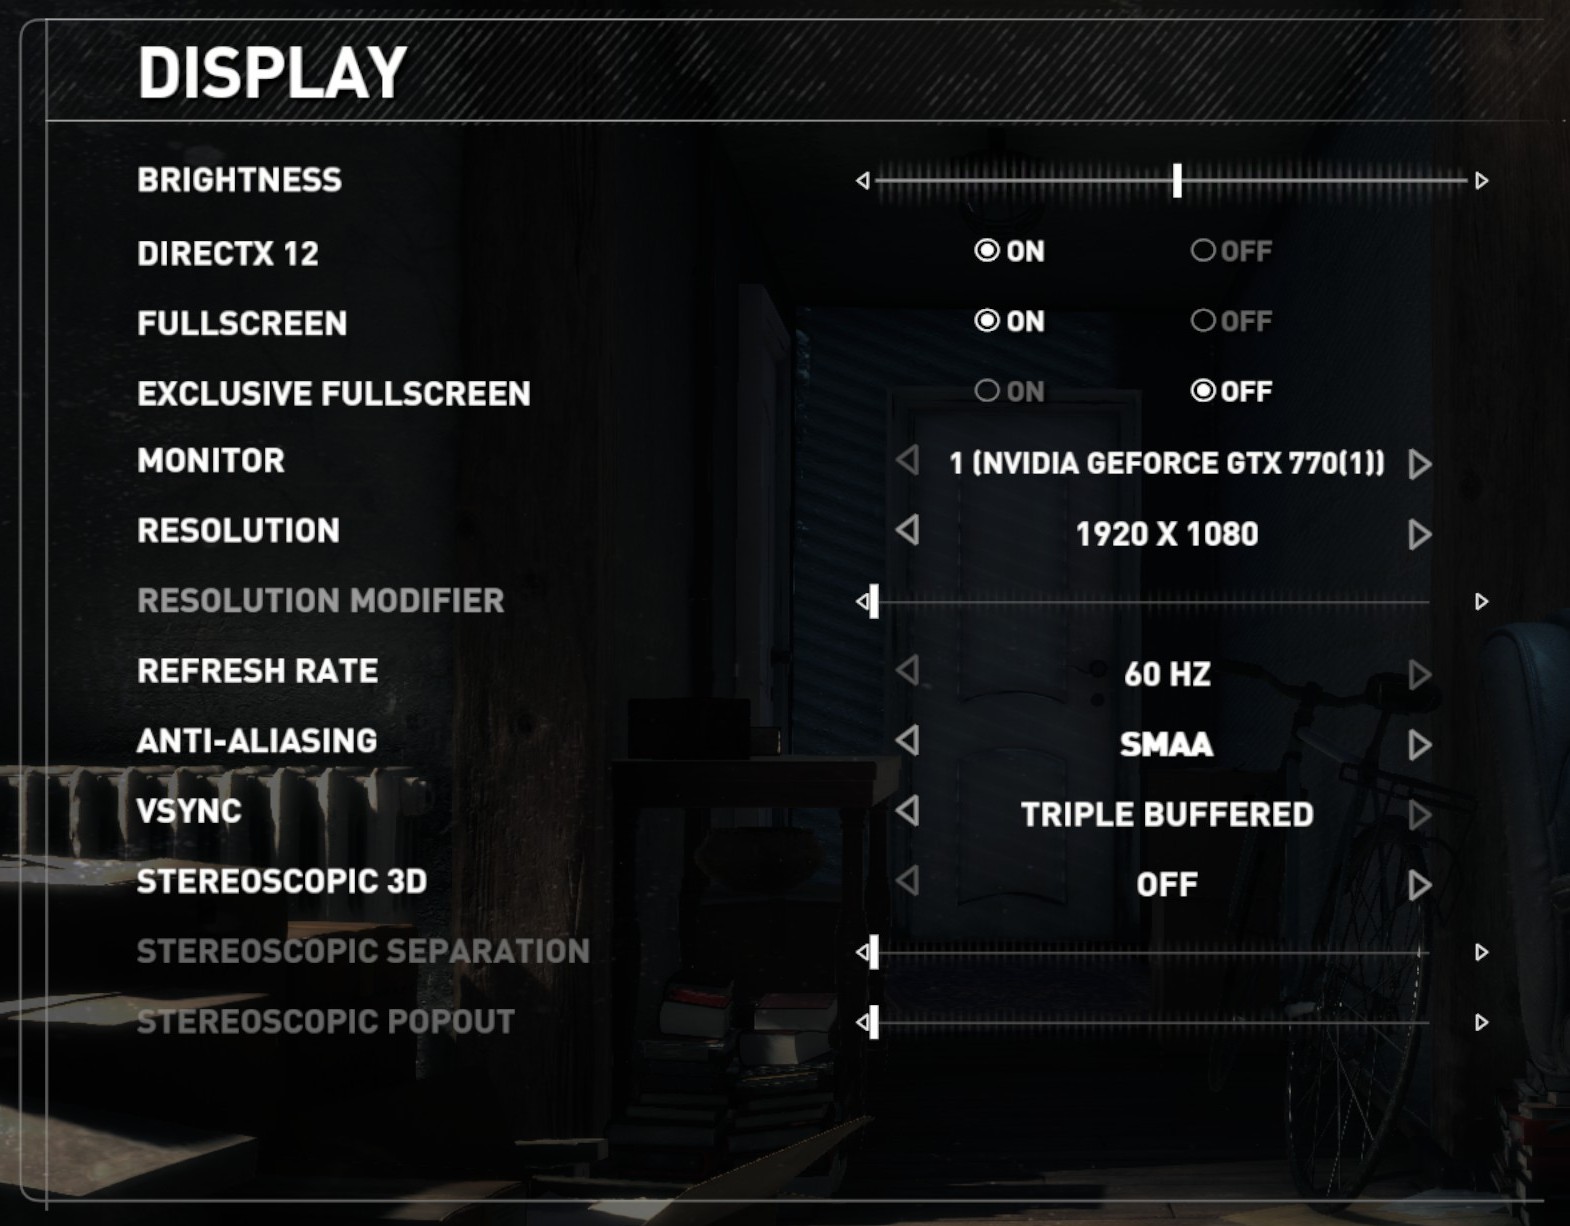
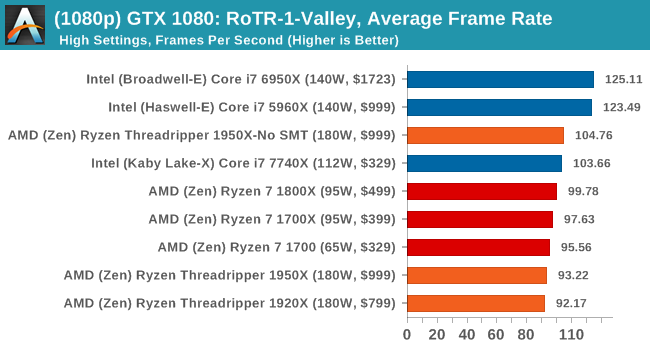
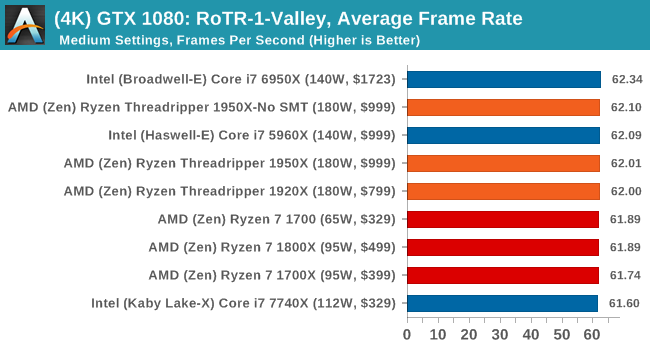
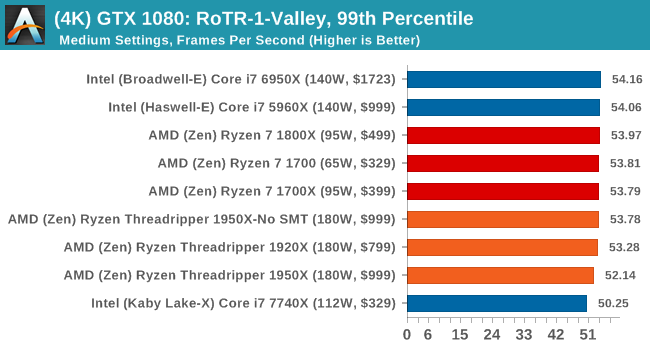
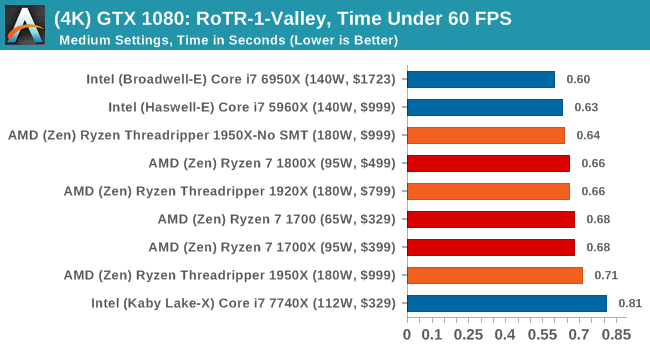
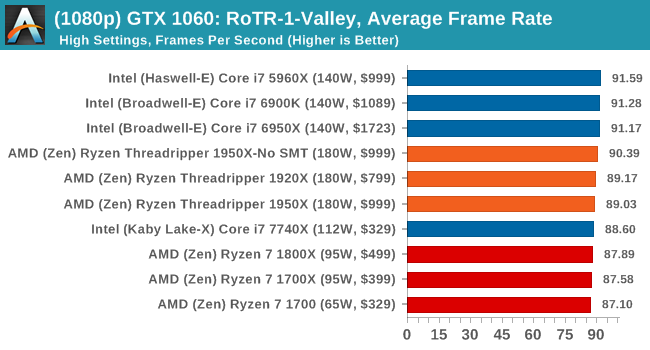
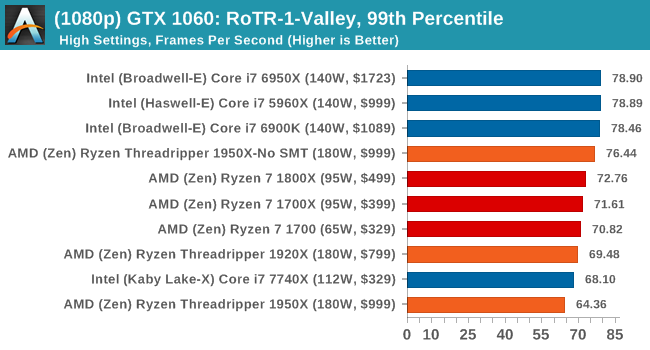
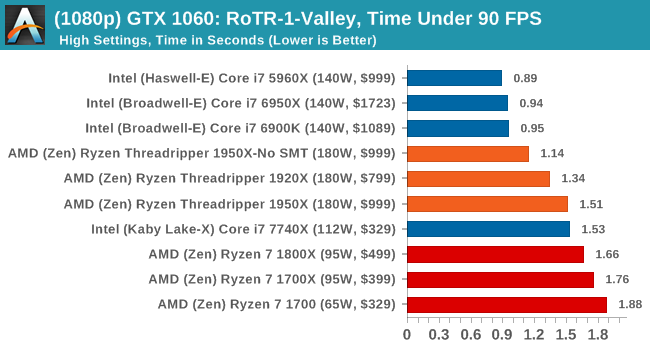
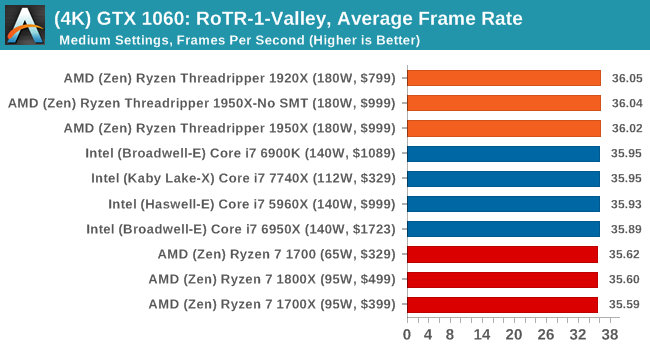
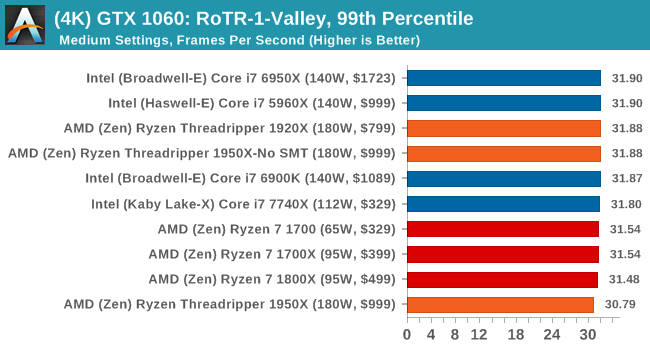
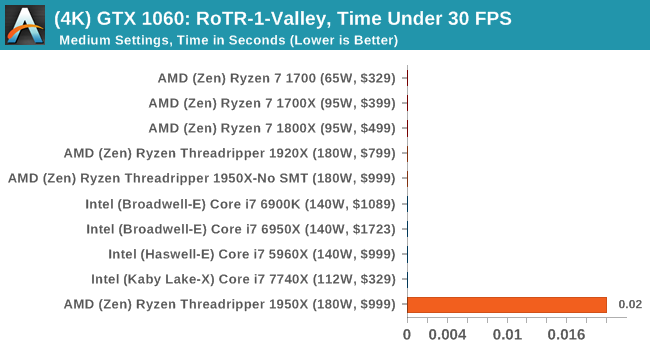
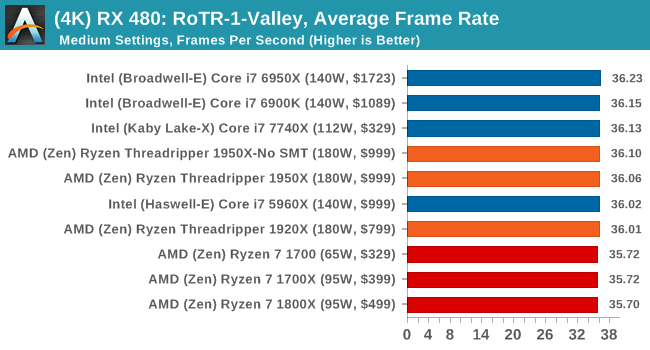
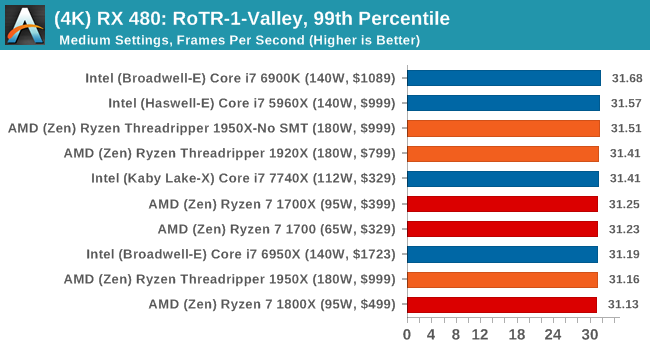
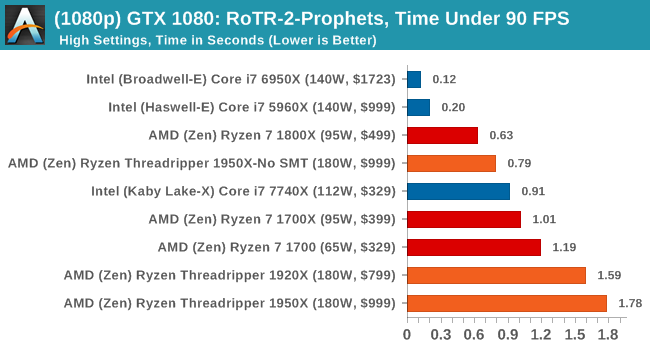
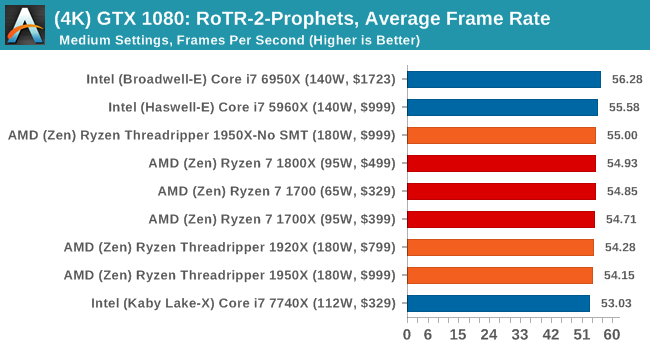
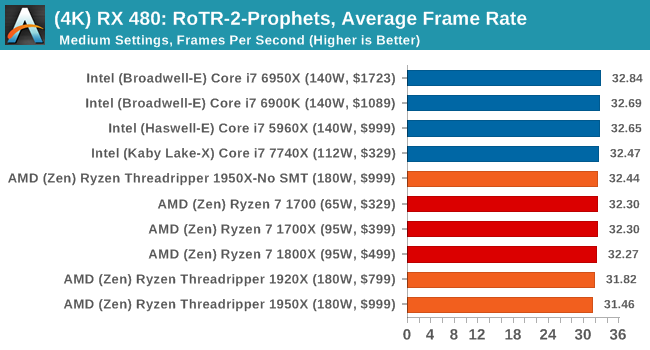
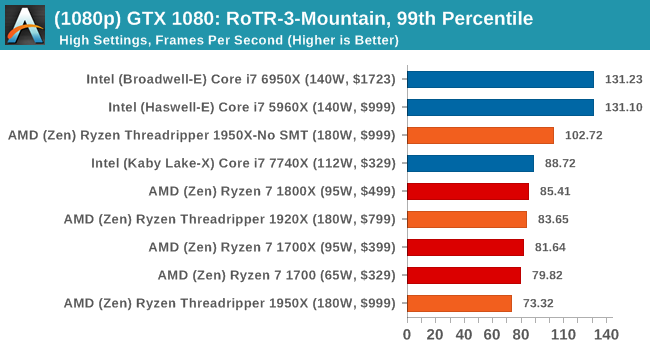
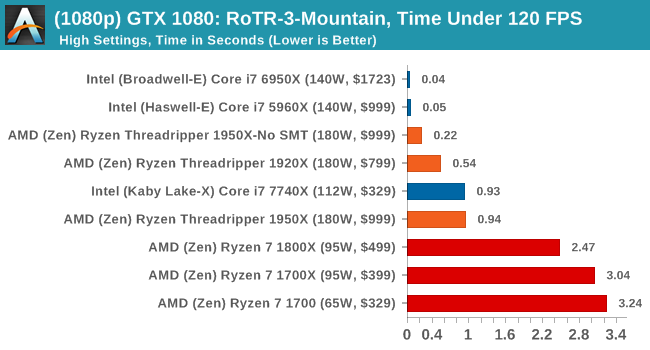
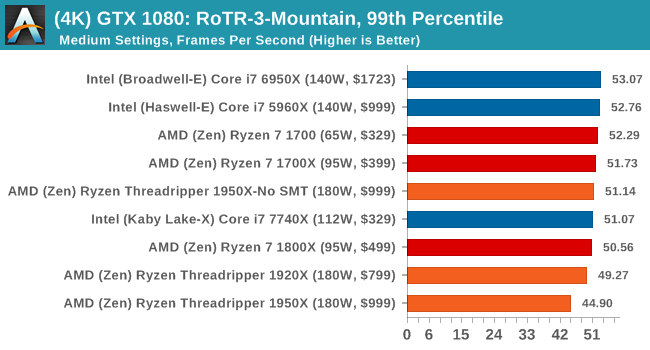
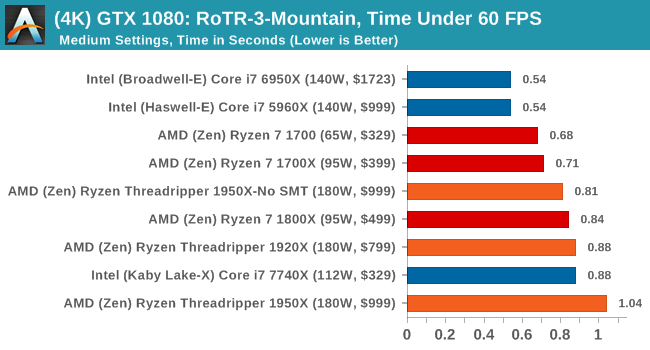
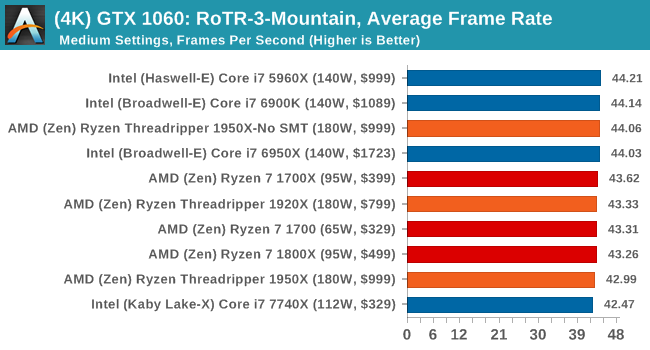
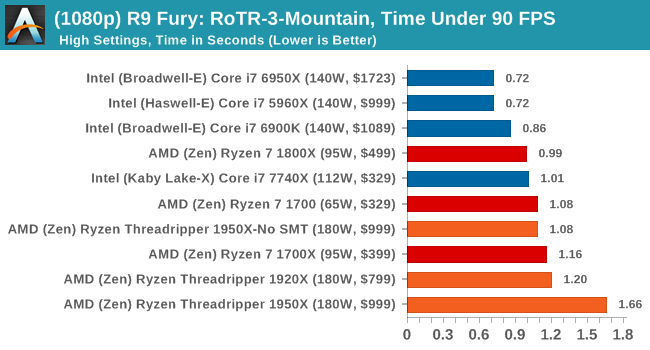
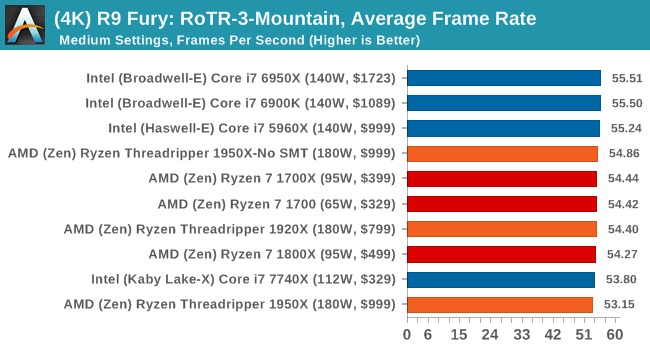
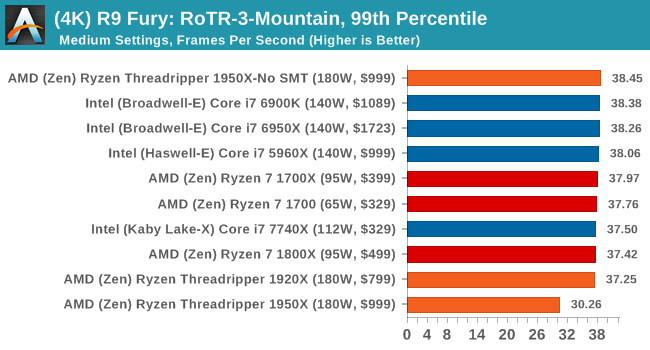
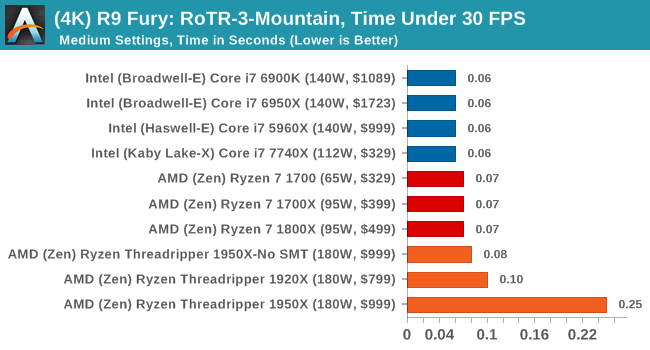
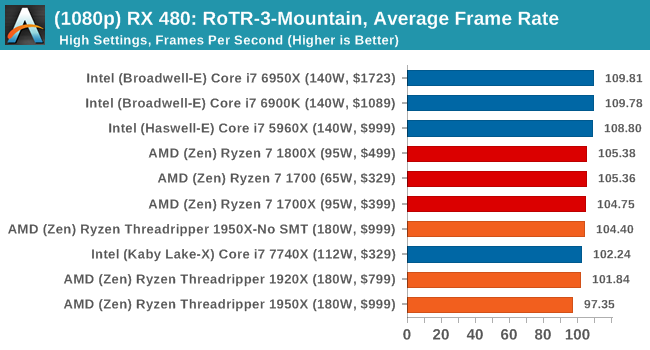
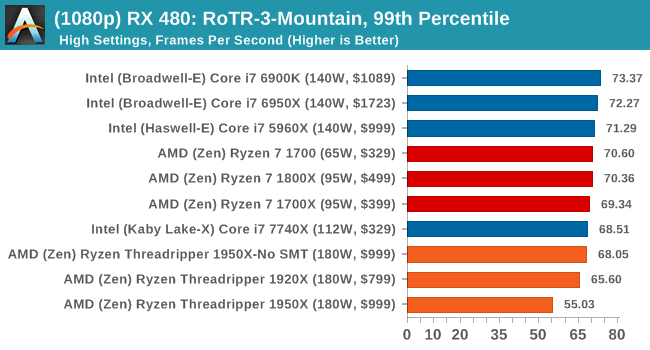
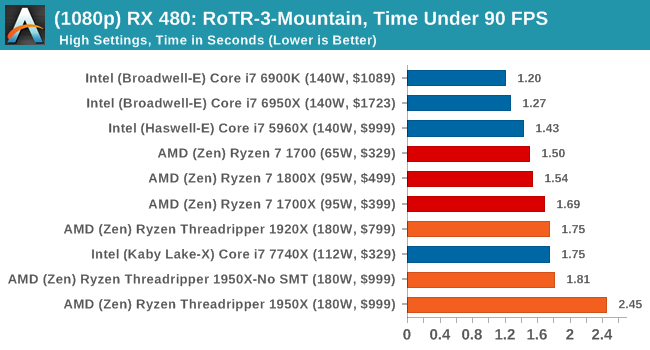
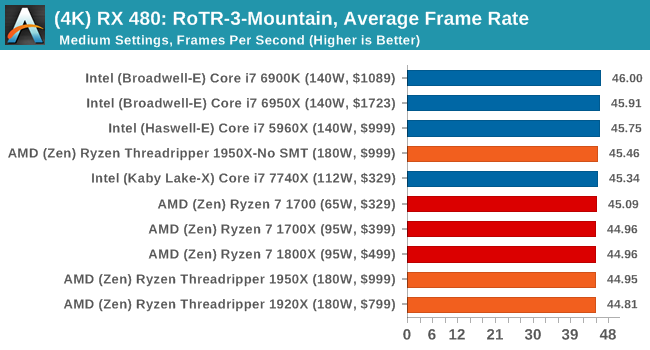
Again, we test at 1920x1080 and 4K using our native 4K displays. At 1080p we run the High preset, while at 4K we use the Medium preset which still takes a sizable hit in frame rate.
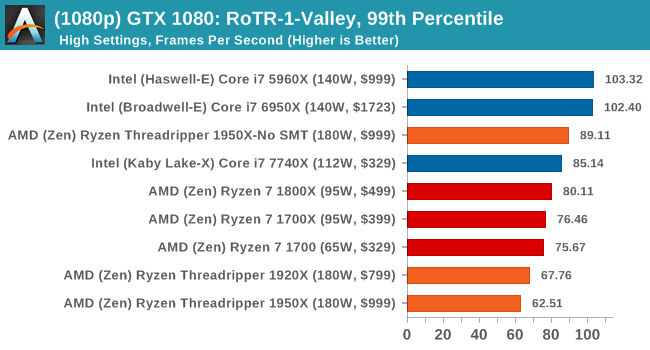
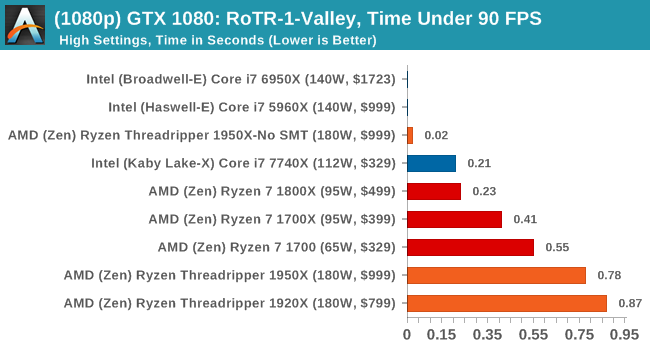
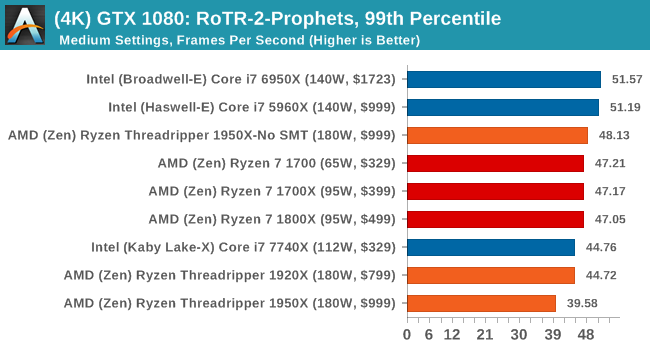
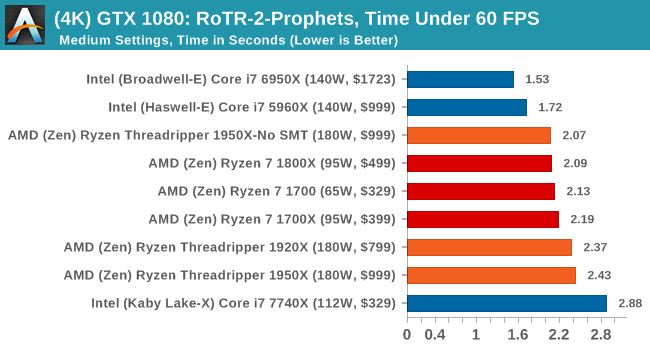
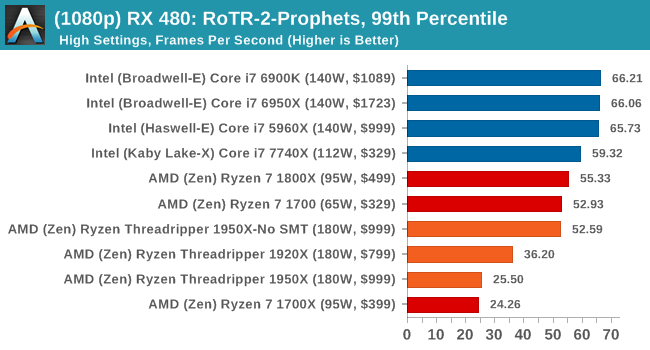
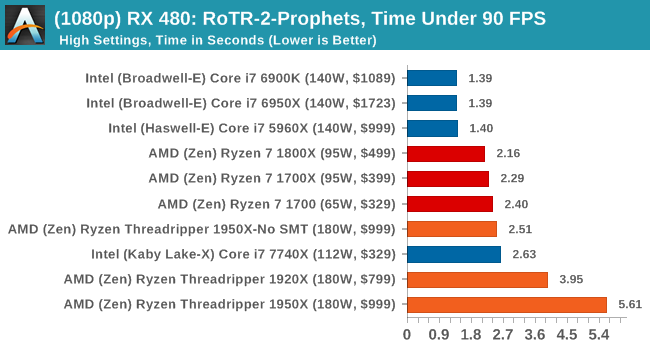
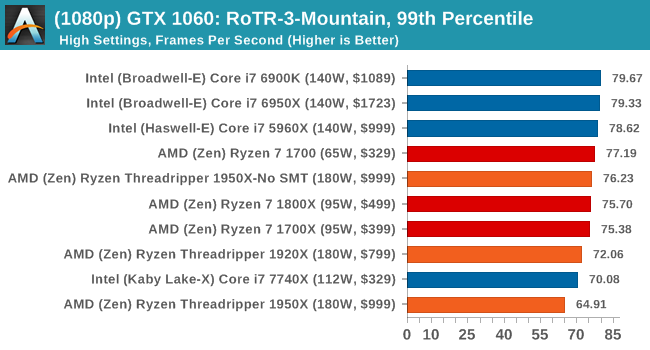
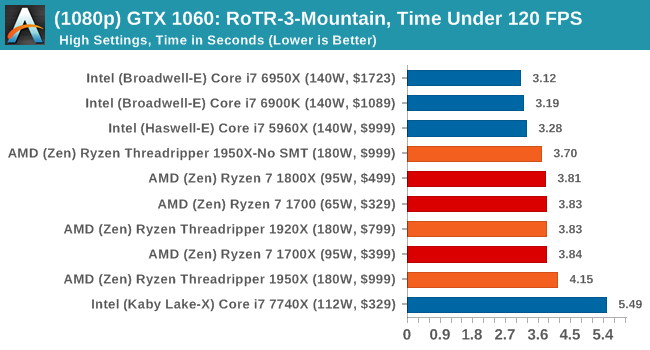
It is worth noting that RoTR is a little different to our other benchmarks in that it keeps its graphics settings in the registry rather than a standard ini file, and unlike the previous TR game the benchmark cannot be called from the command-line. Nonetheless we scripted around these issues to automate the benchmark four times and parse the results. From the frame time data, we report the averages, 99th percentiles, and our time under analysis.
All of our benchmark results can also be found in our benchmark engine, Bench.
#1 Geothermal Valley Spine of the Mountain
MSI GTX 1080 Gaming 8G Performance
1080p
4K
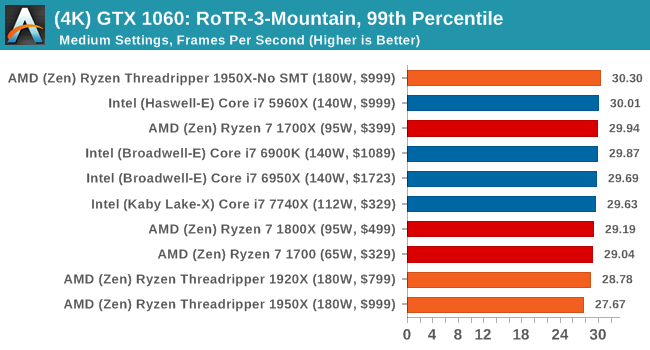
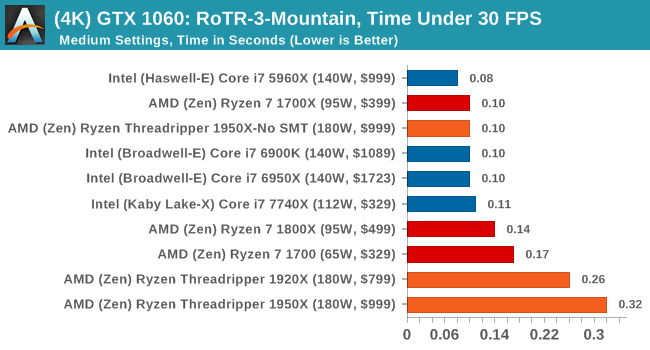
ASUS GTX 1060 Strix 6G Performance
1080p
4K
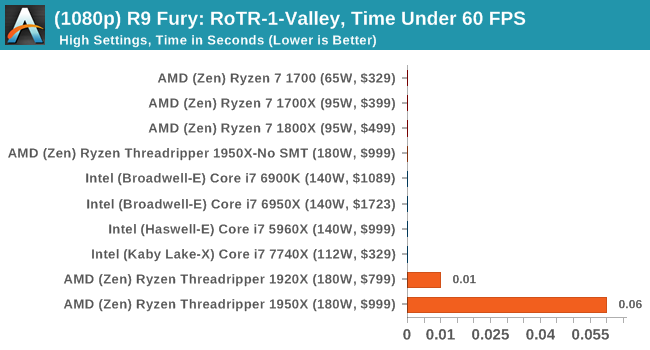
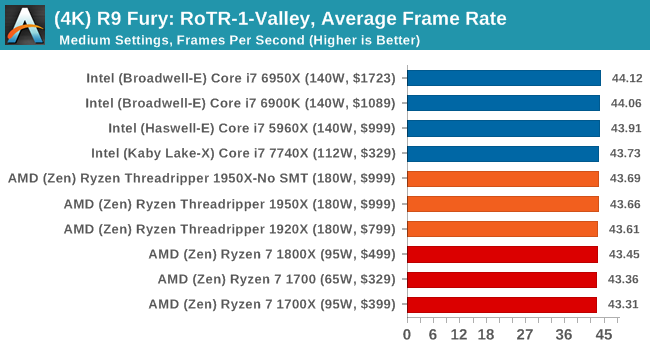
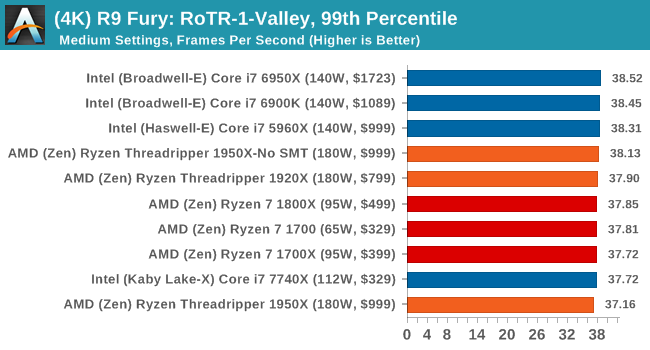
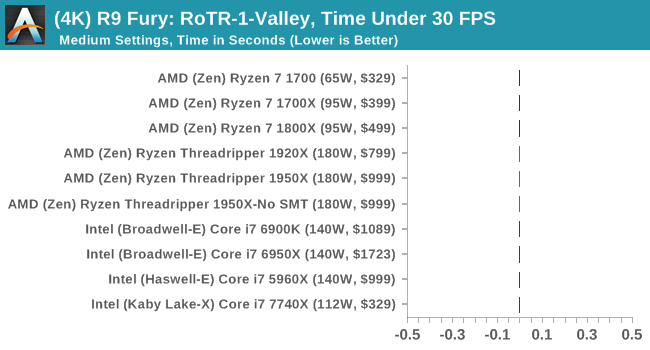
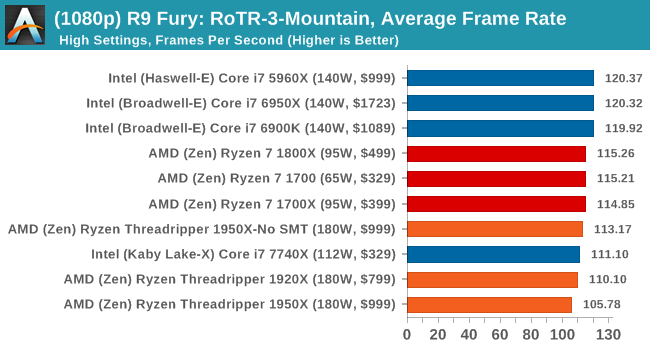
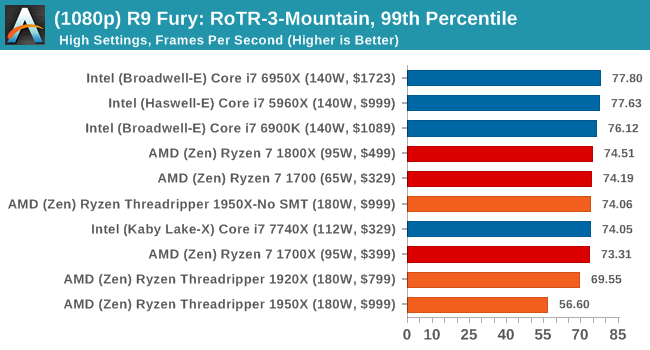
Sapphire Nitro R9 Fury 4G Performance
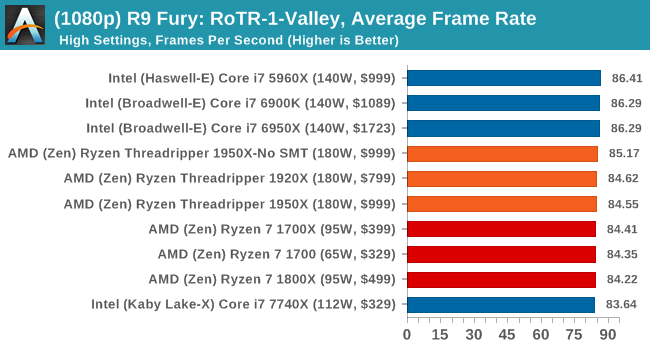
1080p

4K
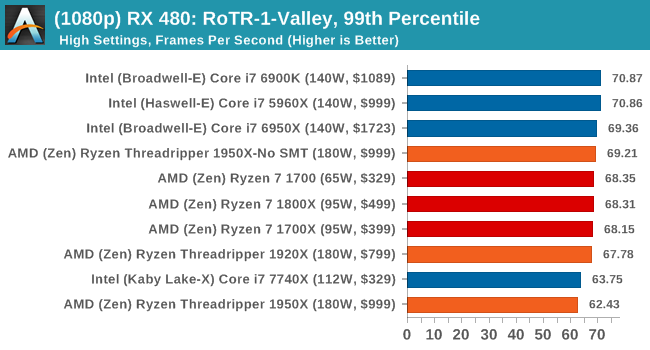
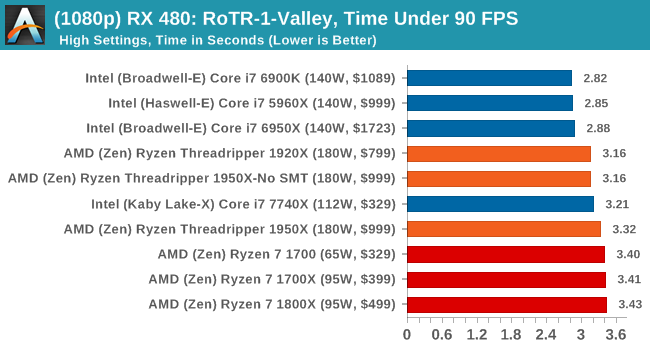
Sapphire Nitro RX 480 8G Performance
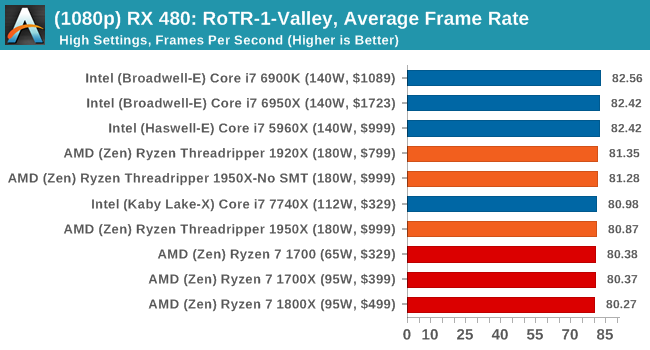
1080p
4K

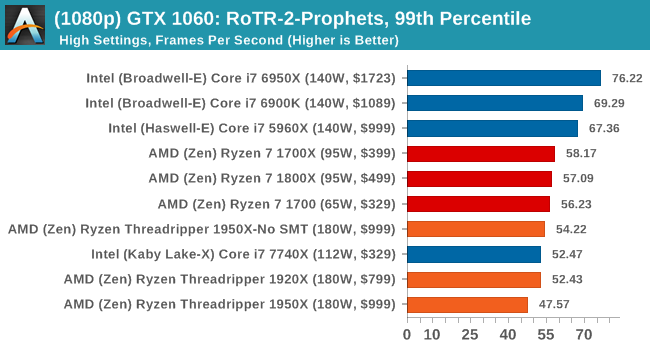
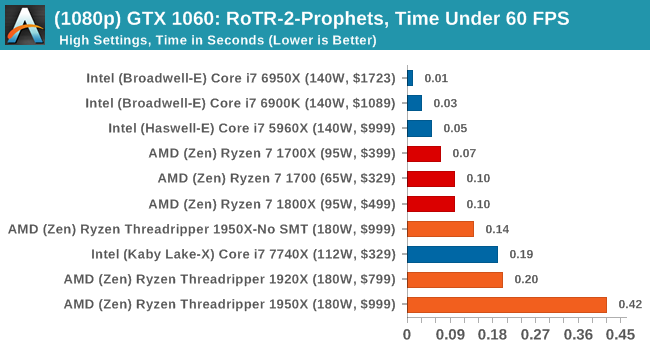
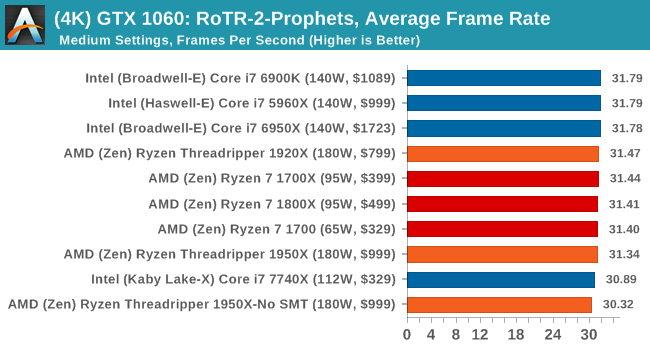
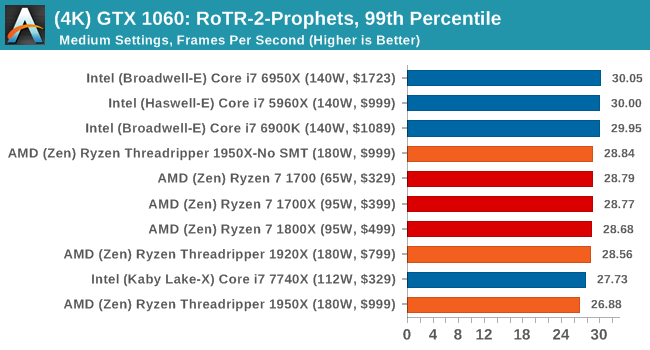
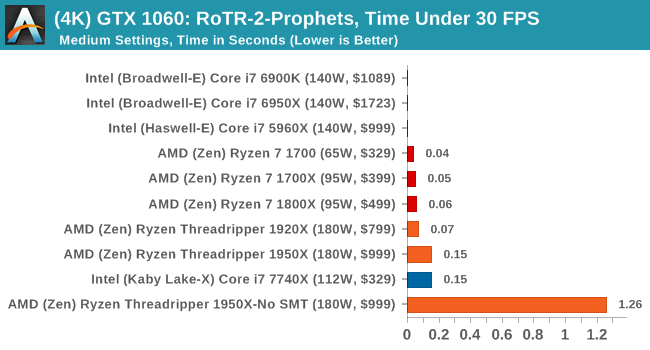
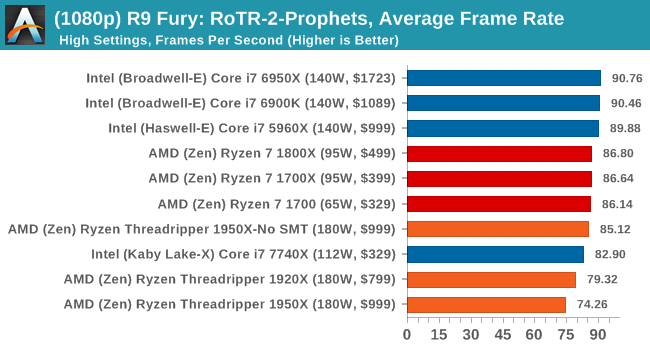
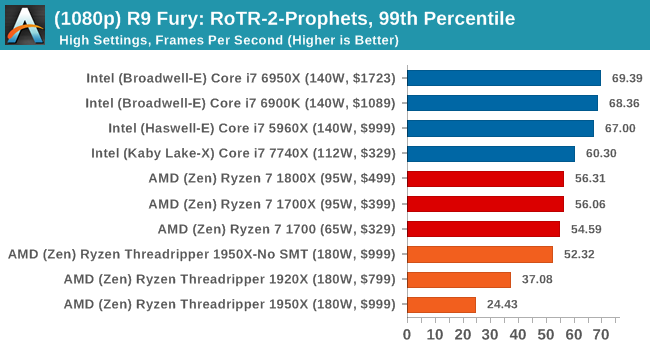
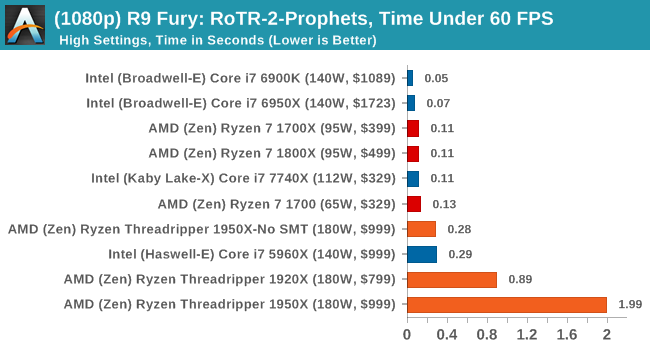
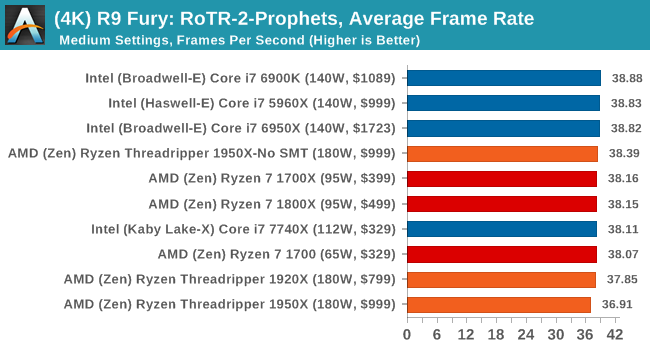
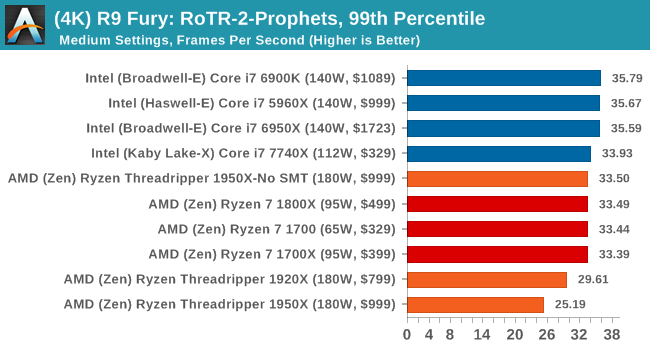
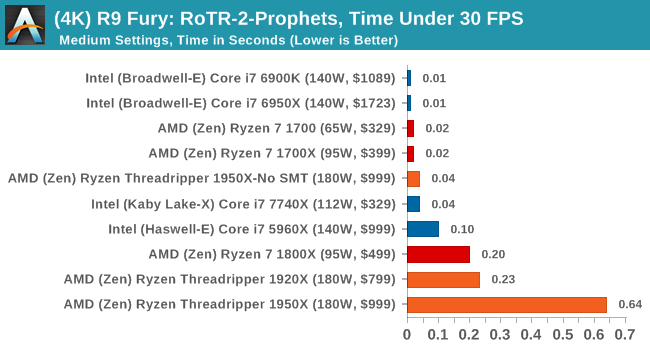
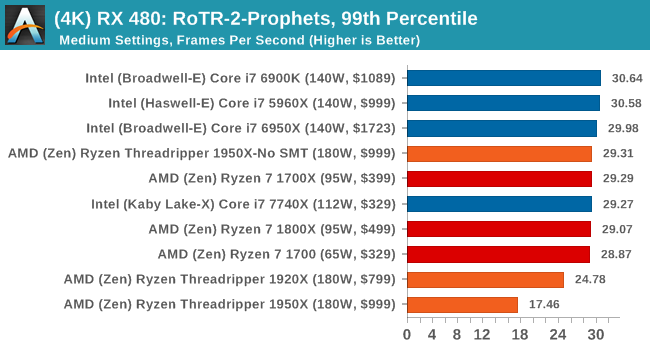
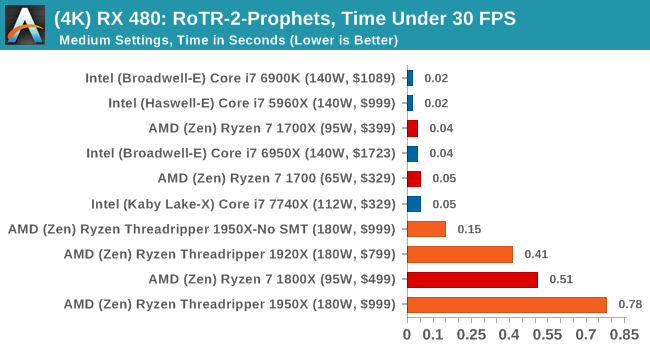
#2 Prophet’s Tomb

MSI GTX 1080 Gaming 8G Performance
1080p
4K
ASUS GTX 1060 Strix 6G Performance
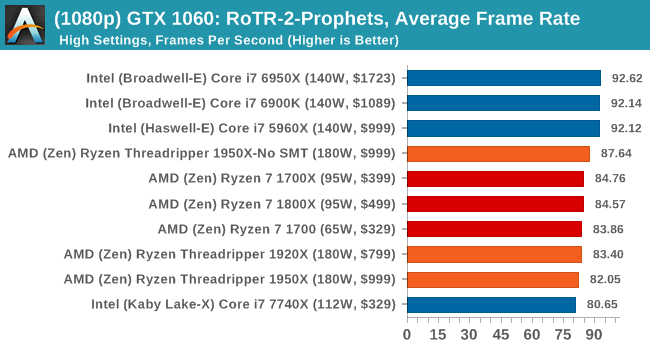
1080p
4K
Sapphire Nitro R9 Fury 4G Performance
1080p
4K
Sapphire Nitro RX 480 8G Performance
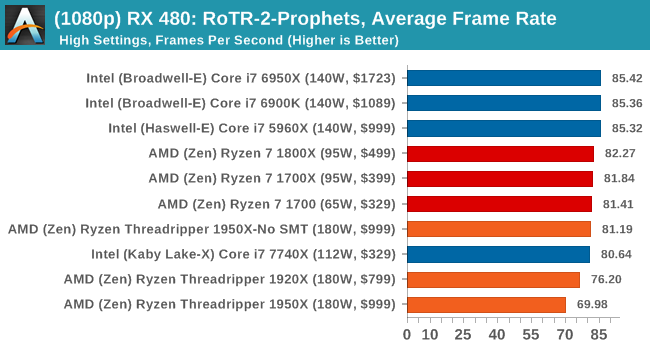
1080p
4K
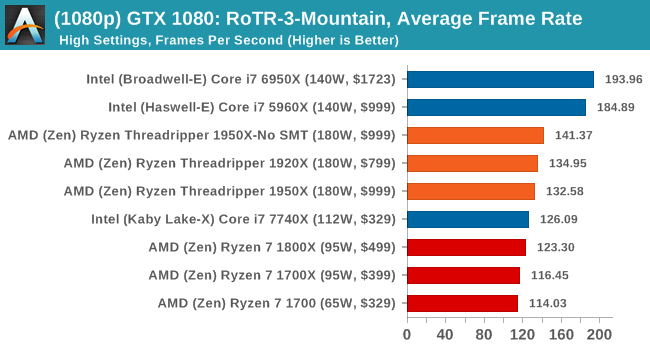
#3 Spine of the Mountain Geothermal Valley
MSI GTX 1080 Gaming 8G Performance
1080p
4K

ASUS GTX 1060 Strix 6G Performance
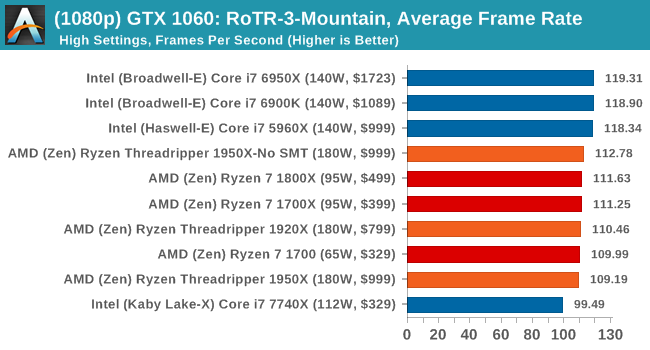
1080p
4K
Sapphire Nitro R9 Fury 4G Performance
1080p
4K
Sapphire Nitro RX 480 8G Performance
1080p
The 4K
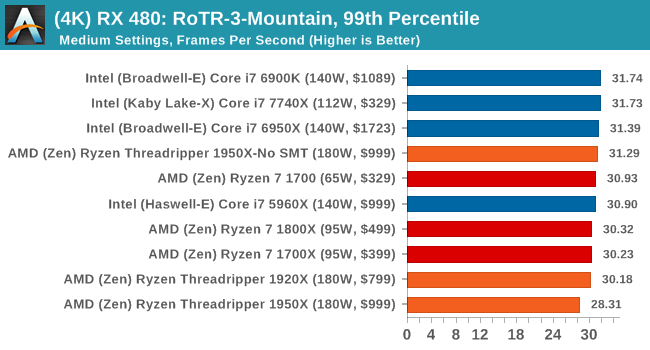
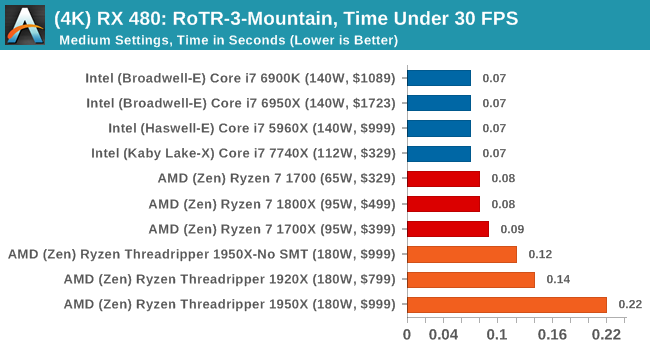
It's clear from these results that the 1950X is not the best gaming chip when in its default mode.


347 Comments
View All Comments
lefty2 - Thursday, August 10, 2017 - link
except that they haven'tDr. Swag - Thursday, August 10, 2017 - link
How so? You have the performance numbers, and they gave you power draw numbers...bongey - Thursday, August 10, 2017 - link
Just do a avx512 benchmark and Intel will jump over 300watts , 400watts(overclocked) only from the cpu. (prime95 avx512 benchmark).See der8auer's video "The X299 VRM Disaster (en)"DanNeely - Thursday, August 10, 2017 - link
The Chromium build time results are interesting. Anandtech's results have the 1950X only getting 3/4ths of the 7900X's performance. Arstechnica's getting almost equal results on both CPUs, but at 16 compiles per day vs 24 or 32 is seeing significantly worse numbers all around.I'm wondering what's different between the two compile benchmarks to see such a large spread.
cknobman - Thursday, August 10, 2017 - link
I think it has a lot to do with the RAM used by Anandtech vs Arstechnica .For all the regular benchmarking Anand used DDR4 2400, only the DDR 3200 was used in some overcloking.
Arstechnica used DDR4 3200 for all benchmarking.
Everyone already knows how faster DDR4 memory helps the Zen architecture.
DanNeely - Thursday, August 10, 2017 - link
If ram was the determining factor, Ars should be seeing faster build times though not slower ones.carewolf - Thursday, August 10, 2017 - link
Anandtech must have misconfigured something. Building chromium is scales practically linearly. You can move jobs all the way across a slow network and compile on another machine and you still get linear speed-ups with more added cores.Ian Cutress - Thursday, August 10, 2017 - link
We're using a late March v56 code base with MSVC.Ars is using a newer v62 code base with clang-cl and VC++ linking
We locked in our versions when we started testing Windows 10 a few months ago.
supdawgwtfd - Friday, August 11, 2017 - link
Maybe drop it then as it is not at all usefull info.Johan Steyn - Thursday, August 10, 2017 - link
I refrained from posting on the previous article, but now I'm quite sure Anand is being paid by Intel. It is not that I argue against the benchmarks, but how it is presented. I was even under the impression that this was an Intel review.The previous article was stated as "Introducing Intel's Desktop Processor" Huge marketing research is done on how to market products. By just stating one thing first or in a different way, quite different messages can be conveyed without lying outright.
By making the "Most Powerful, Most Scalable" Bold, that is what the readers read first, then they read "Desktop Processor" without even reading that is is Intel's. This is how marketing works, so Anand used slanted journalism to favour Intel, yet most people will just not realise it eat it up.
In this review there are so many slanted journalism problems, it is just sad. If you want, just compare it to other sites reviews. They just omit certain tests and list others at which Intel excel.
I have lost my respect for Anandtech with these last two articles of them, and I have followed Anandtech since its inception. Sad to see that you are also now bought by Intel, even though I suspected this before. Congratulations for making this so clear!!!