The AMD Ryzen Threadripper 1950X and 1920X Review: CPUs on Steroids
by Ian Cutress on August 10, 2017 9:00 AM ESTAshes of the Singularity Escalation
Seen as the holy child of DirectX12, Ashes of the Singularity (AoTS, or just Ashes) has been the first title to actively go explore as many of DirectX12s features as it possibly can. Stardock, the developer behind the Nitrous engine which powers the game, has ensured that the real-time strategy title takes advantage of multiple cores and multiple graphics cards, in as many configurations as possible.

As a real-time strategy title, Ashes is all about responsiveness during both wide open shots but also concentrated battles. With DirectX12 at the helm, the ability to implement more draw calls per second allows the engine to work with substantial unit depth and effects that other RTS titles had to rely on combined draw calls to achieve, making some combined unit structures ultimately very rigid.
Stardock clearly understand the importance of an in-game benchmark, ensuring that such a tool was available and capable from day one, especially with all the additional DX12 features used and being able to characterize how they affected the title for the developer was important. The in-game benchmark performs a four minute fixed seed battle environment with a variety of shots, and outputs a vast amount of data to analyze.
For our benchmark, we run a fixed v2.11 version of the game due to some peculiarities of the splash screen added after the merger with the standalone Escalation expansion, and have an automated tool to call the benchmark on the command line. (Prior to v2.11, the benchmark also supported 8K/16K testing, however v2.11 has odd behavior which nukes this.)
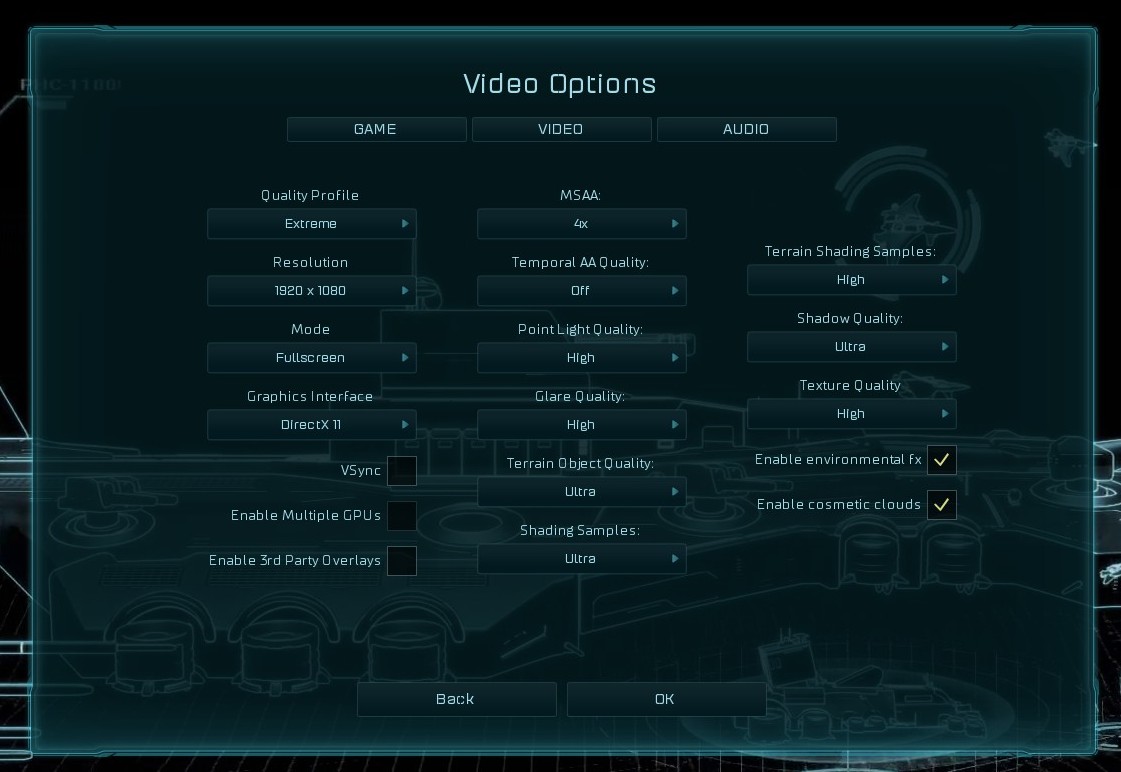
At both 1920x1080 and 4K resolutions, we run the same settings. Ashes has dropdown options for MSAA, Light Quality, Object Quality, Shading Samples, Shadow Quality, Textures, and separate options for the terrain. There are several presents, from Very Low to Extreme: we run our benchmarks at Extreme settings, and take the frame-time output for our average, percentile, and time under analysis.
All of our benchmark results can also be found in our benchmark engine, Bench.
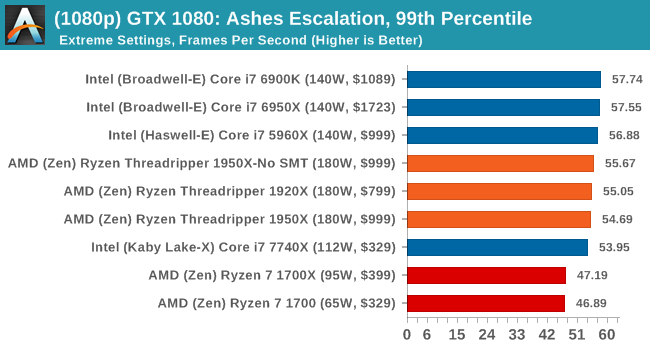
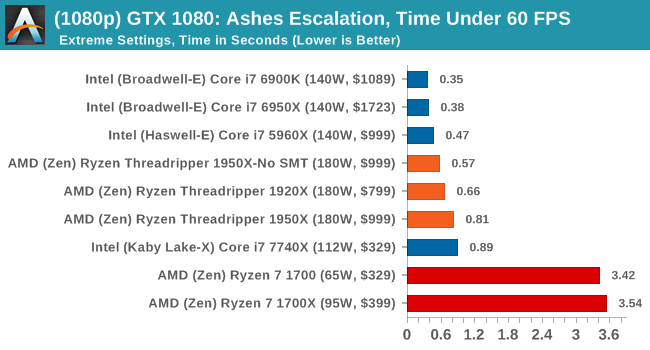
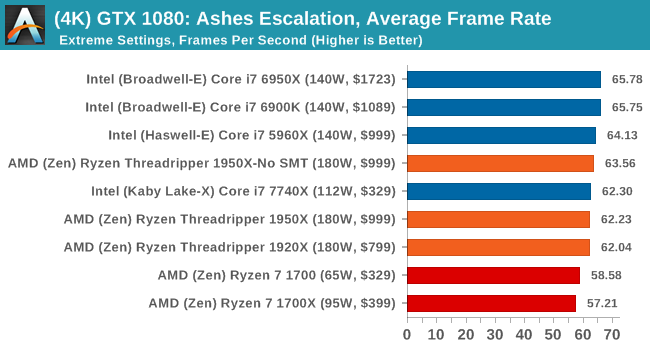
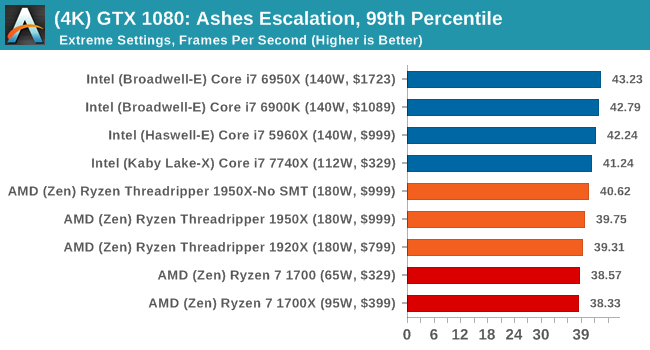
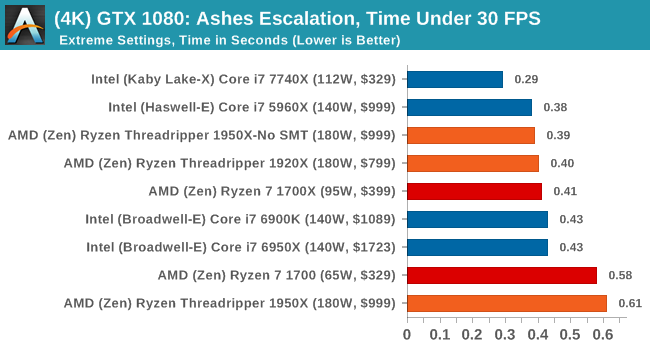
MSI GTX 1080 Gaming 8G Performance
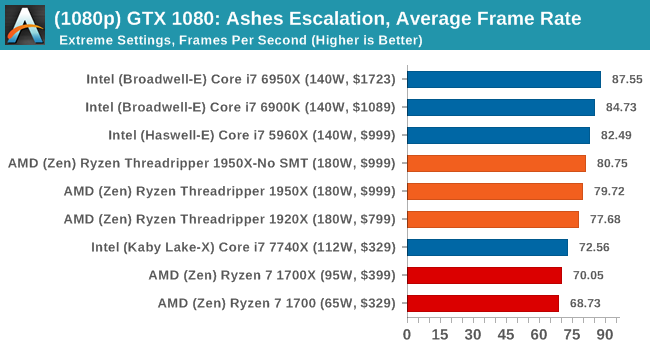
1080p
4K
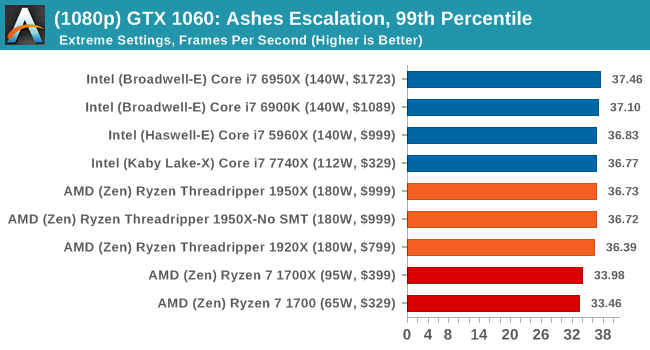
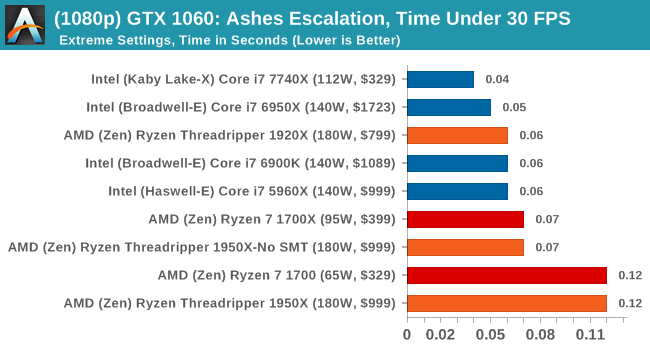
ASUS GTX 1060 Strix 6G Performance

1080p
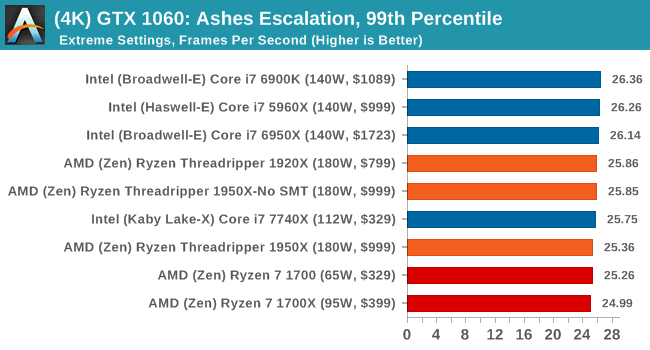
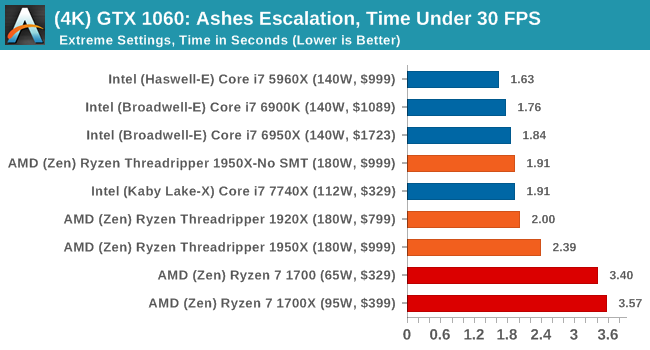
4K

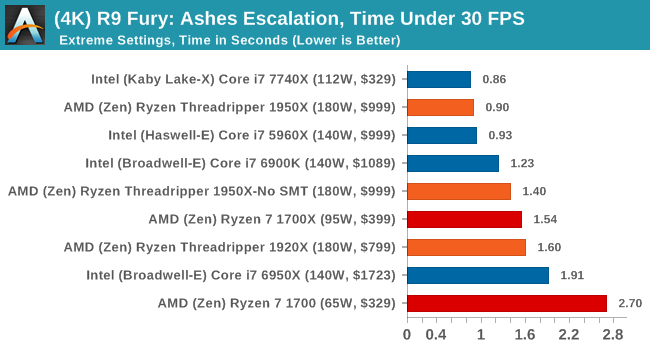
Sapphire Nitro R9 Fury 4G Performance
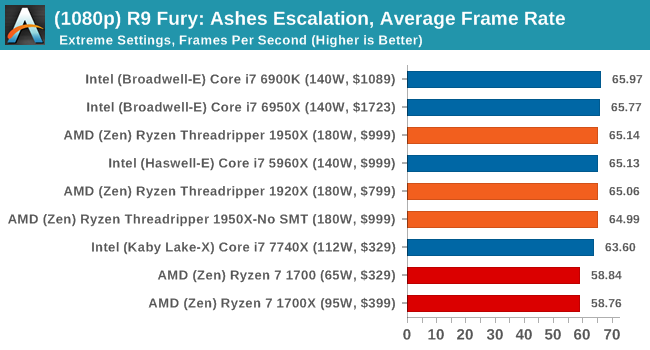
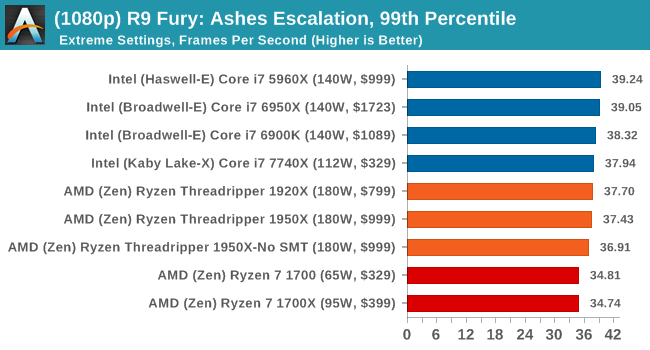
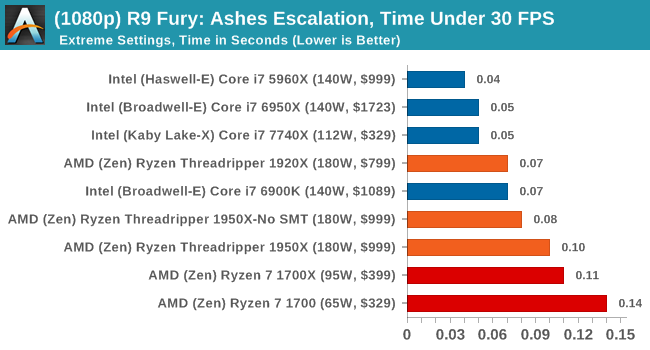
1080p
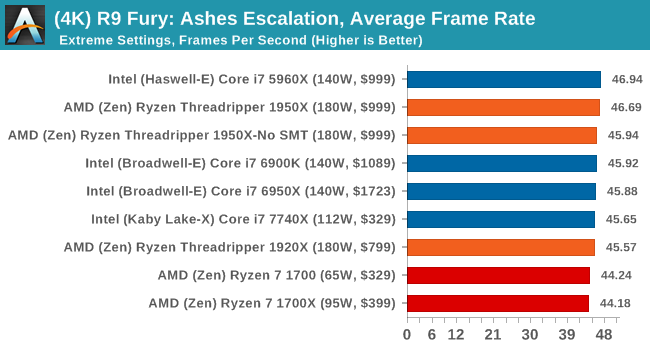
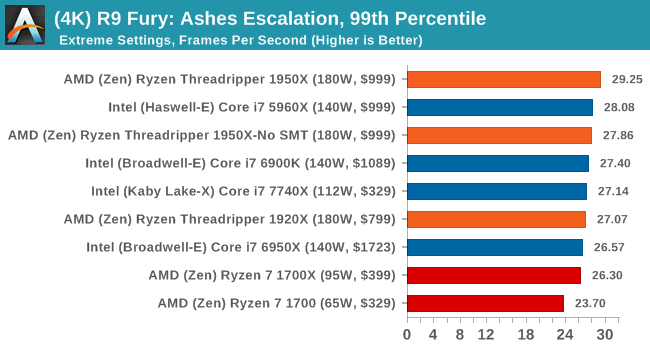
4K
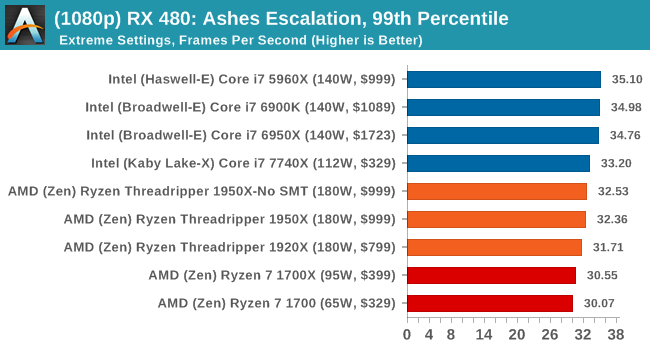
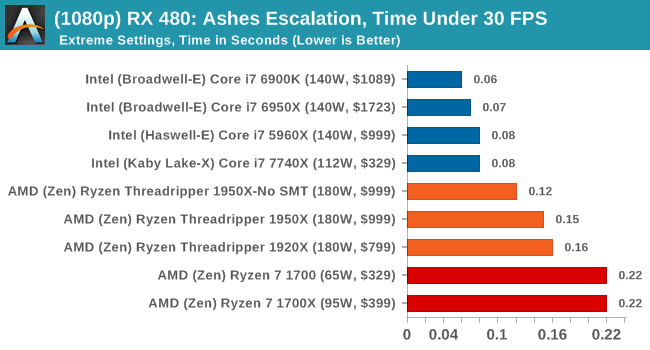
Sapphire Nitro RX 480 8G Performance
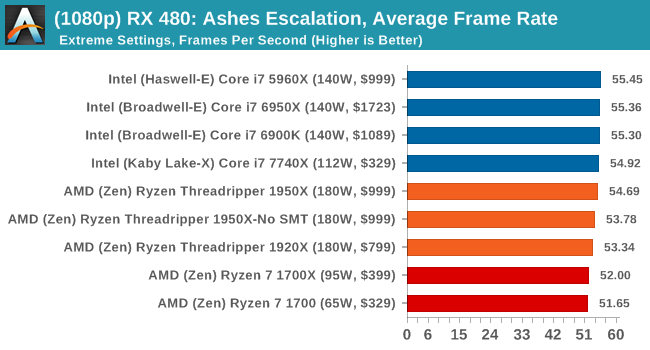
1080p
4K
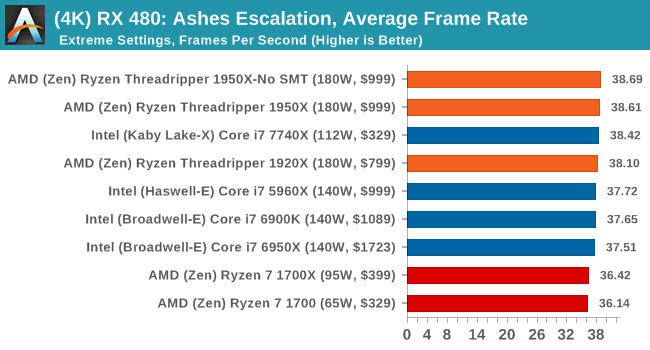
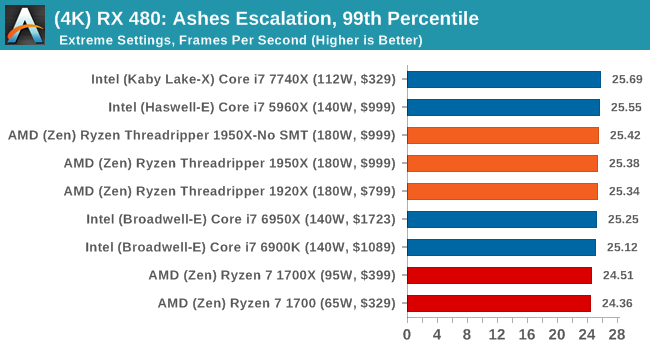
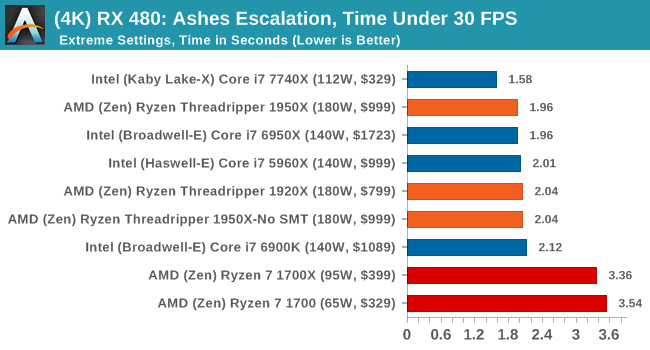
AMD gets in the mix a lot with these tests, and in a number of cases pulls ahead of the Ryzen chips in the Time Under analysis.


347 Comments
View All Comments
lefty2 - Thursday, August 10, 2017 - link
except that they haven'tDr. Swag - Thursday, August 10, 2017 - link
How so? You have the performance numbers, and they gave you power draw numbers...bongey - Thursday, August 10, 2017 - link
Just do a avx512 benchmark and Intel will jump over 300watts , 400watts(overclocked) only from the cpu. (prime95 avx512 benchmark).See der8auer's video "The X299 VRM Disaster (en)"DanNeely - Thursday, August 10, 2017 - link
The Chromium build time results are interesting. Anandtech's results have the 1950X only getting 3/4ths of the 7900X's performance. Arstechnica's getting almost equal results on both CPUs, but at 16 compiles per day vs 24 or 32 is seeing significantly worse numbers all around.I'm wondering what's different between the two compile benchmarks to see such a large spread.
cknobman - Thursday, August 10, 2017 - link
I think it has a lot to do with the RAM used by Anandtech vs Arstechnica .For all the regular benchmarking Anand used DDR4 2400, only the DDR 3200 was used in some overcloking.
Arstechnica used DDR4 3200 for all benchmarking.
Everyone already knows how faster DDR4 memory helps the Zen architecture.
DanNeely - Thursday, August 10, 2017 - link
If ram was the determining factor, Ars should be seeing faster build times though not slower ones.carewolf - Thursday, August 10, 2017 - link
Anandtech must have misconfigured something. Building chromium is scales practically linearly. You can move jobs all the way across a slow network and compile on another machine and you still get linear speed-ups with more added cores.Ian Cutress - Thursday, August 10, 2017 - link
We're using a late March v56 code base with MSVC.Ars is using a newer v62 code base with clang-cl and VC++ linking
We locked in our versions when we started testing Windows 10 a few months ago.
supdawgwtfd - Friday, August 11, 2017 - link
Maybe drop it then as it is not at all usefull info.Johan Steyn - Thursday, August 10, 2017 - link
I refrained from posting on the previous article, but now I'm quite sure Anand is being paid by Intel. It is not that I argue against the benchmarks, but how it is presented. I was even under the impression that this was an Intel review.The previous article was stated as "Introducing Intel's Desktop Processor" Huge marketing research is done on how to market products. By just stating one thing first or in a different way, quite different messages can be conveyed without lying outright.
By making the "Most Powerful, Most Scalable" Bold, that is what the readers read first, then they read "Desktop Processor" without even reading that is is Intel's. This is how marketing works, so Anand used slanted journalism to favour Intel, yet most people will just not realise it eat it up.
In this review there are so many slanted journalism problems, it is just sad. If you want, just compare it to other sites reviews. They just omit certain tests and list others at which Intel excel.
I have lost my respect for Anandtech with these last two articles of them, and I have followed Anandtech since its inception. Sad to see that you are also now bought by Intel, even though I suspected this before. Congratulations for making this so clear!!!