The AMD Ryzen Threadripper 1950X and 1920X Review: CPUs on Steroids
by Ian Cutress on August 10, 2017 9:00 AM ESTCPU Office Tests
The office programs we use for benchmarking aren't specific programs per-se, but industry standard tests that hold weight with professionals. The goal of these tests is to use an array of software and techniques that a typical office user might encounter, such as video conferencing, document editing, architectural modeling, and so on and so forth.
All of our benchmark results can also be found in our benchmark engine, Bench.
Chromium Compile (v56)
Our new compilation test uses Windows 10 Pro, VS Community 2015.3 with the Win10 SDK to compile a nightly build of Chromium. We've fixed the test for a build in late March 2017, and we run a fresh full compile in our test. Compilation is the typical example given of a variable threaded workload - some of the compile and linking is linear, whereas other parts are multithreaded.
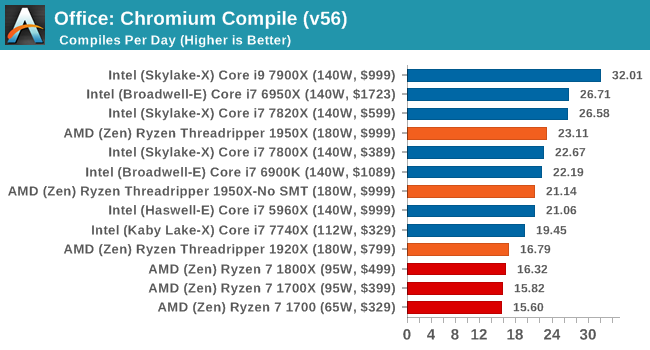
One of the interesting data points in our test is the Compile, and it is surprising to see the 1920X only just beat the Ryzen 7 chips. Because this test requires a lot of cross-core communication, the fewer cores per CCX there are, the worse the result. This is why the 1950X in SMT-off mode beats the 3 cores-per-CCX 1920X, along with lower latency memory support. We know that this test is not too keen on victim caches either, but it does seem that the 2MB per core ratio does well for the 1950X, and could explain the performance difference moving from 8 to 12 to 16 cores under the Zen microarchitecture.
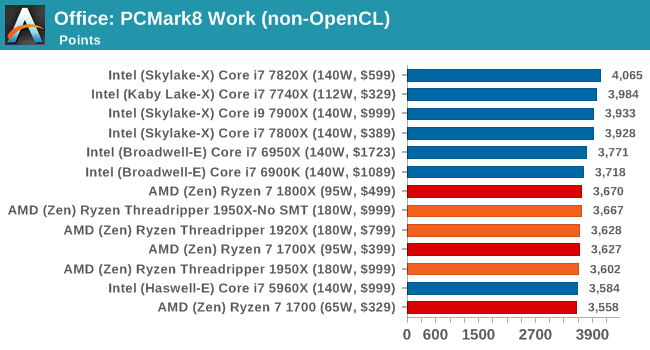
PCMark8: link
Despite originally coming out in 2008/2009, Futuremark has maintained PCMark8 to remain relevant in 2017. On the scale of complicated tasks, PCMark focuses more on the low-to-mid range of professional workloads, making it a good indicator for what people consider 'office' work. We run the benchmark from the commandline in 'conventional' mode, meaning C++ over OpenCL, to remove the graphics card from the equation and focus purely on the CPU. PCMark8 offers Home, Work and Creative workloads, with some software tests shared and others unique to each benchmark set.
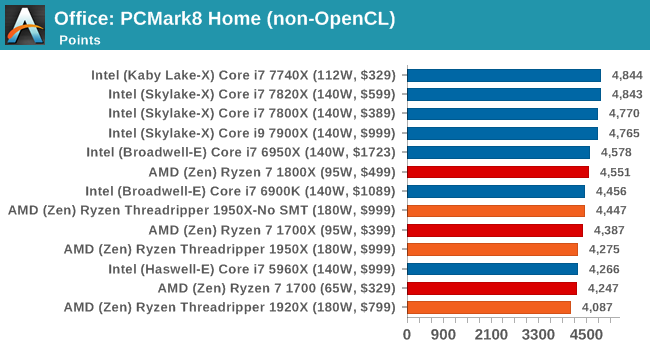
Strangely, PCMark 8's Creative test seems to be failing across the board. We're trying to narrow down the issue.
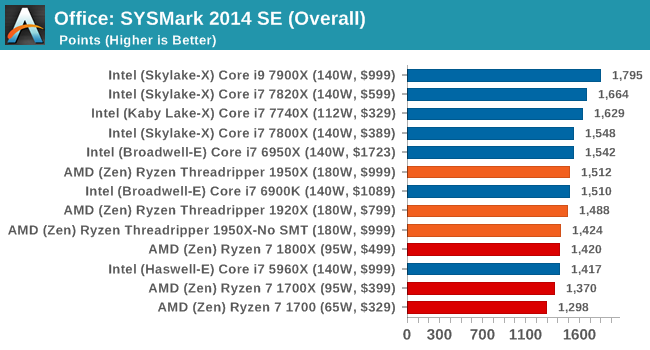
SYSmark 2014 SE: link
SYSmark is developed by Bapco, a consortium of industry CPU companies. The goal of SYSmark is to take stripped down versions of popular software, such as Photoshop and Onenote, and measure how long it takes to process certain tasks within that software. The end result is a score for each of the three segments (Office, Media, Data) as well as an overall score. Here a reference system (Core i3-6100, 4GB DDR3, 256GB SSD, Integrated HD 530 graphics) is used to provide a baseline score of 1000 in each test.
A note on context for these numbers. AMD left Bapco in the last two years, due to differences of opinion on how the benchmarking suites were chosen and AMD believed the tests are angled towards Intel processors and had optimizations to show bigger differences than what AMD felt was present. The following benchmarks are provided as data, but the conflict of opinion between the two companies on the validity of the benchmark is provided as context for the following numbers.


347 Comments
View All Comments
verl - Thursday, August 10, 2017 - link
"well above the Ryzen CPUs, and batching the 10C/8C parts from Broadwell-E and Haswell-E respectively"??? From the Power Consumption page.
bongey - Thursday, August 10, 2017 - link
Yep if you use AVX-512 it will down clock to 1.8Ghz and draw 400w just for the CPU alone and 600w from the wall. See der8auer's video title "The X299 VRM Disaster (en)", all x299 motherboards VRMs can be ran into thermal shutdown under avx 512 loads, with just a small overclock, not to mention avx512 crazy power consumption. That is why AMD didn't put avx 512 in Zen, it is power consumption monster.TidalWaveOne - Thursday, August 10, 2017 - link
Glad I went with the 7820X for software development (compiling).raddude9 - Thursday, August 10, 2017 - link
In ars' review they have TR-1950X ahead of the i9-7900X for compilation:https://arstechnica.co.uk/gadgets/2017/08/amd-thre...
In short it's very difficult to test compilation, every project you build has different properties.
emn13 - Thursday, August 10, 2017 - link
Yeah, the discrepency is huge - converted to anandtech's compile's per day the arstechnica benchmark maxes out at a little less than 20, which is a far cry from the we see here.Clearly, the details of the compiler, settings and codebase (and perhaps other things!) matter hugely.
That's unfortunate, because compilation is annoyingly slow, and it would be a boon to know what to buy to ameliorate that.
prisonerX - Thursday, August 10, 2017 - link
This is very compiler dependent. My compiler is blazingly fast on my wimpy hardware becuase it's blazingly clever. Most compilers seem to crawl no matter what they run on.bongey - Thursday, August 10, 2017 - link
Looks like anandtech's benchmark for compiling is bunk, it's just way off from all the other benchmarks out there. Not only that, no other test shows a 20% improvement over the 6950x which is also a 10 core/20 thread cpu. Something tells me the 7900x is completely wrong or has something faster like a different pcie ssd.Chad - Thursday, August 10, 2017 - link
All I know is, for those of us running Plex, SABnzbd, Sonarr, Radarr servers simultaneously (and others), while encoding and gaming all simultaneously, our day has arrived!:)
Ian Cutress - Thursday, August 10, 2017 - link
We checked with Ars as to their method.We use a fixed late March build around v56 under MSVC
Ars use a fixed newer build around v62 via clang-cl using VC++ linking
Same software, different compilers, different methods. Our results are faster than Ars, although Ars' results seem to scale better.
ddriver - Friday, August 11, 2017 - link
Of every review out there, only your "superior testing methodology" presents a picture where TR is slower than SX.