The AMD Ryzen Threadripper 1950X and 1920X Review: CPUs on Steroids
by Ian Cutress on August 10, 2017 9:00 AM ESTRise of the Tomb Raider (1080p, 4K)
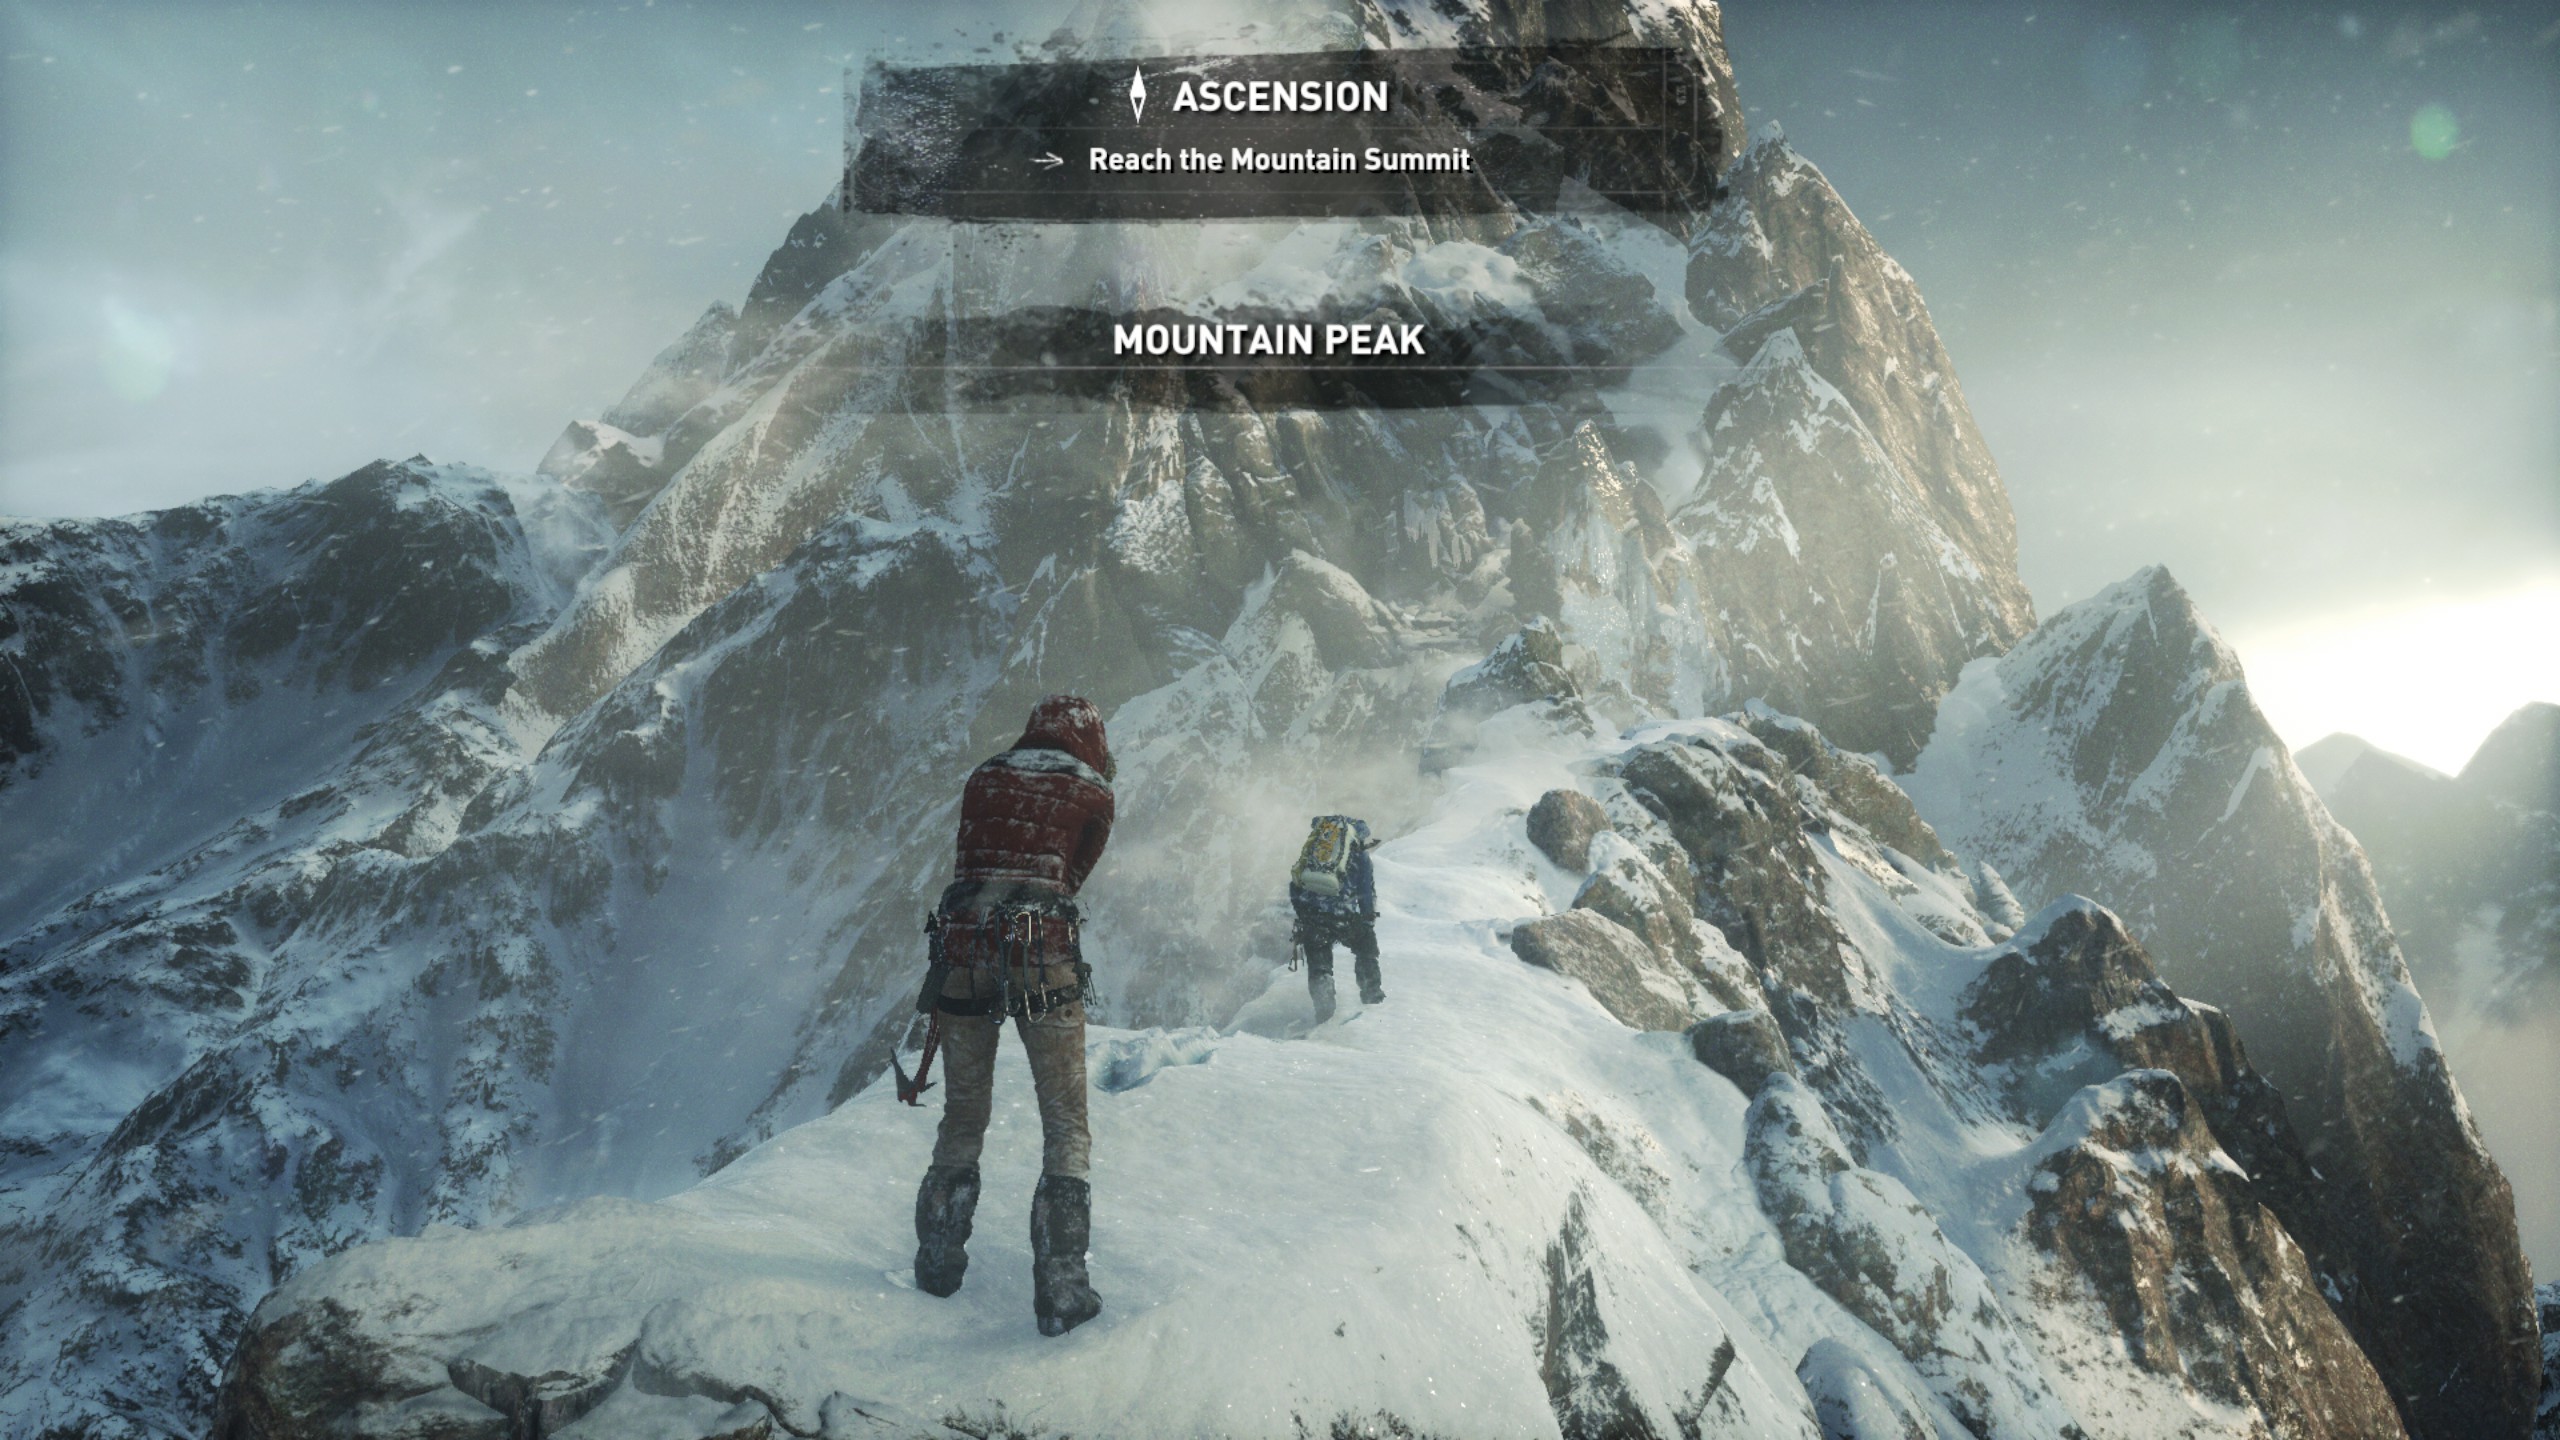
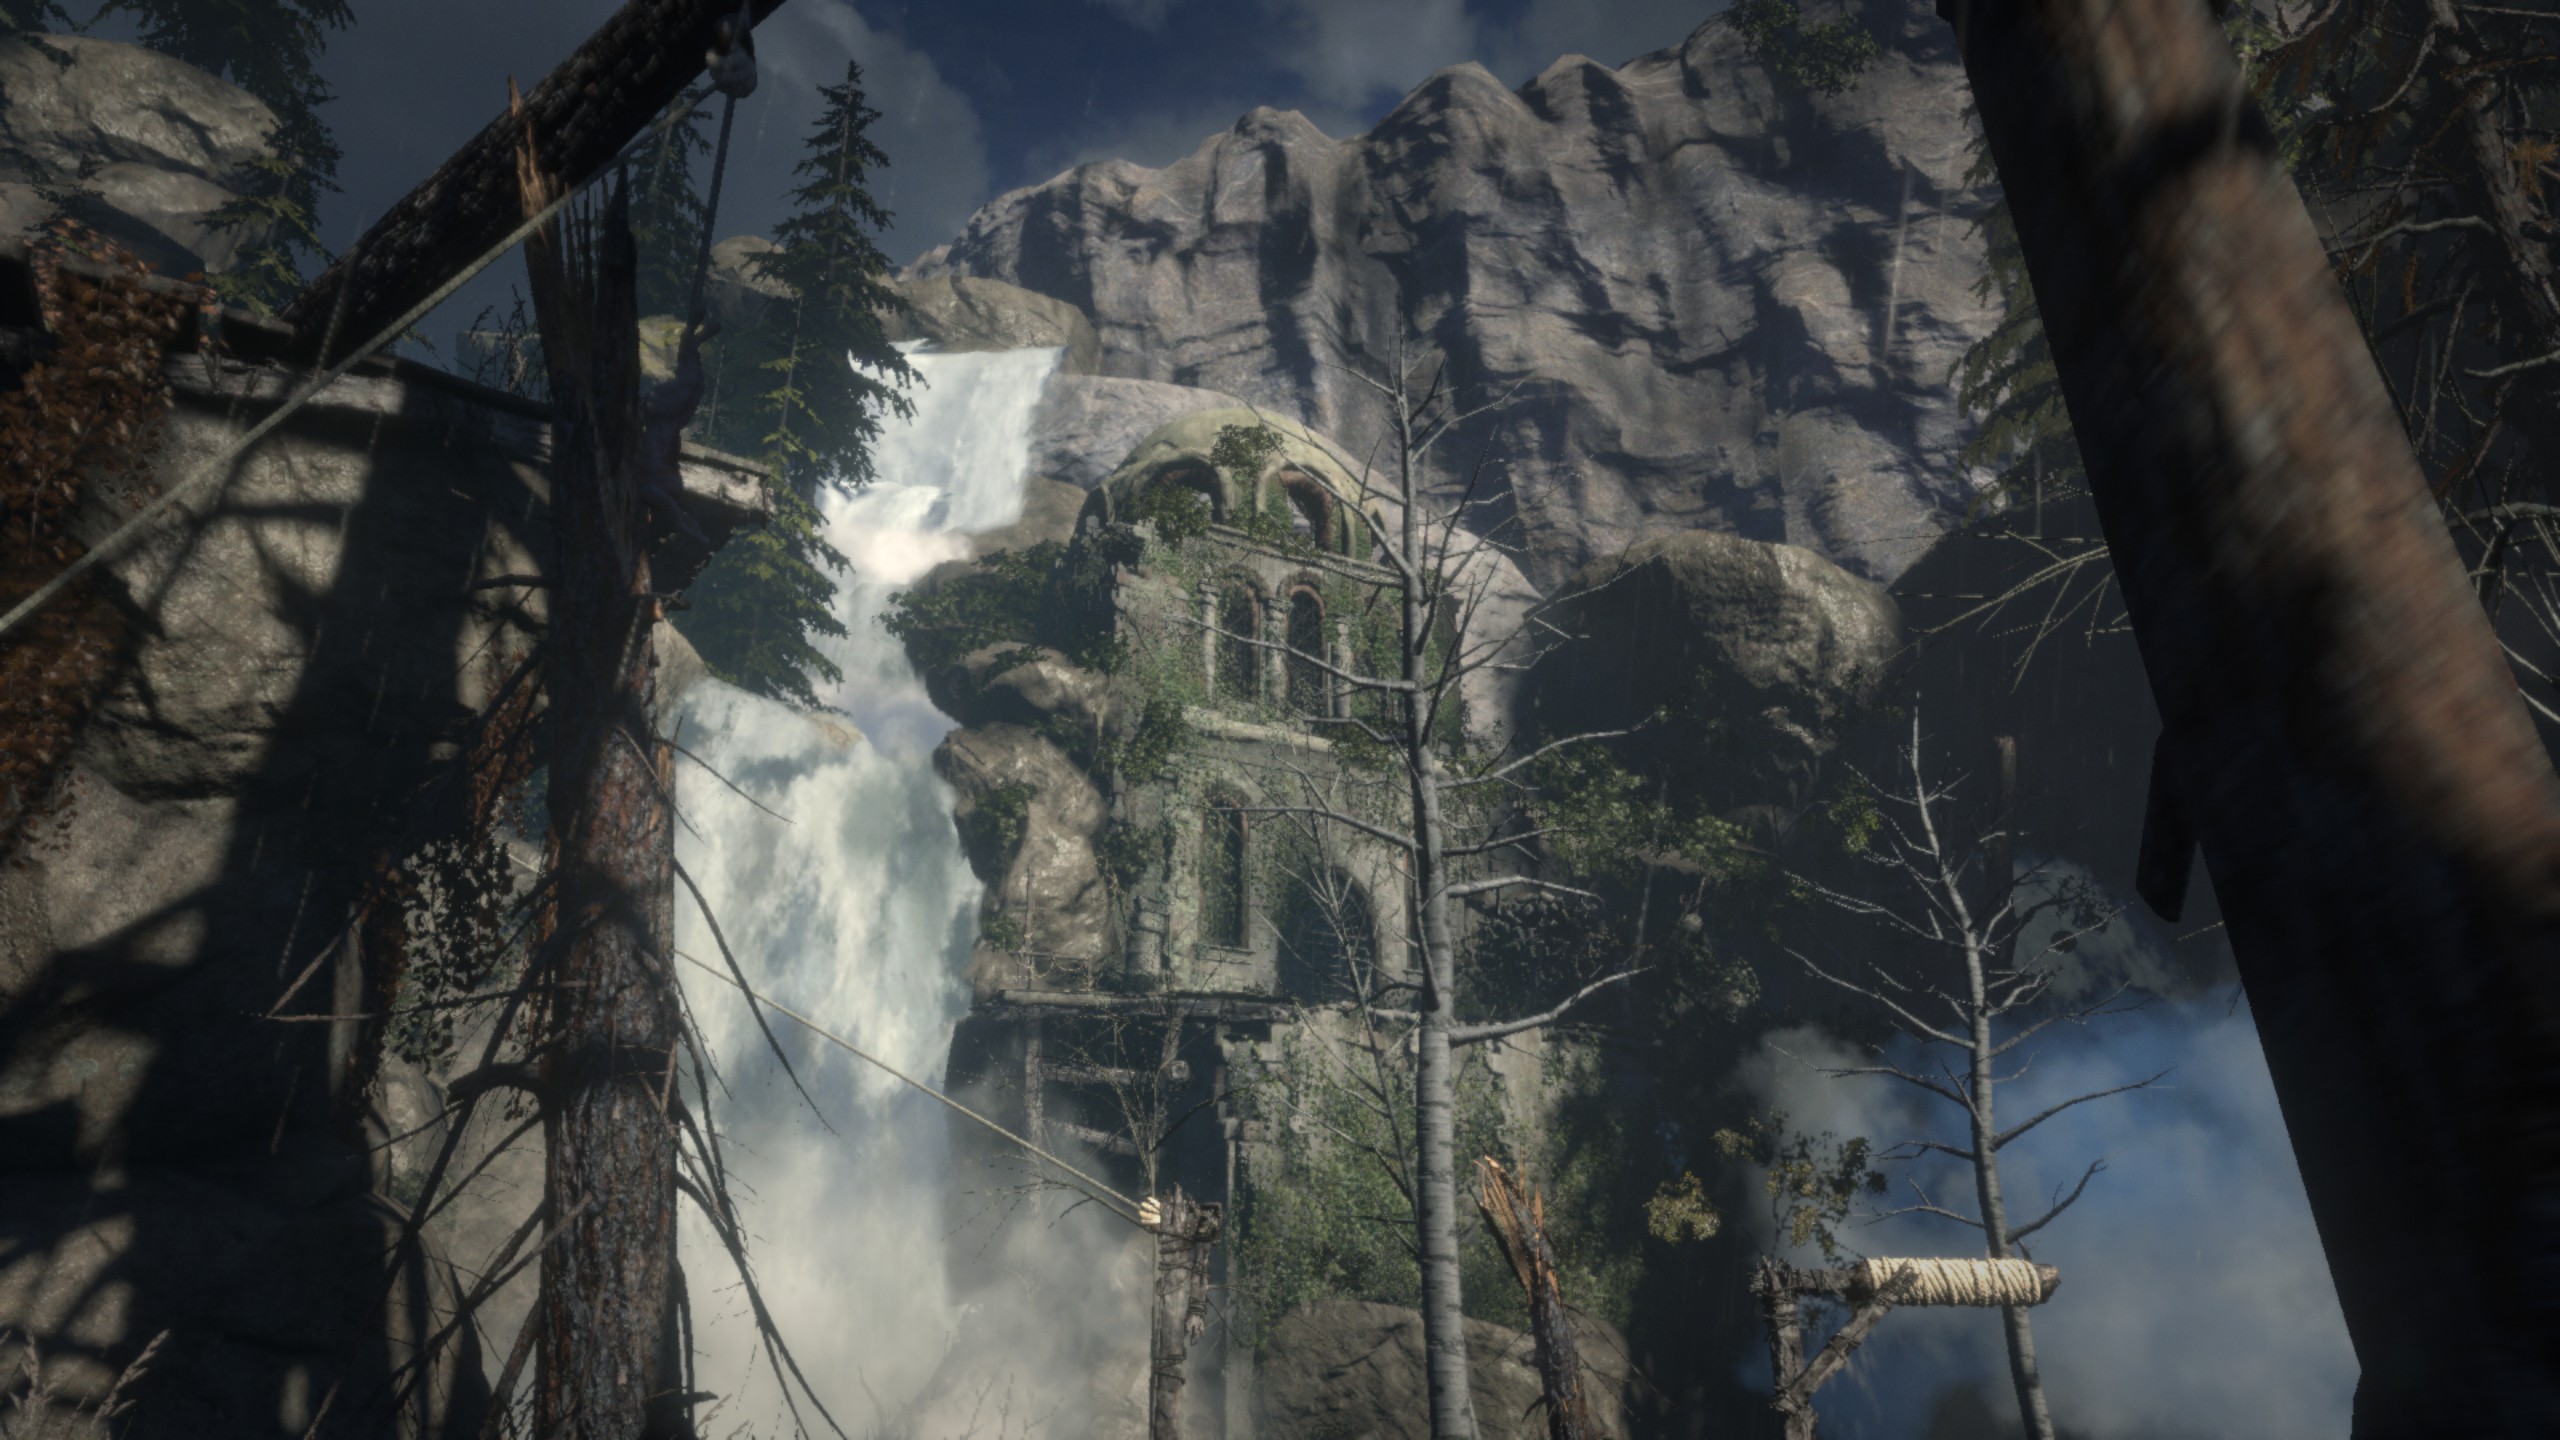
One of the newest games in the gaming benchmark suite is Rise of the Tomb Raider (RoTR), developed by Crystal Dynamics, and the sequel to the popular Tomb Raider which was loved for its automated benchmark mode. But don’t let that fool you: the benchmark mode in RoTR is very much different this time around.
Visually, the previous Tomb Raider pushed realism to the limits with features such as TressFX, and the new RoTR goes one stage further when it comes to graphics fidelity. This leads to an interesting set of requirements in hardware: some sections of the game are typically GPU limited, whereas others with a lot of long-range physics can be CPU limited, depending on how the driver can translate the DirectX 12 workload.
Where the old game had one benchmark scene, the new game has three different scenes with different requirements: Spine of the Mountain (1-Valley), Prophet’s Tomb (2-Prophet) and Geothermal Valley (3-Mountain) - and we test all three (and yes, I need to relabel them - I got them wrong when I set up the tests). These are three scenes designed to be taken from the game, but it has been noted that scenes like 2-Prophet shown in the benchmark can be the most CPU limited elements of that entire level, and the scene shown is only a small portion of that level. Because of this, we report the results for each scene on each graphics card separately.
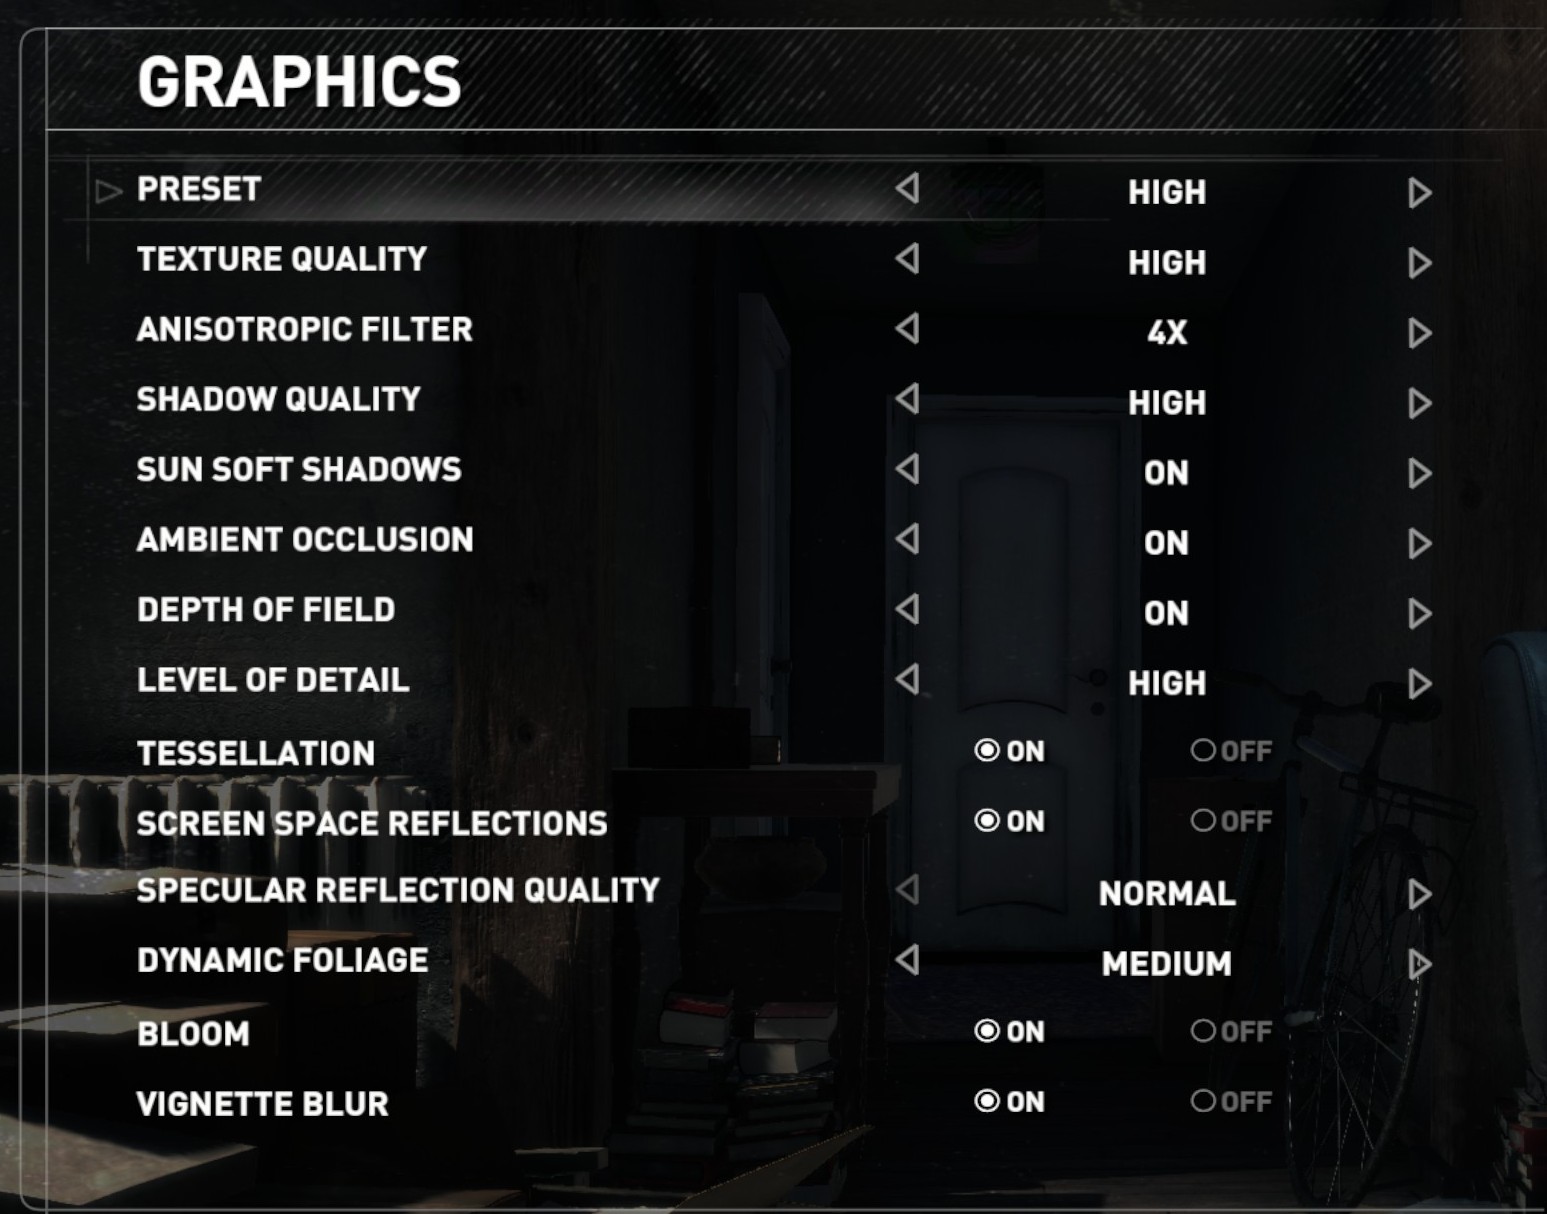
Graphics options for RoTR are similar to other games in this type, offering some presets or allowing the user to configure texture quality, anisotropic filter levels, shadow quality, soft shadows, occlusion, depth of field, tessellation, reflections, foliage, bloom, and features like PureHair which updates on TressFX in the previous game.
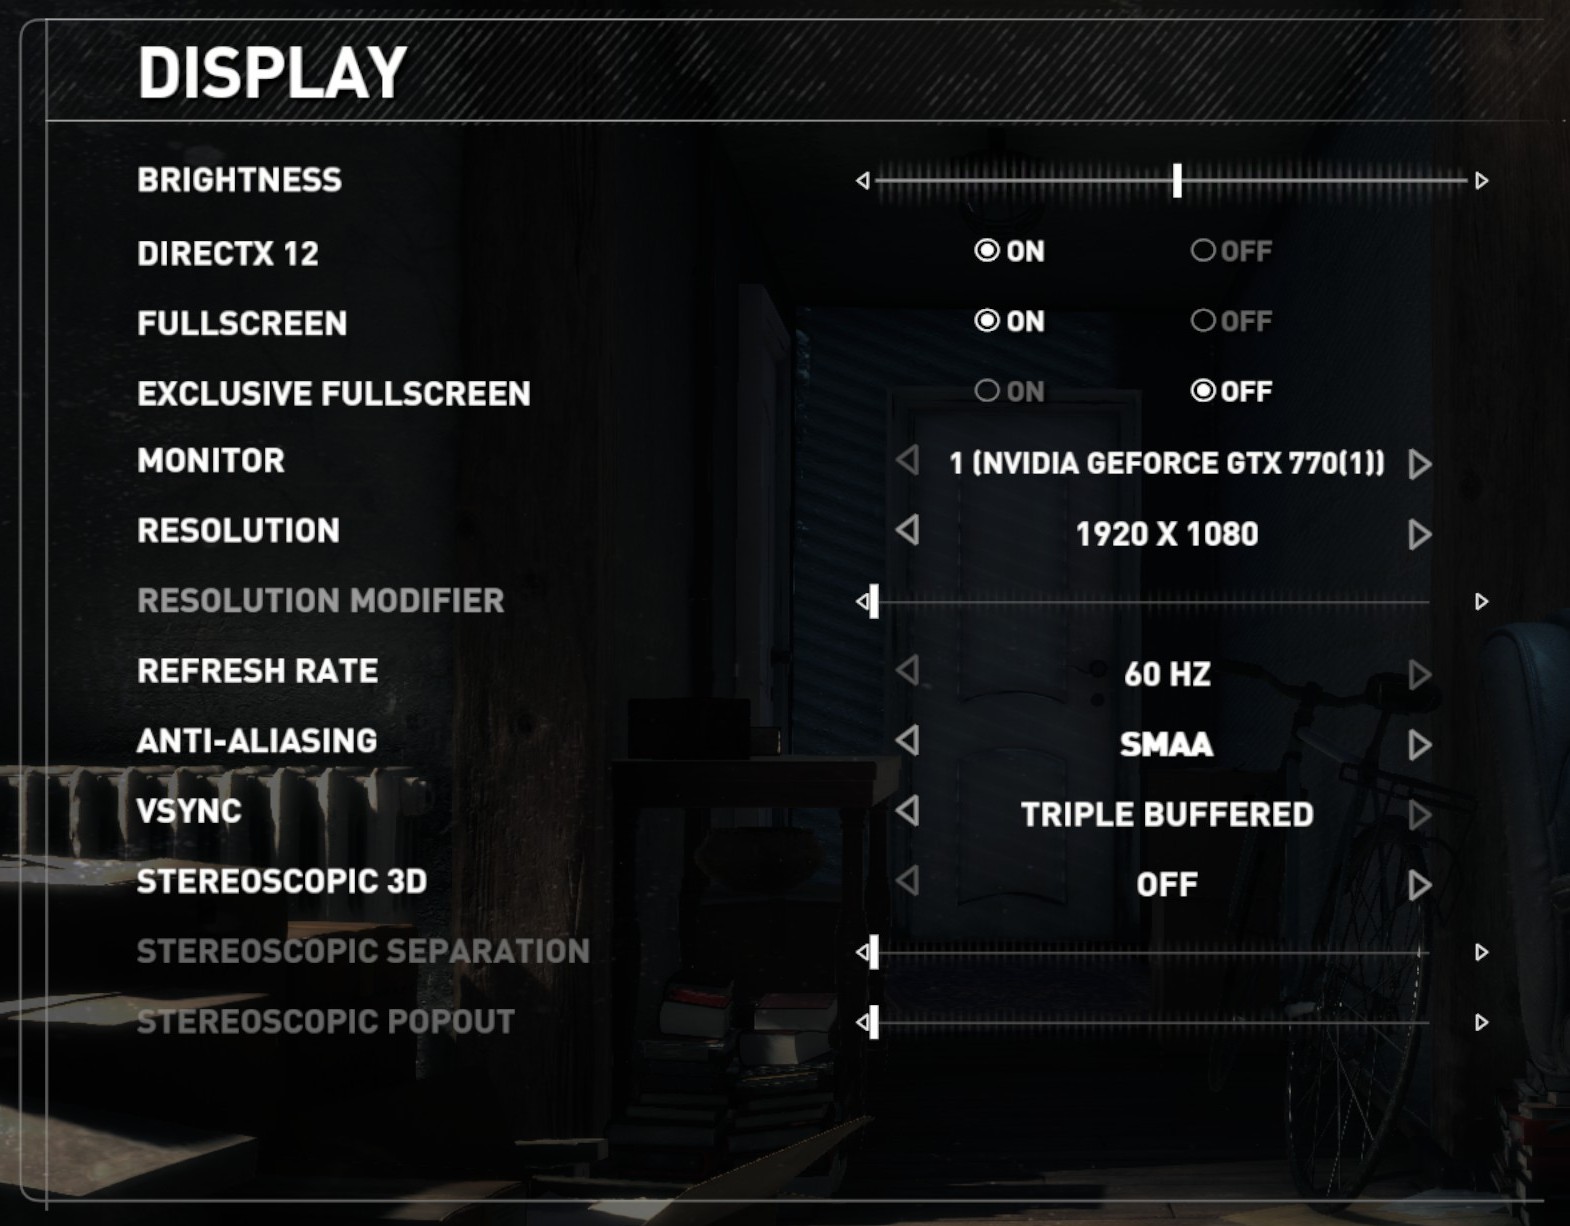
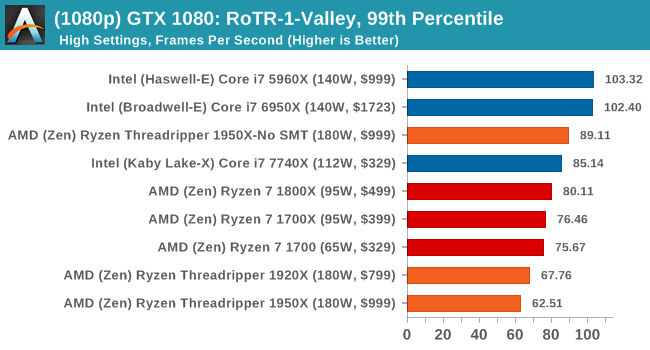
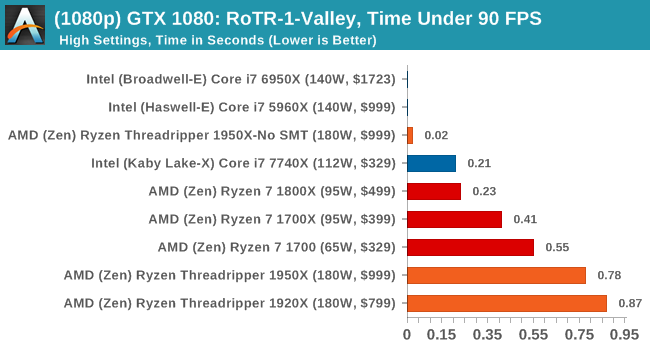
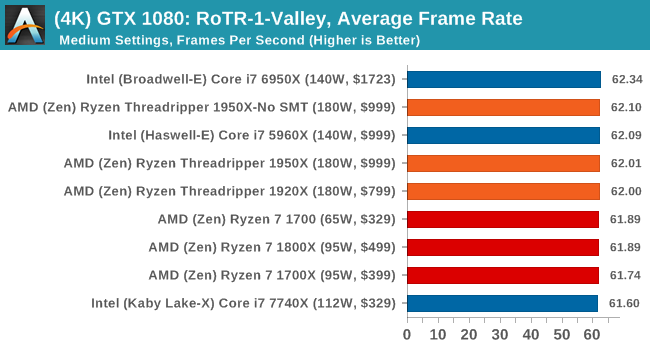
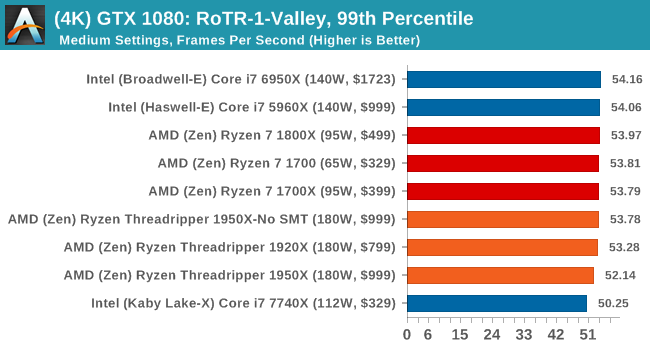
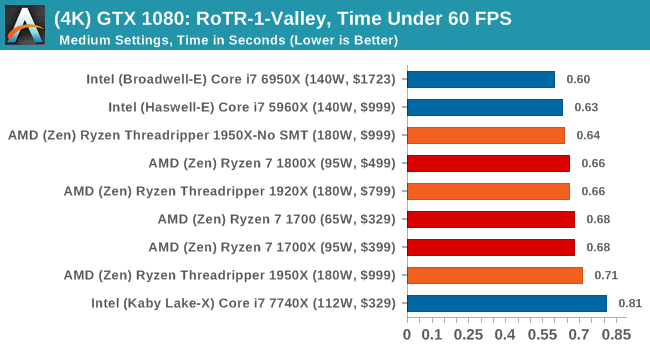
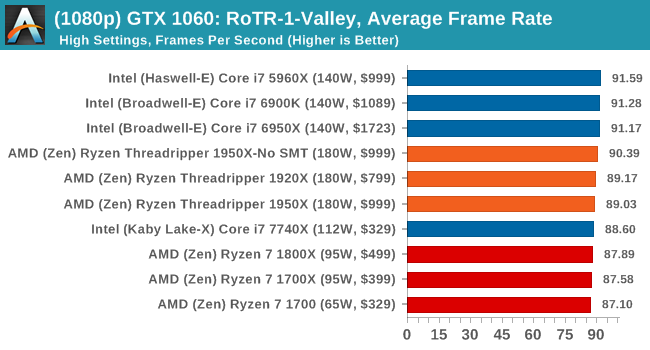
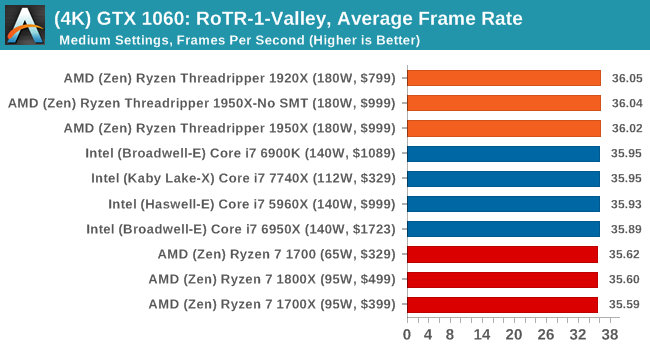
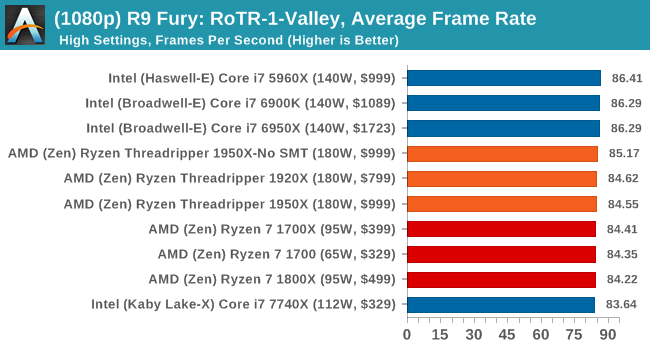
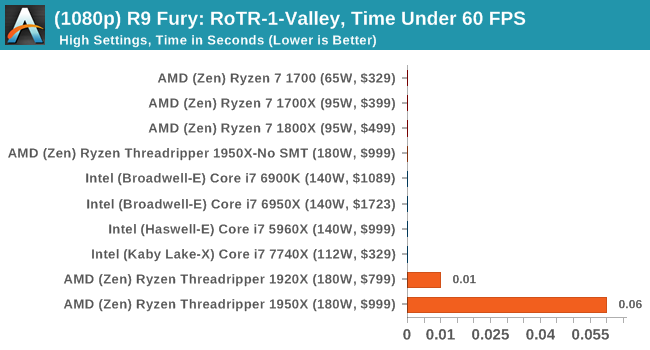
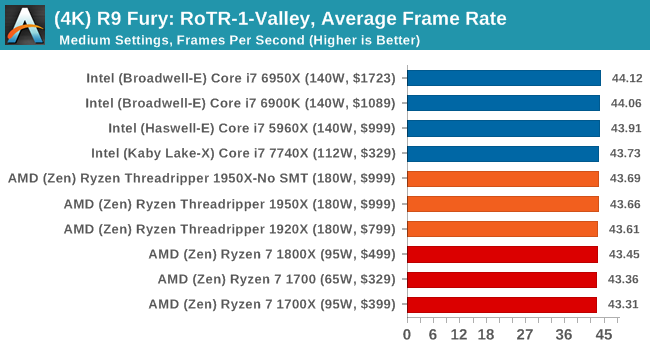
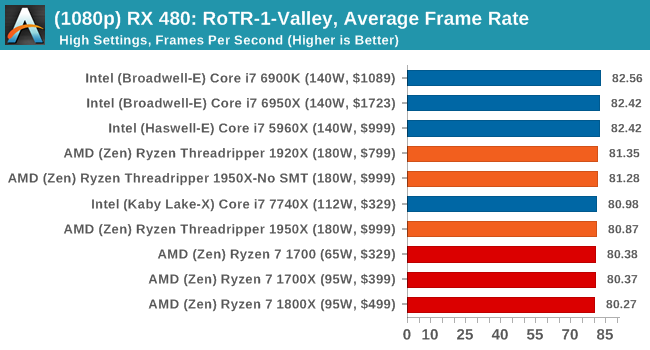
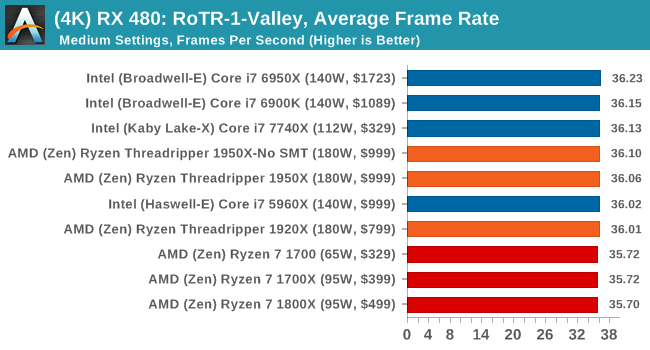
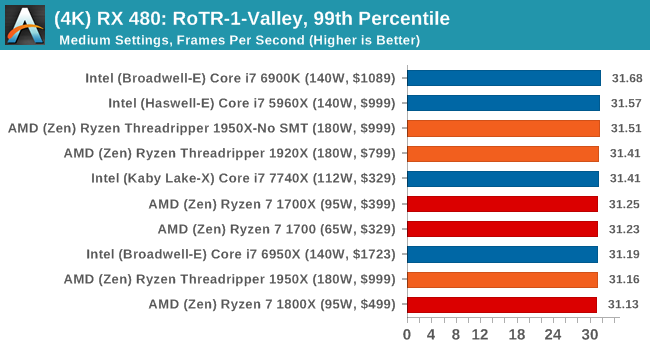
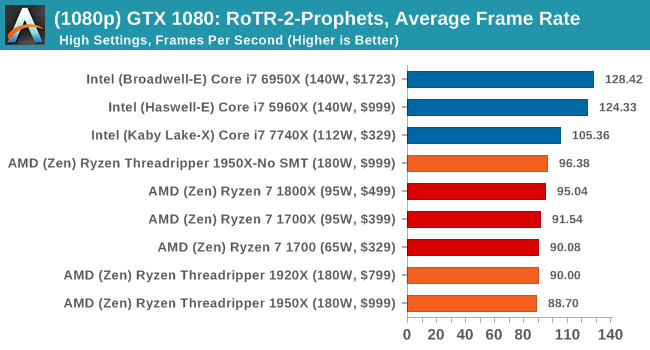
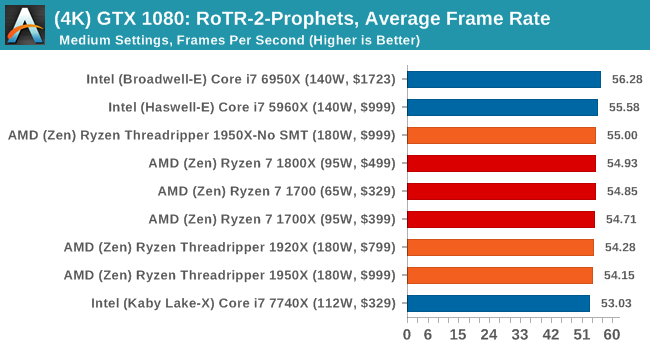
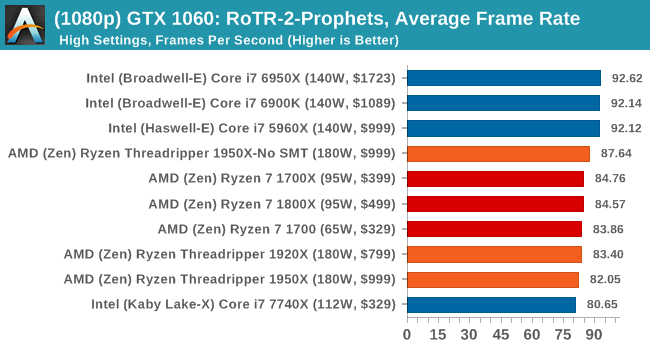
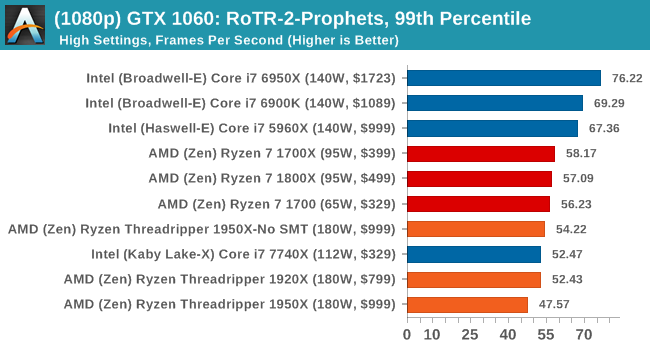
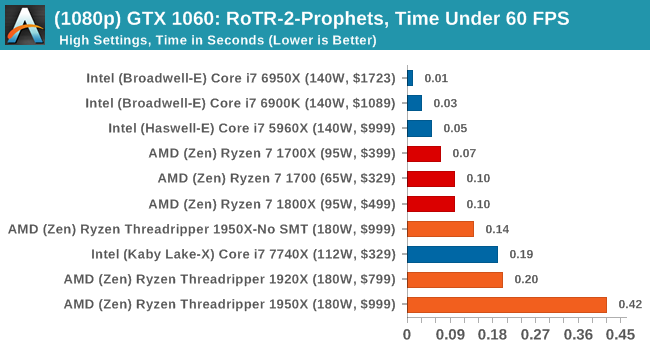
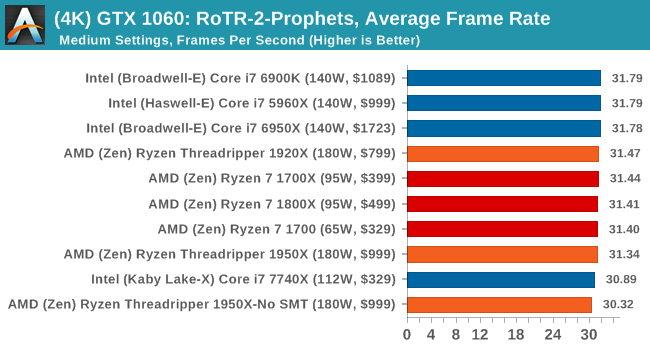
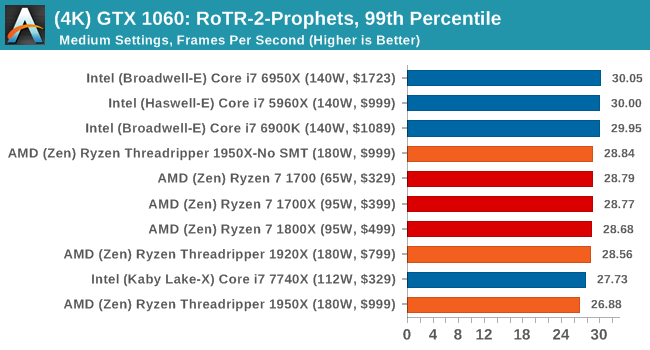
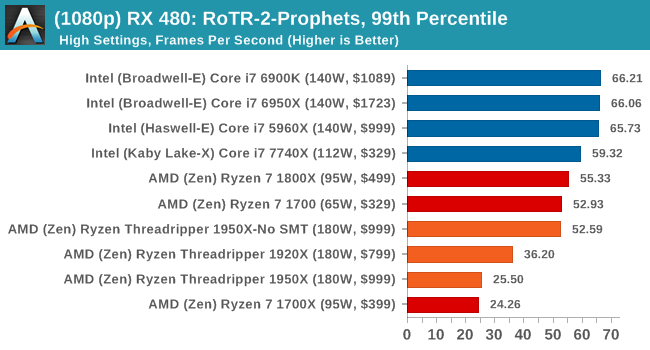
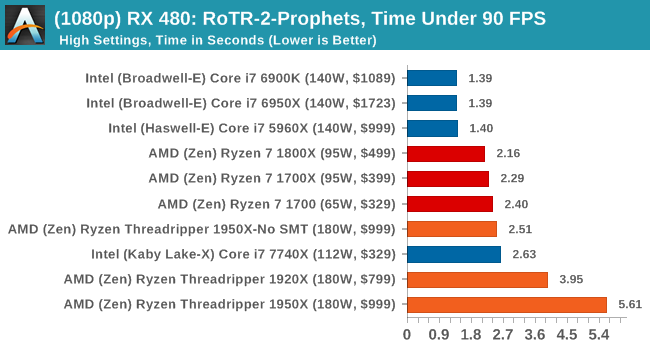
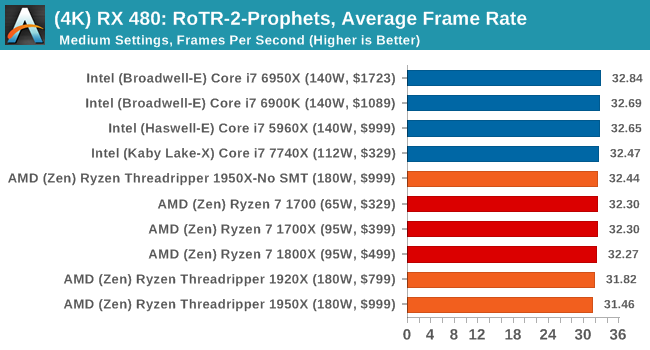
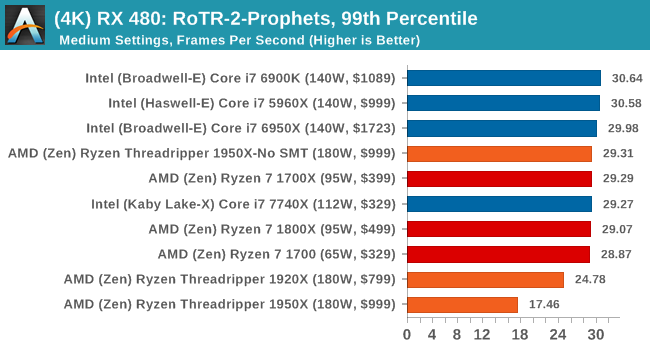
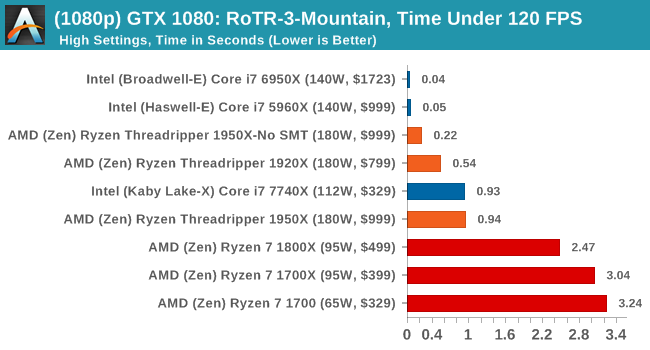
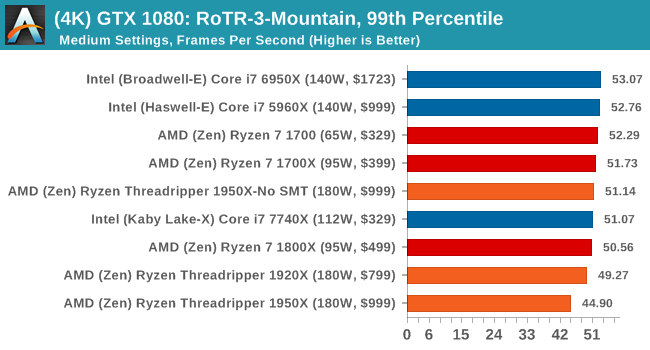
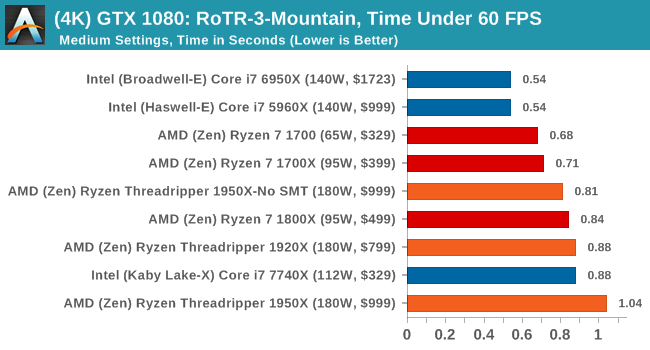
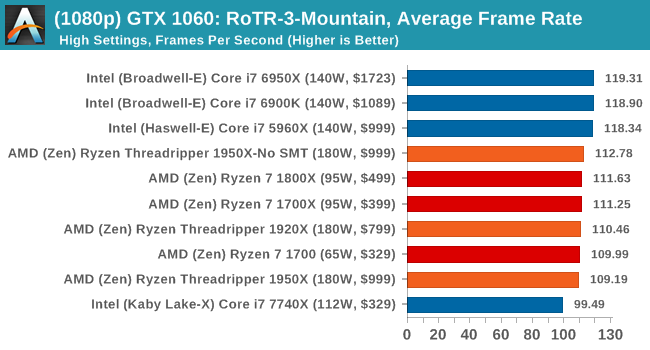
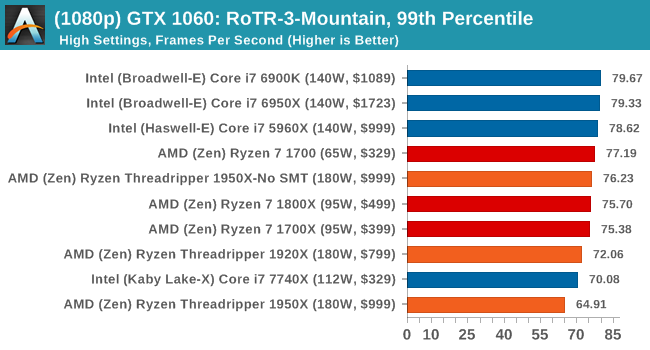
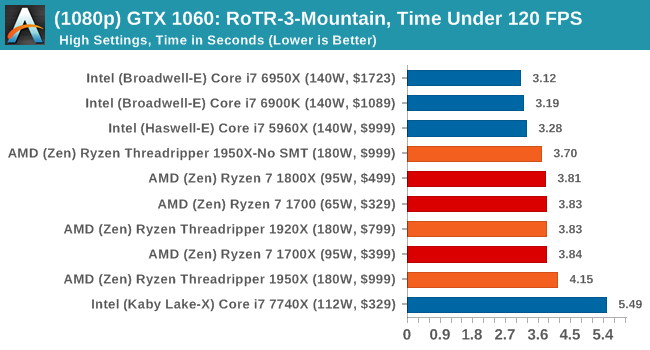
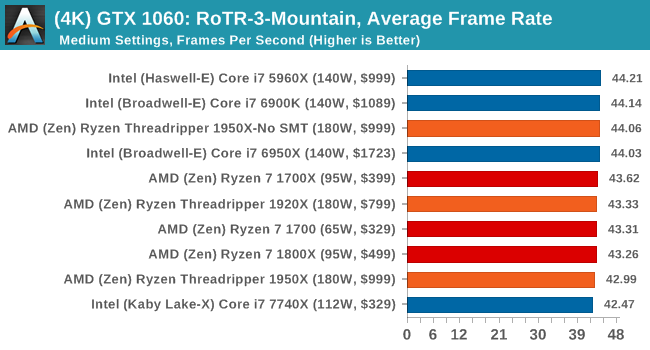
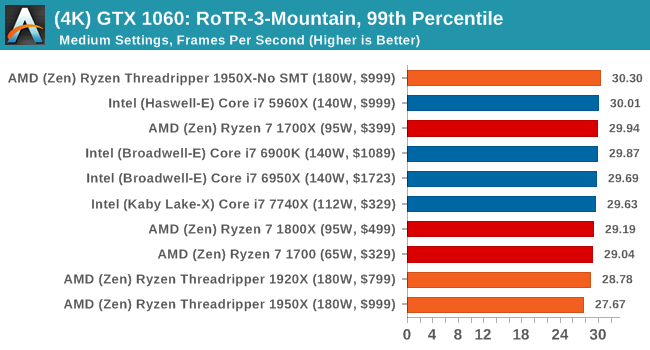
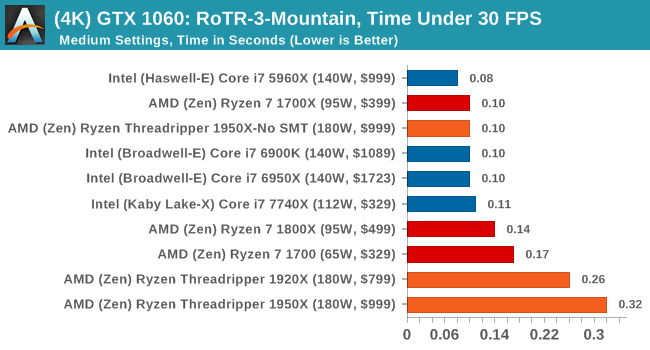
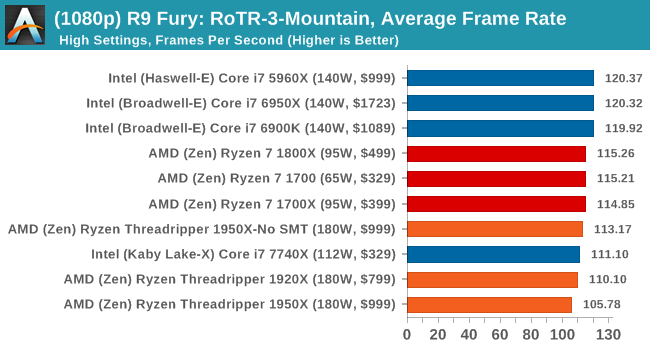
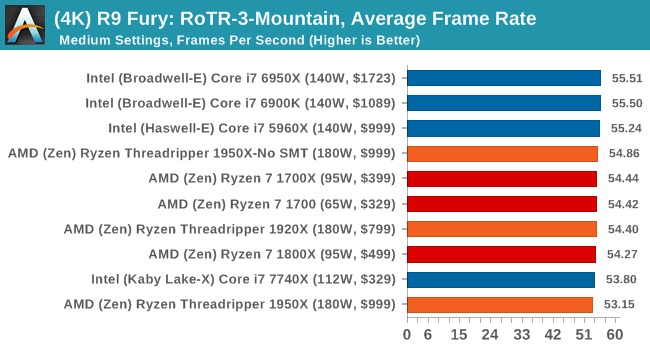
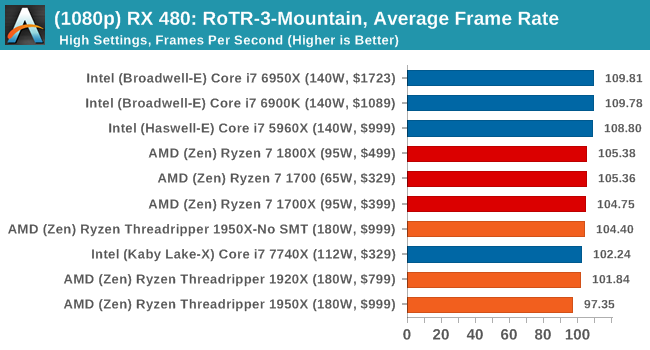
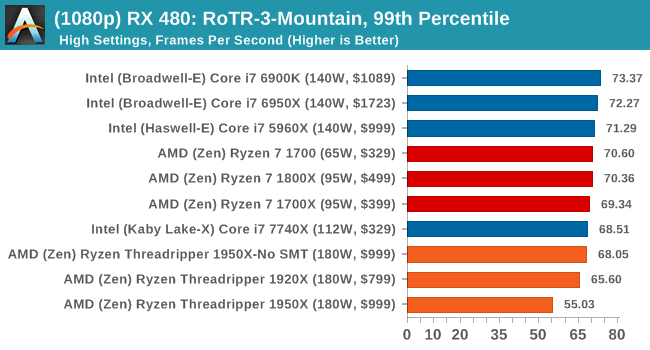
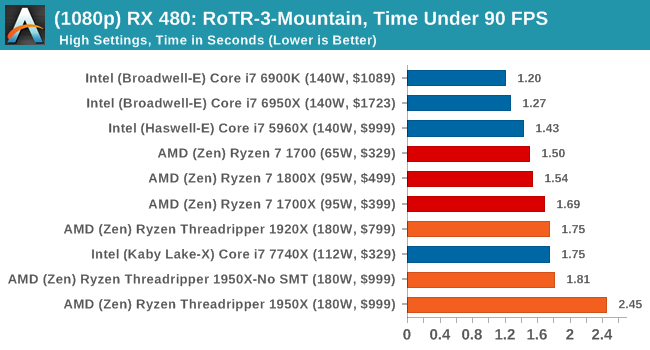
Again, we test at 1920x1080 and 4K using our native 4K displays. At 1080p we run the High preset, while at 4K we use the Medium preset which still takes a sizable hit in frame rate.
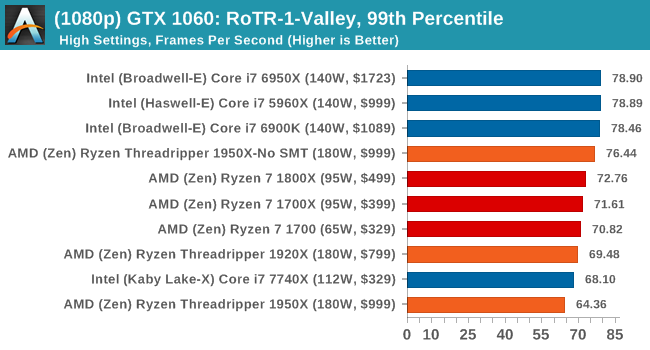
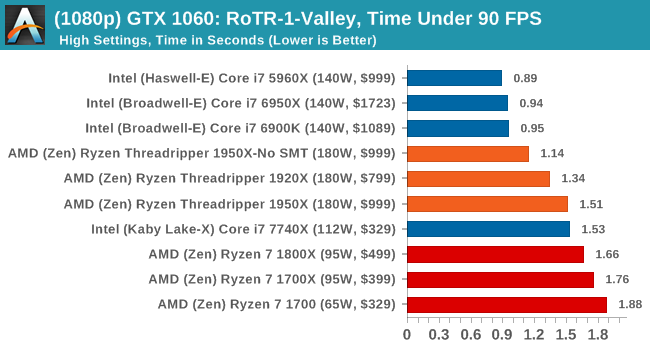
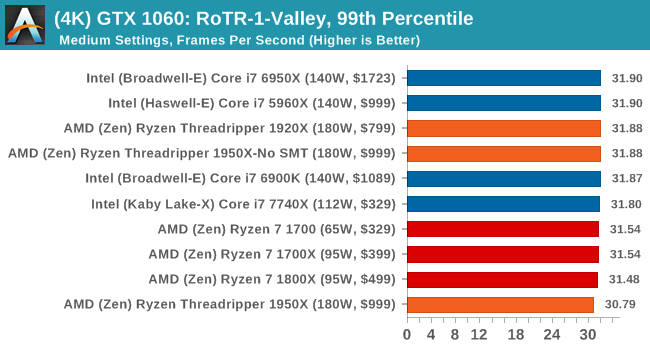
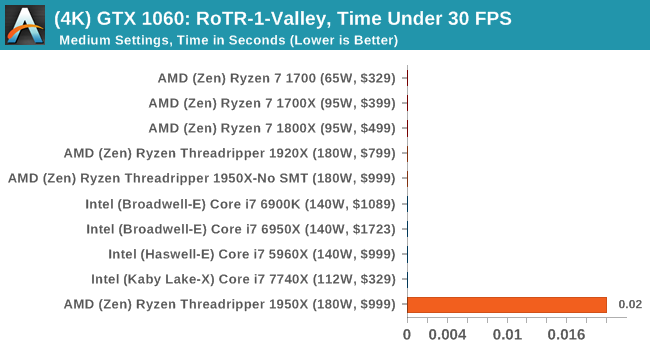
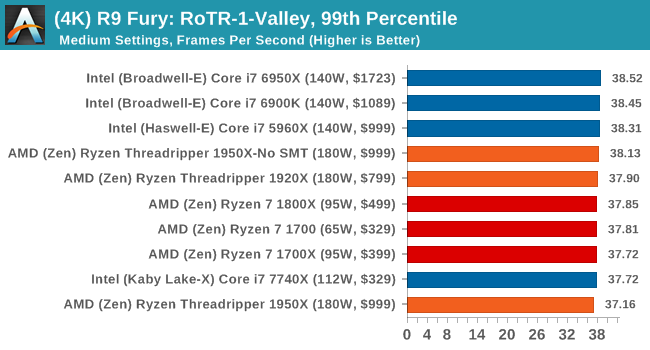
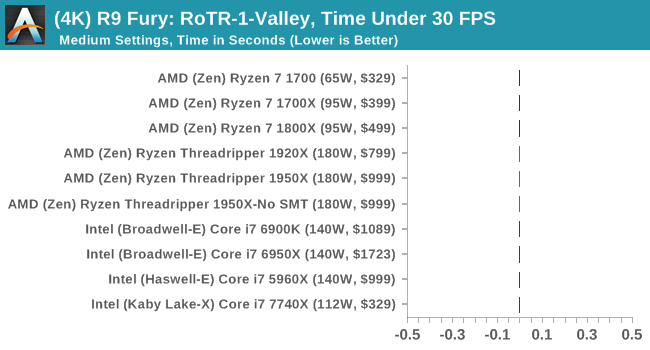
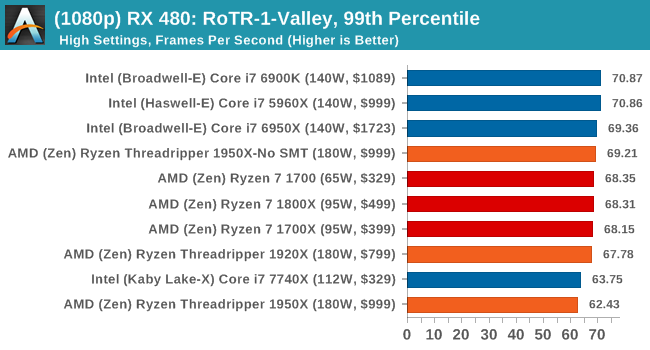
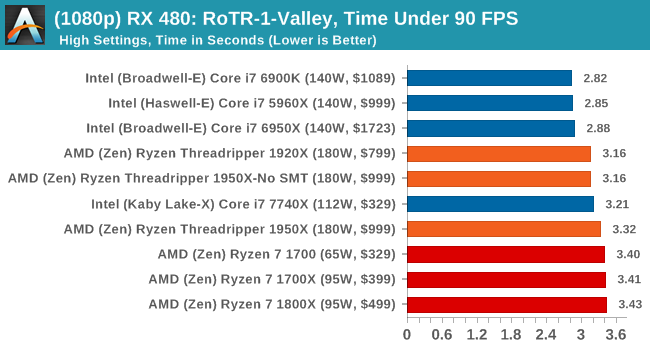
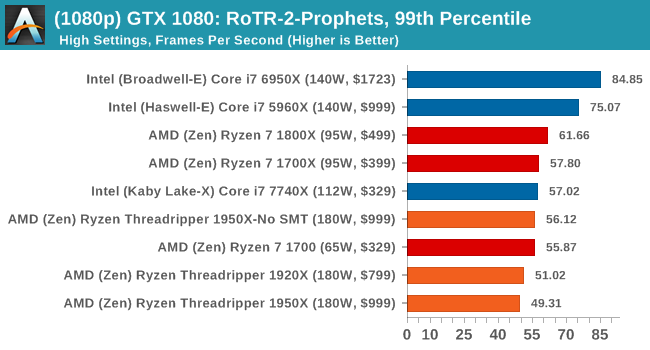
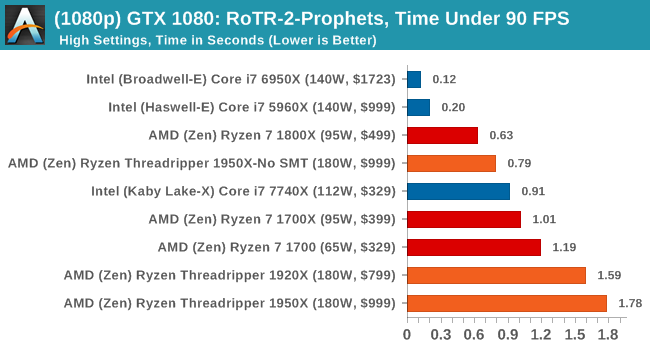
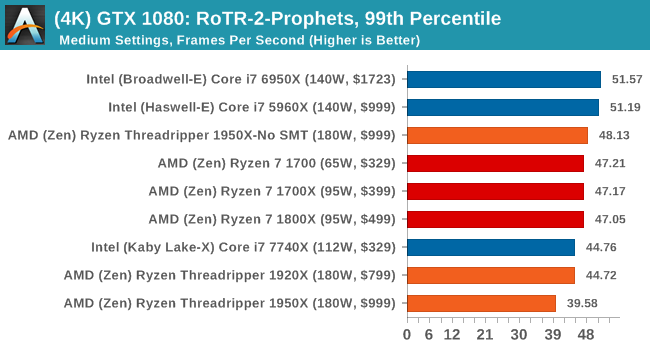
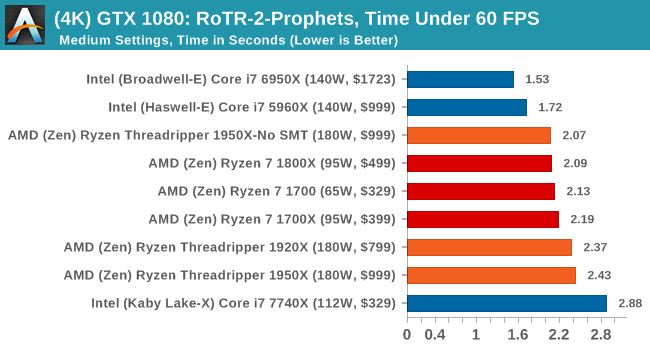
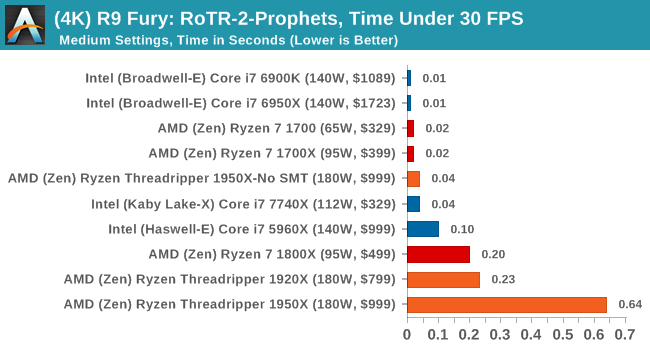
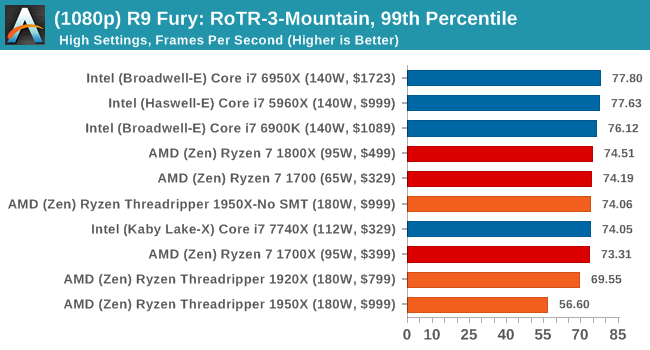
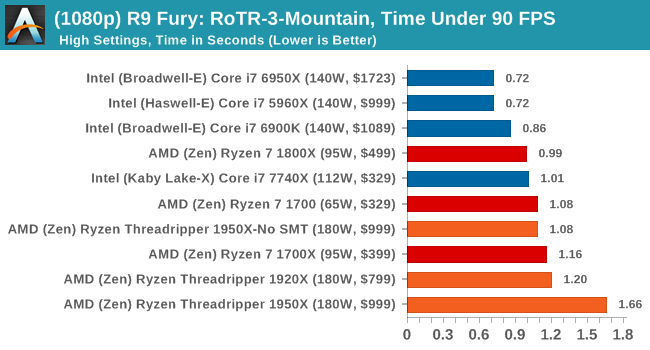
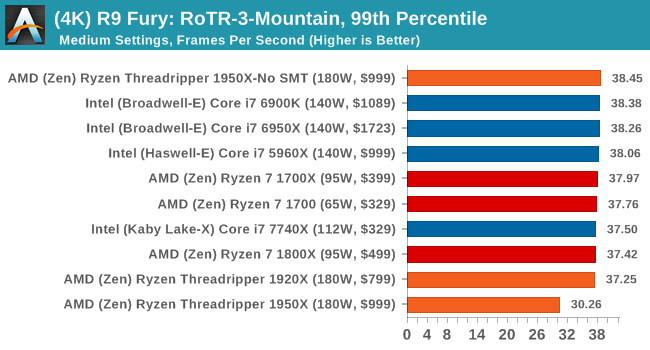
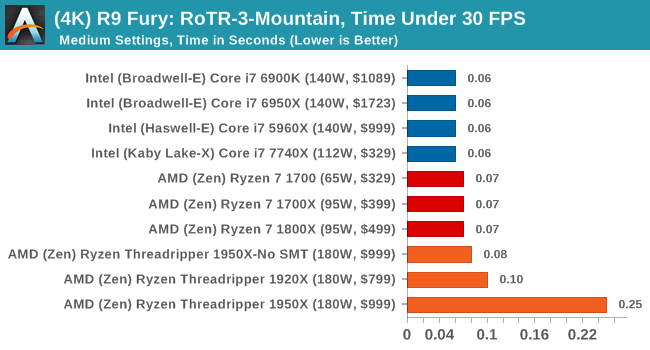
It is worth noting that RoTR is a little different to our other benchmarks in that it keeps its graphics settings in the registry rather than a standard ini file, and unlike the previous TR game the benchmark cannot be called from the command-line. Nonetheless we scripted around these issues to automate the benchmark four times and parse the results. From the frame time data, we report the averages, 99th percentiles, and our time under analysis.
All of our benchmark results can also be found in our benchmark engine, Bench.
#1 Geothermal Valley Spine of the Mountain

MSI GTX 1080 Gaming 8G Performance
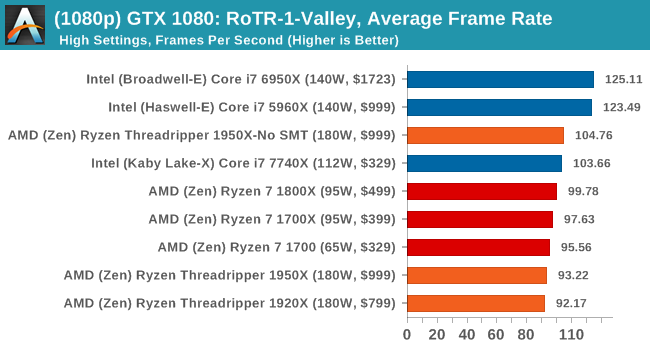
1080p
4K
ASUS GTX 1060 Strix 6G Performance
1080p
4K
Sapphire Nitro R9 Fury 4G Performance
1080p

4K
Sapphire Nitro RX 480 8G Performance
1080p
4K

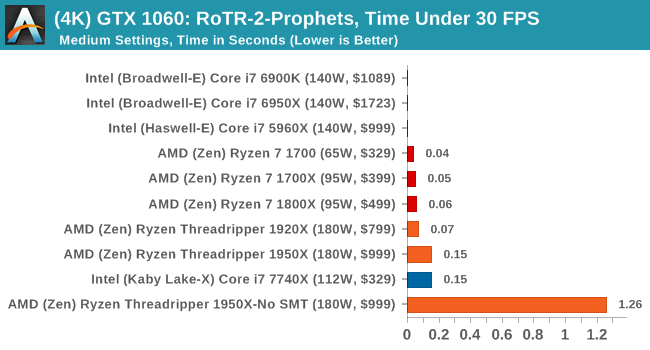
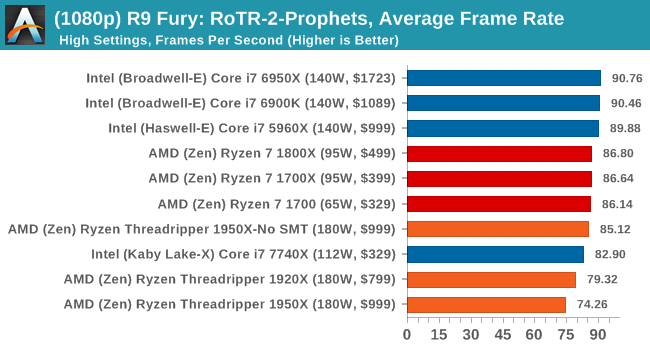
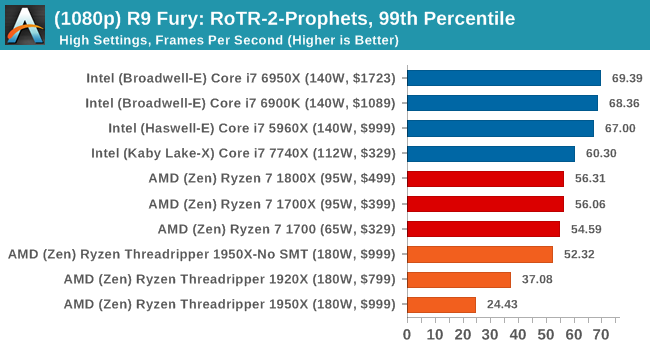
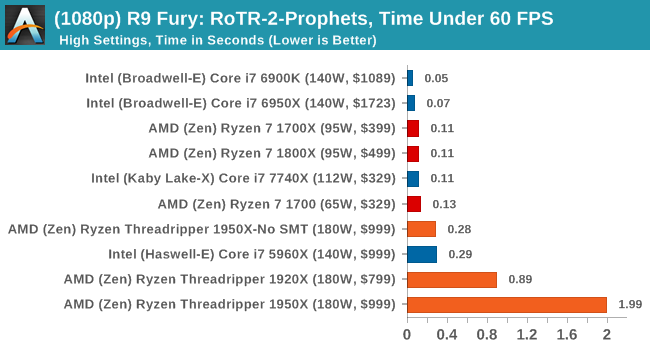
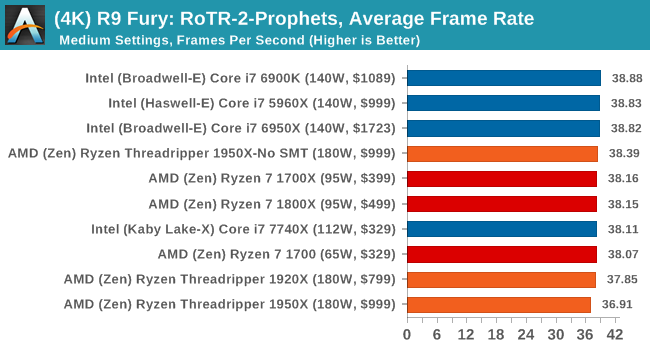
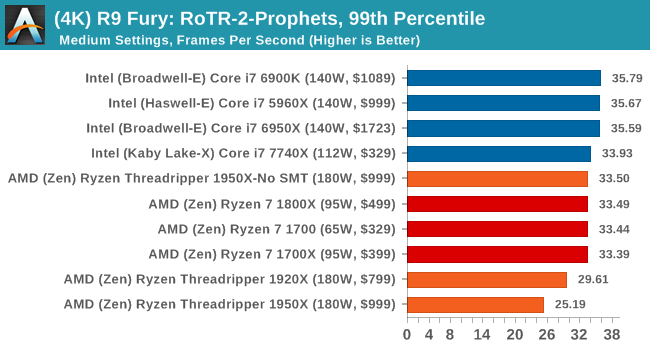
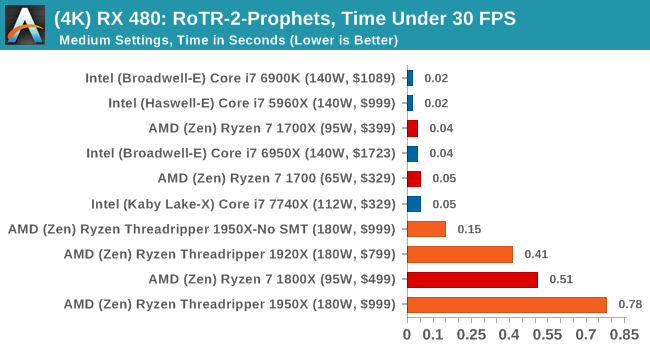
#2 Prophet’s Tomb

MSI GTX 1080 Gaming 8G Performance
1080p
4K
ASUS GTX 1060 Strix 6G Performance
1080p
4K
Sapphire Nitro R9 Fury 4G Performance
1080p
4K
Sapphire Nitro RX 480 8G Performance
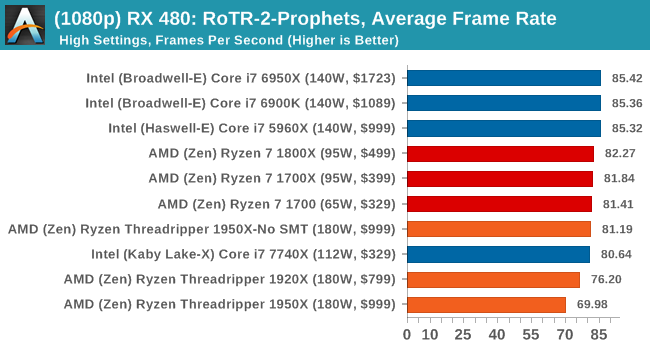
1080p
4K
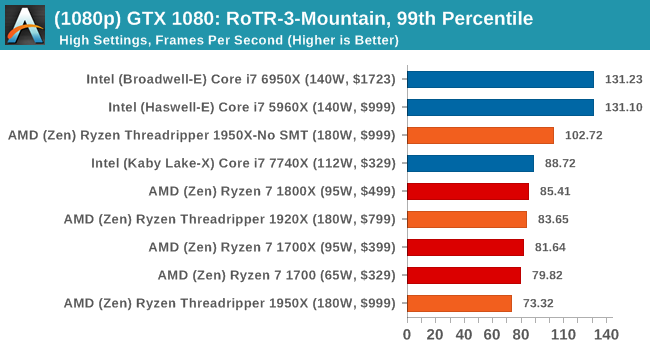
#3 Spine of the Mountain Geothermal Valley
MSI GTX 1080 Gaming 8G Performance
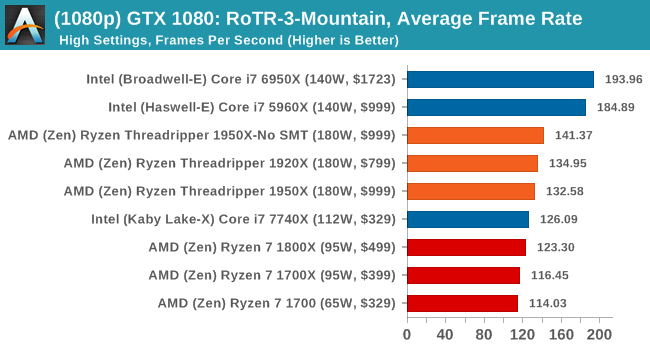
1080p
4K

ASUS GTX 1060 Strix 6G Performance
1080p
4K
Sapphire Nitro R9 Fury 4G Performance
1080p
4K
Sapphire Nitro RX 480 8G Performance
1080p
The 4K
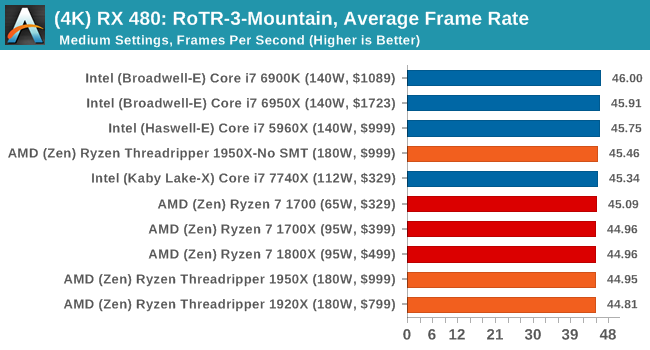
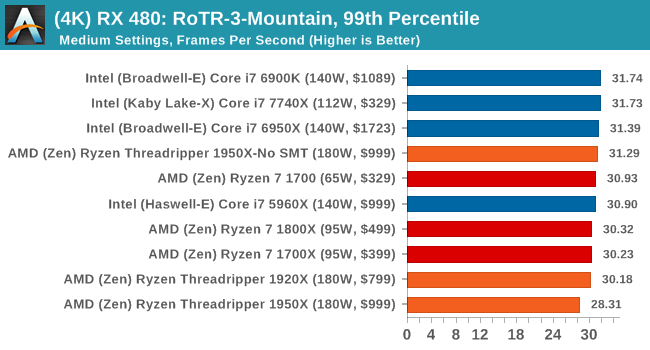
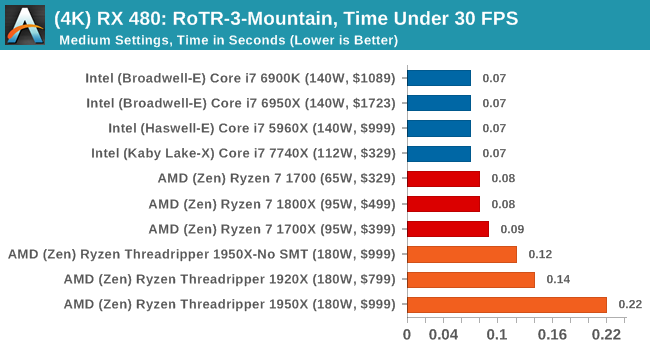
It's clear from these results that the 1950X is not the best gaming chip when in its default mode.


347 Comments
View All Comments
blublub - Sunday, August 13, 2017 - link
From what I have read is that all TR do 3.9hhz and some even 4-4.1ghz on all cores .What are your temp when running all 10c @4.6ghz prime for 1-2hrs
Zingam - Sunday, August 13, 2017 - link
Ian, how about testing mobile CPUs - for games and for office work. Aren't mobile CPUs selling much larger numbers thatn desktop ones these days?I can't find a single benchmark comparing i5-7300hq vs i7-7700hq vs i7-7700K showing the difference in productivity workloads and not just for rendering pretty pictures but also for more specific tasks as compiling software etc.
I also would like to see some sort of comparison of new generation to all generations upto 10 years back in time. I'd like to know how much did performance increase since the age of Nehelem. At least from now on there should be a single test to display the relative performance increase over the last few generations. The average user doesn't upgrade their PC every year. The average user maybe upgrades every 5 years and it is really difficult to find out how much peformance increase would one get with an upgrade.
SanX - Sunday, August 13, 2017 - link
I agree, there must be 5-7 years old processors in the chartsSanX - Sunday, August 13, 2017 - link
Why one core of Apple A10 costs $10 but one core of Intel 7900x costs 10x more?oranos - Sunday, August 13, 2017 - link
so its complete dogsh*t for the segment which is driving the PC market right now: gaming. got it.ballsystemlord - Sunday, August 13, 2017 - link
Hey Ian, you've been talking about anandtech's great database where we can see all the cool info. Well, according to your database the Phenom II 6 core 1090T is equally powerful when compared to the 16 core threadripper!!!!!!! http://www.anandtech.com/bench/product/1932?vs=146With those sorts of numbers why would anyone plan an upgrade?
(And there is also only one metric displayed, strange!)
Not to play the Intel card on you as others do, but this is a serious problem for at least the AMD lineup of processors.
jmelgaard - Monday, August 14, 2017 - link
o.O... I don't know how you derived that conclusion? you need a guide on how to read the database?...BurntMyBacon - Monday, August 14, 2017 - link
For anyone looking for an overall fps for two pass encoding here is your equation (hope my math is correct):FPS = 2*FPS1*FPS2/(FPS2+FPS1)
No, you can't just average the FPS scores from each pass as the processor will spend more time in the slower pass.
For the x264 encoding test, for example, a few relevant FPS scores end up being:
i9-7900X: 122.56
i7-7820X: 114.37
i7-6900K: 95.26
i7-7740X: 82.74
TR-1950X: 118.13
TR-1950X(g): 117.00
TR-1920X: 111.74
R7-1800X: 100.19
Since two pass encoding requires both passes to be usable, getting an overall FPS score seems somewhat relevant. Alternately, using time to completion is would present the same information in a different manner. Though, it would be difficult to extrapolate performance results to estimate performance in other encodes without also posting the number of frames encoded.
goldgrenade - Thursday, January 4, 2018 - link
Take all those Intel FPS performance counters and multiply them by .7 and you have what their chips actually run at without a major security flaw in them.Let's see that would be...
i9-7900X: 85.792
i7-7820X: 80.059
i7-6900K: 66.682
i7-7740X: 57.918
And that's at best. It can be up to 50% degradation when rendering or having to do many small file accesses or repeated operations with KAISER.
Gastec - Tuesday, August 15, 2017 - link
I've having a hard time trying to swallow "Threadripper is a consumer focused product" line considering the prices to "consume" it: $550 for the MB, $550 for the TR1900X ($800 or $1000 for the others is just dreaming) then the RAM. The MB(at least the Asus one) should be $200 less, but I get it, they are trying to squeeze as much as possible from the...consumers. Now don't get me wrong and I mean no offence for the rich ones among you, but those CPU are for Workstations. WORK, not gamestations. Meaning you would need them to help you make your money, faster.