The AMD Ryzen Threadripper 1950X and 1920X Review: CPUs on Steroids
by Ian Cutress on August 10, 2017 9:00 AM ESTCPU Legacy Tests
Our legacy tests represent benchmarks that were once at the height of their time. Some of these are industry standard synthetics, and we have data going back over 10 years. All of the data here has been rerun on Windows 10, and we plan to go back several generations of components to see how performance has evolved.
All of our benchmark results can also be found in our benchmark engine, Bench.
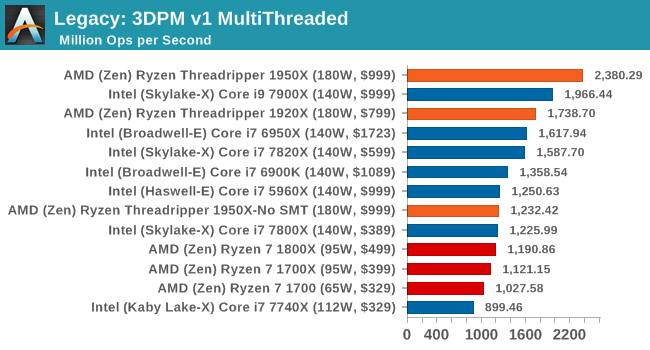
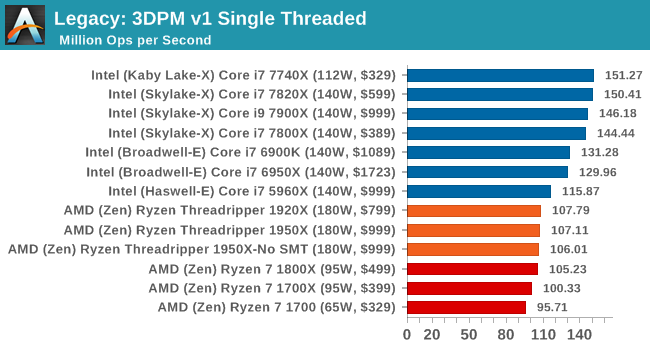
3D Particle Movement v1
3DPM is a self-penned benchmark, taking basic 3D movement algorithms used in Brownian Motion simulations and testing them for speed. High floating point performance, MHz and IPC wins in the single thread version, whereas the multithread version has to handle the threads and loves more cores. This is the original version, written in the style of a typical non-computer science student coding up an algorithm for their theoretical problem, and comes without any non-obvious optimizations not already performed by the compiler, such as false sharing.
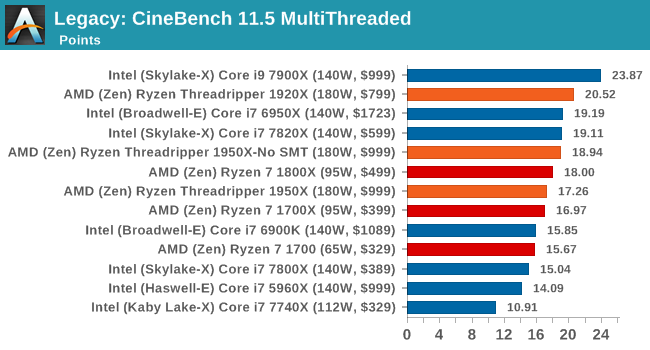
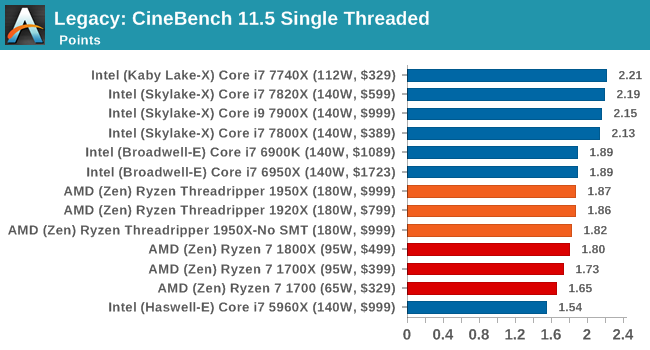
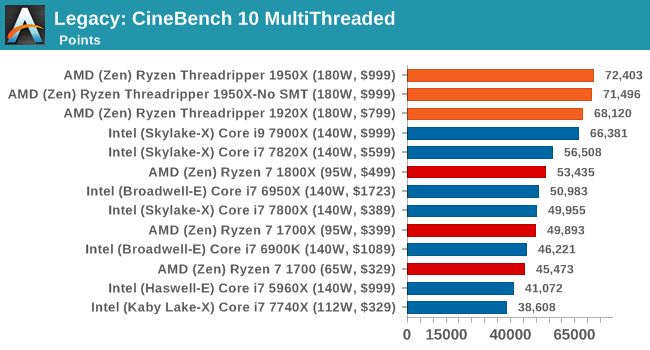
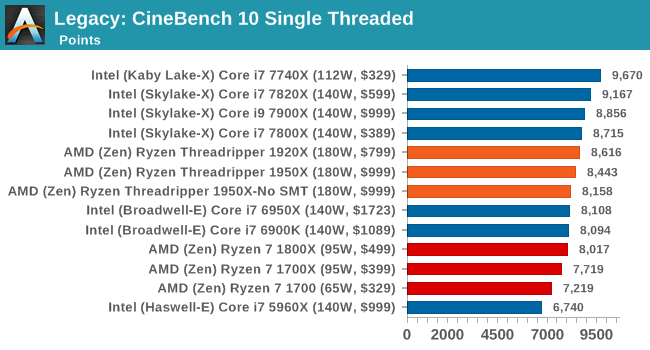
CineBench 11.5 and 10
Cinebench is a widely known benchmarking tool for measuring performance relative to MAXON's animation software Cinema 4D. Cinebench has been optimized over a decade and focuses on purely CPU horsepower, meaning if there is a discrepancy in pure throughput characteristics, Cinebench is likely to show that discrepancy. Arguably other software doesn't make use of all the tools available, so the real world relevance might purely be academic, but given our large database of data for Cinebench it seems difficult to ignore a small five minute test. We run the modern version 15 in this test, as well as the older 11.5 and 10 due to our back data.
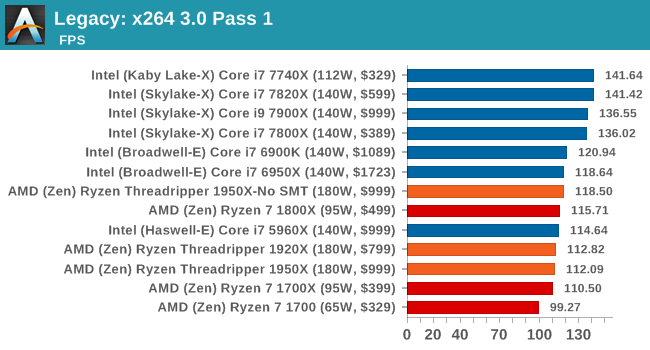
x264 HD 3.0
Similarly, the x264 HD 3.0 package we use here is also kept for historic regressional data. The latest version is 5.0.1, and encodes a 1080p video clip into a high-quality x264 file. Version 3.0 only performs the same test on a 720p file, and in most circumstances the software performance hits its limit on high-end processors, but still works well for mainstream and low-end. Also, this version only takes a few minutes, whereas the latest can take over 90 minutes to run.
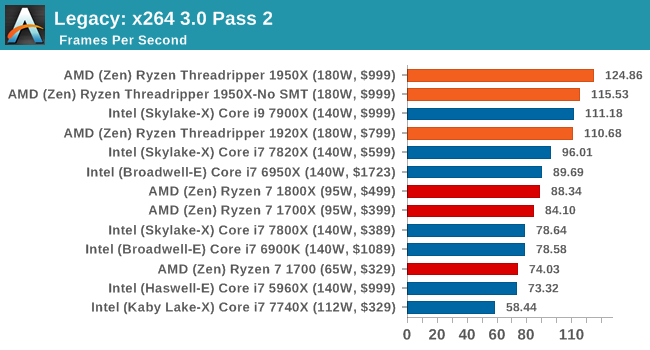
The 1950X: the first CPU to score higher on the 2nd pass of this test than it does on the first pass.


347 Comments
View All Comments
coolhardware - Saturday, August 12, 2017 - link
Hi B3an, what will you primarily be using your 1950X for?I do not really have the workload to justify that CPU, but I wish I did ;-)
Mugur - Sunday, August 13, 2017 - link
I suggest you to read other TR reviews. Some were testing GPU rendering and they show that even in this case you need the best cpu you can get.minde - Saturday, August 12, 2017 - link
i see in foto on amd processor MADE IN CHINA . without comment. what differencebetween intel and amd quality , class
mr_tawan - Saturday, August 12, 2017 - link
TSMC perhaps?tuxRoller - Saturday, August 12, 2017 - link
I'm very curious as to how this will perform with smt enabled and numa being exposed.franzeal - Saturday, August 12, 2017 - link
On page 1, does Ryzen use an AMD implementation of SMT or hyper-threading (i.e. licensed from Intel). I've been under the impression it's the former, and referring to SMT as hyper-threading in this instance is incorrect. Intel's was not the first or the only way to implement SMT.Oxford Guy - Saturday, August 12, 2017 - link
When you went with 2400 speed RAM to slow down TR you forgot to make it single channel.franzeal - Saturday, August 12, 2017 - link
Error in Dolphin benchmark description: "Results are given in minutes, where the Wii itself scores 17.53 minutes." should be results are given in seconds.franzeal - Saturday, August 12, 2017 - link
On the last page it states "On the side of the 1920X, users will again see more cores, ECC support, and over double the number of PCIe lanes compared to the Core i7-7820X for $100 difference."According to the accompanying chart it's a ~$200 difference. Either the chart is wrong or that statement.
quadi9 - Saturday, August 12, 2017 - link
I picked up an I9-7900x at a local Micro Center for $899 this week. And it is running stable at 4.6 GHZ. How well does the Ryzen overclock? My Blender BMW score was 181 seconds. Just opened the file and clicked Render.