The AMD Ryzen Threadripper 1950X and 1920X Review: CPUs on Steroids
by Ian Cutress on August 10, 2017 9:00 AM ESTRise of the Tomb Raider (1080p, 4K)
One of the newest games in the gaming benchmark suite is Rise of the Tomb Raider (RoTR), developed by Crystal Dynamics, and the sequel to the popular Tomb Raider which was loved for its automated benchmark mode. But don’t let that fool you: the benchmark mode in RoTR is very much different this time around.
Visually, the previous Tomb Raider pushed realism to the limits with features such as TressFX, and the new RoTR goes one stage further when it comes to graphics fidelity. This leads to an interesting set of requirements in hardware: some sections of the game are typically GPU limited, whereas others with a lot of long-range physics can be CPU limited, depending on how the driver can translate the DirectX 12 workload.
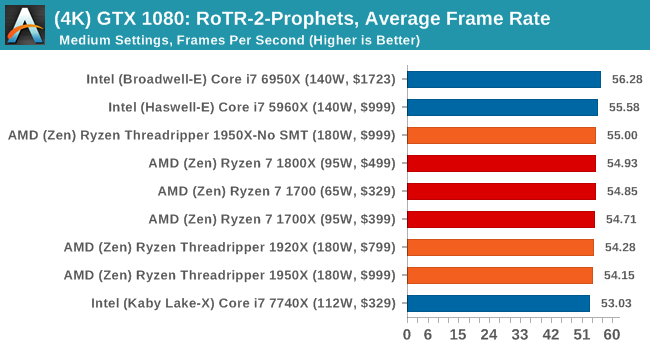
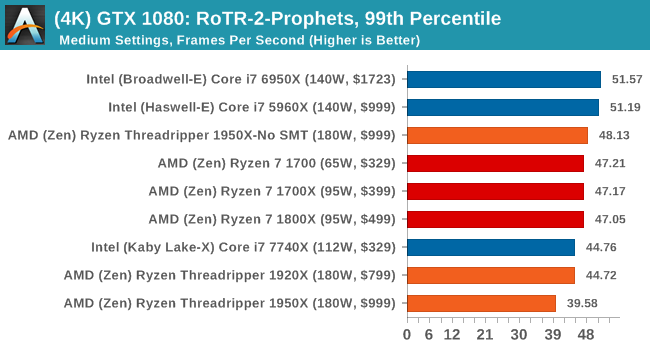
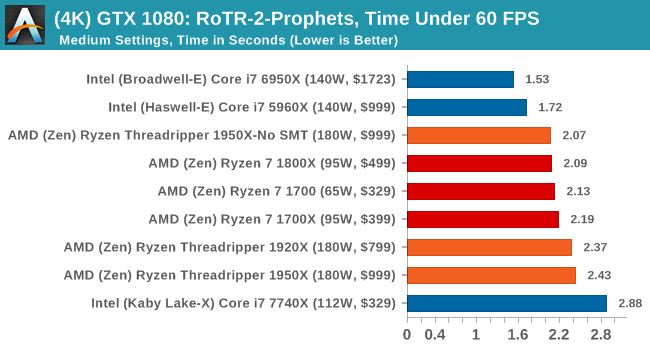
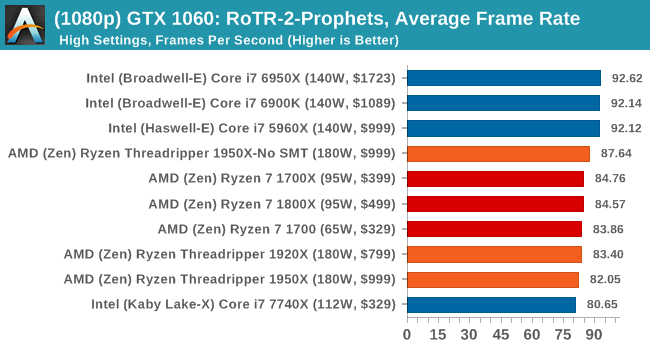
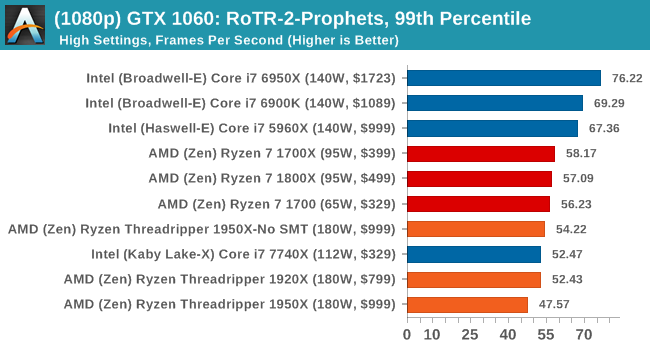
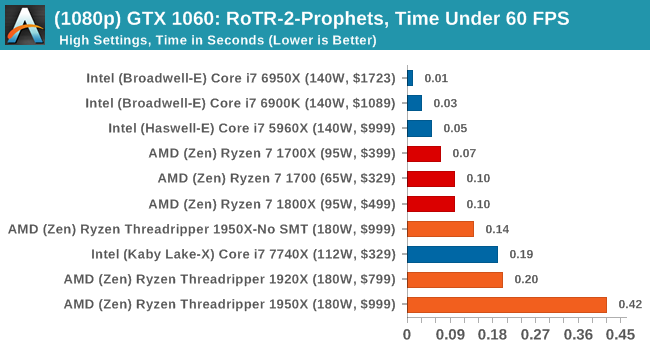
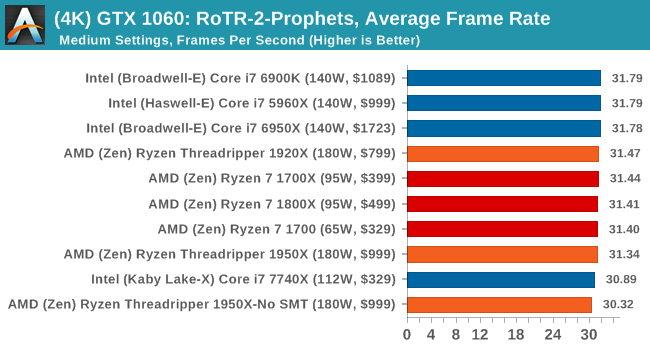
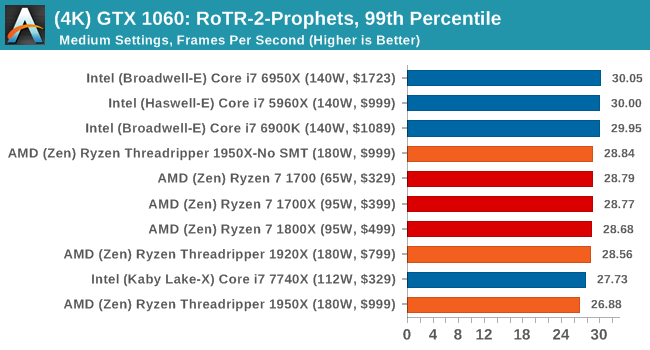
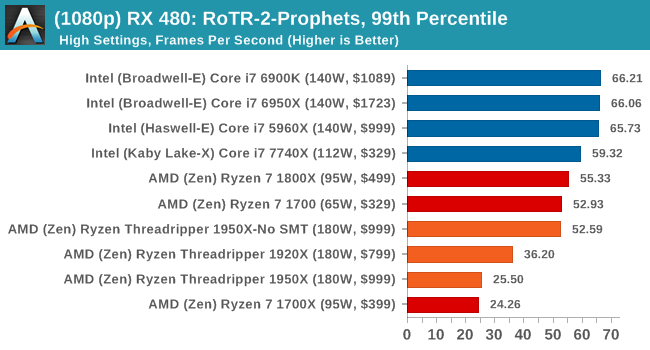
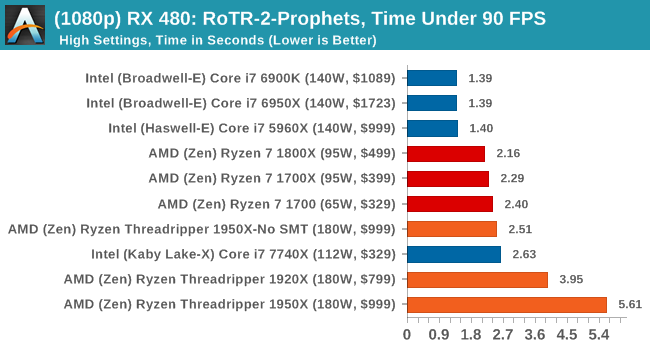
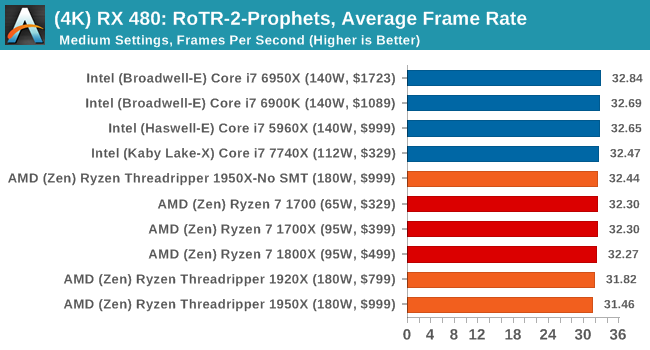
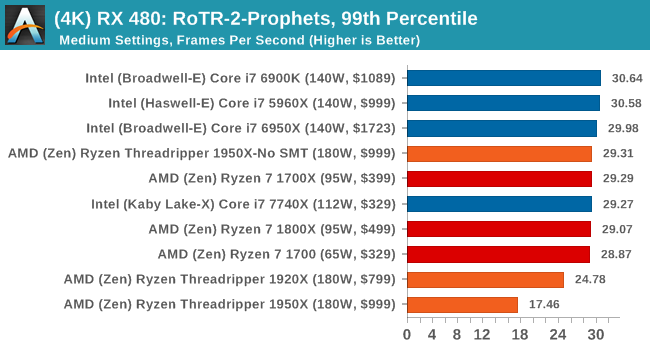
Where the old game had one benchmark scene, the new game has three different scenes with different requirements: Spine of the Mountain (1-Valley), Prophet’s Tomb (2-Prophet) and Geothermal Valley (3-Mountain) - and we test all three (and yes, I need to relabel them - I got them wrong when I set up the tests). These are three scenes designed to be taken from the game, but it has been noted that scenes like 2-Prophet shown in the benchmark can be the most CPU limited elements of that entire level, and the scene shown is only a small portion of that level. Because of this, we report the results for each scene on each graphics card separately.
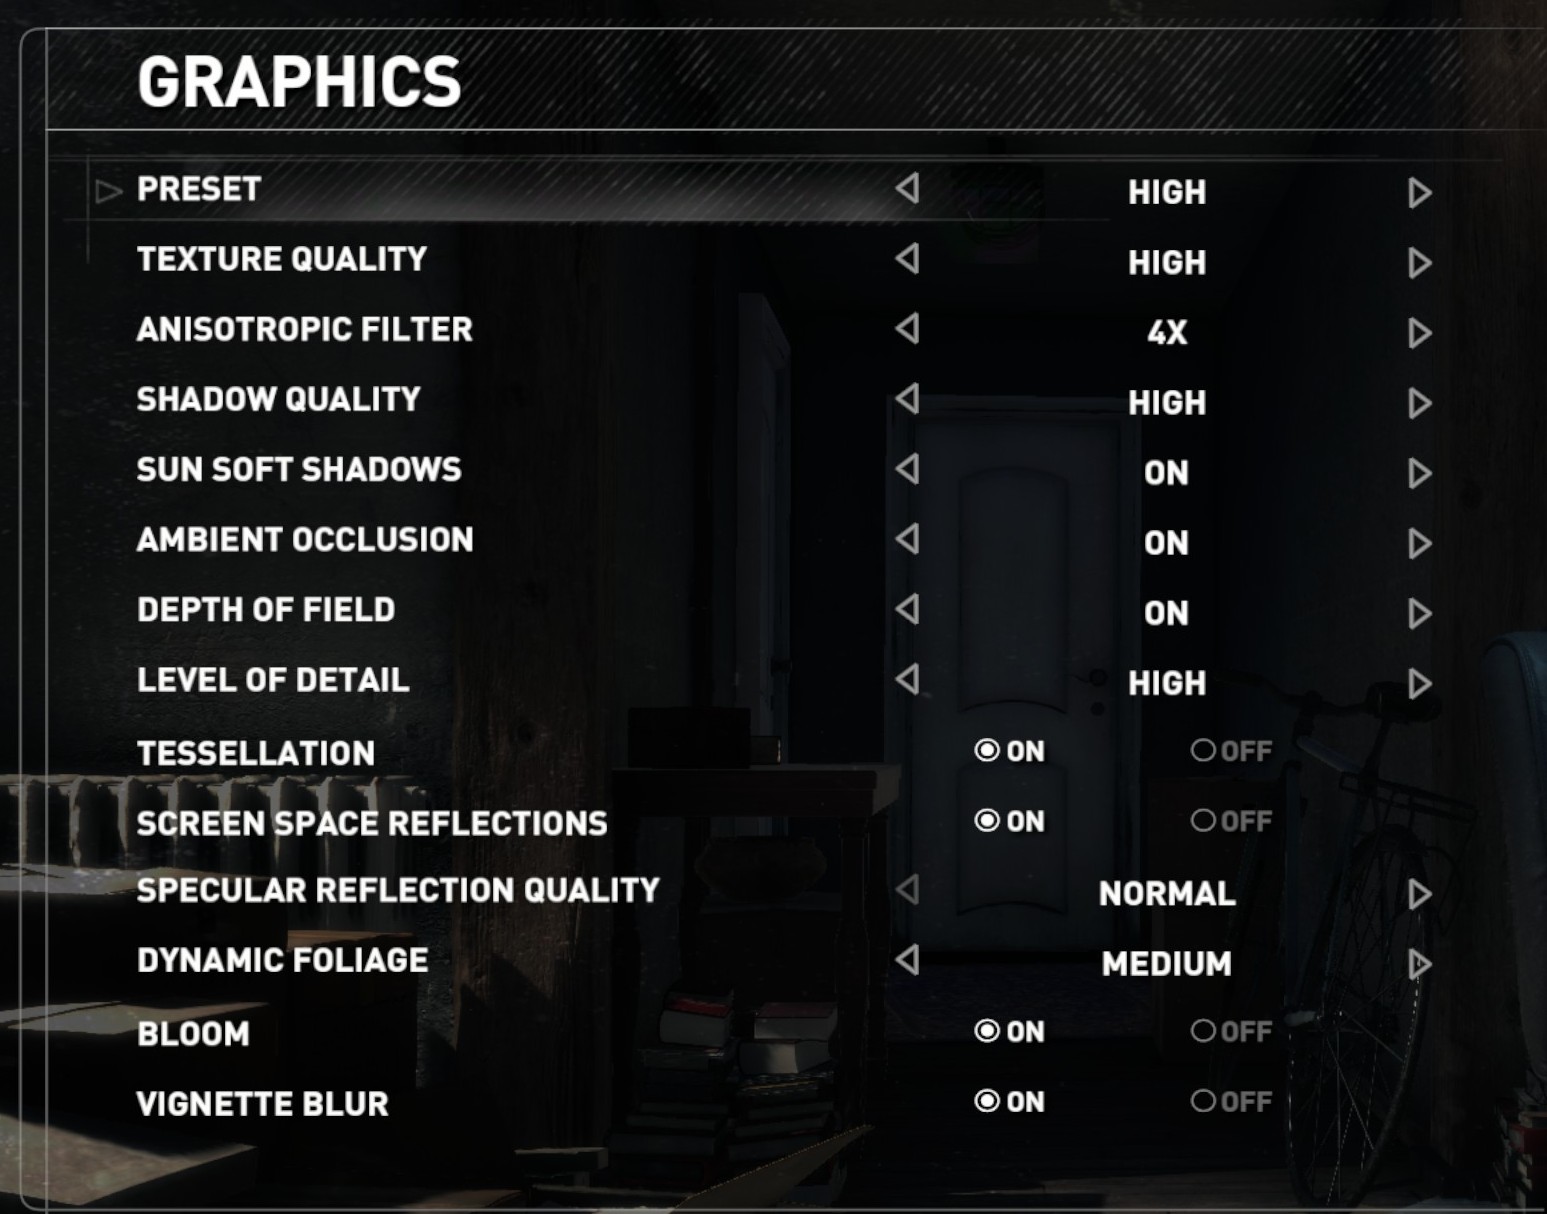
Graphics options for RoTR are similar to other games in this type, offering some presets or allowing the user to configure texture quality, anisotropic filter levels, shadow quality, soft shadows, occlusion, depth of field, tessellation, reflections, foliage, bloom, and features like PureHair which updates on TressFX in the previous game.
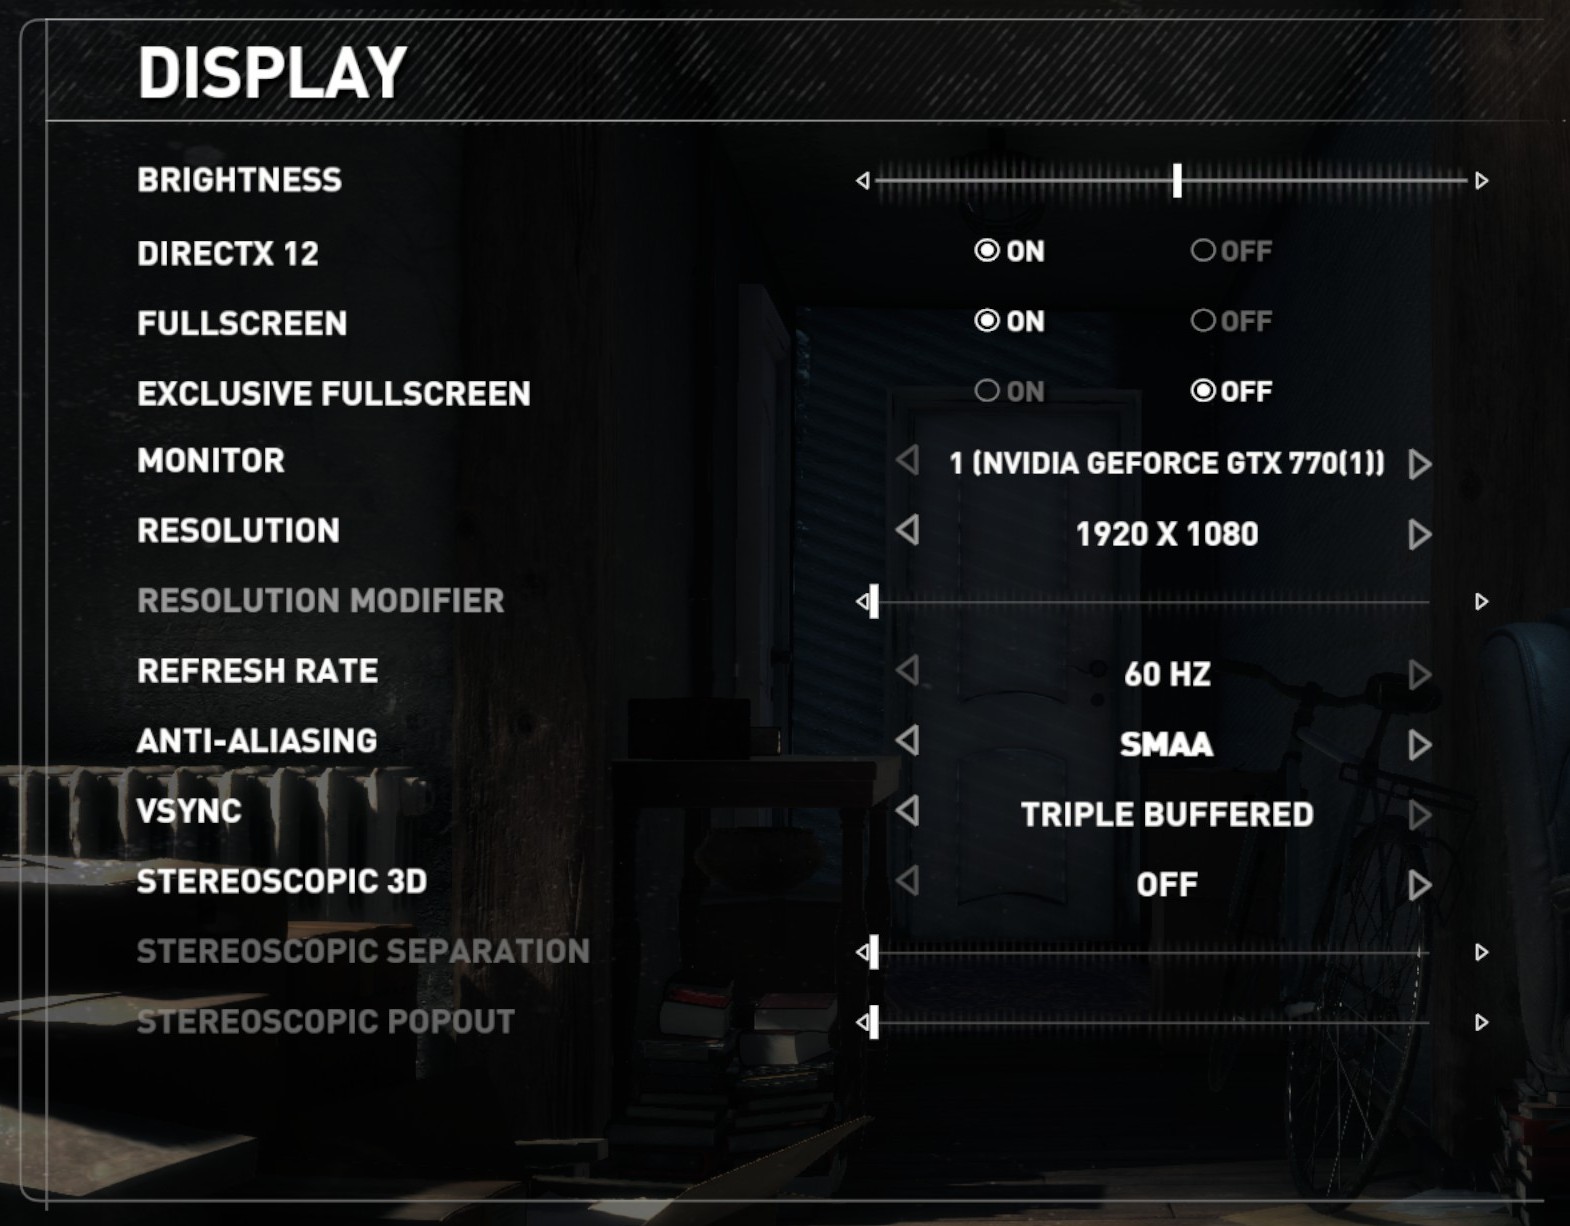
Again, we test at 1920x1080 and 4K using our native 4K displays. At 1080p we run the High preset, while at 4K we use the Medium preset which still takes a sizable hit in frame rate.
It is worth noting that RoTR is a little different to our other benchmarks in that it keeps its graphics settings in the registry rather than a standard ini file, and unlike the previous TR game the benchmark cannot be called from the command-line. Nonetheless we scripted around these issues to automate the benchmark four times and parse the results. From the frame time data, we report the averages, 99th percentiles, and our time under analysis.
All of our benchmark results can also be found in our benchmark engine, Bench.
#1 Geothermal Valley Spine of the Mountain

MSI GTX 1080 Gaming 8G Performance
1080p
4K
ASUS GTX 1060 Strix 6G Performance
1080p
4K
Sapphire Nitro R9 Fury 4G Performance
1080p

4K
Sapphire Nitro RX 480 8G Performance
1080p
4K

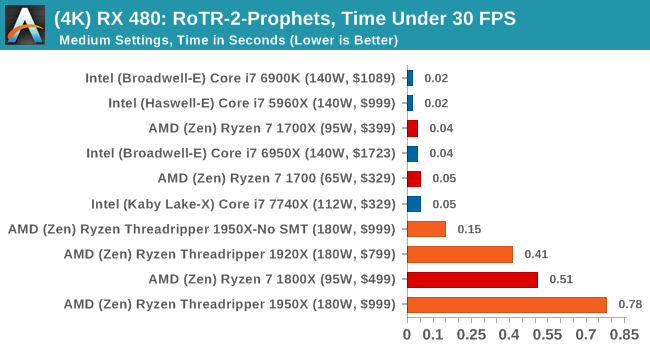
#2 Prophet’s Tomb

MSI GTX 1080 Gaming 8G Performance
1080p
4K
ASUS GTX 1060 Strix 6G Performance
1080p
4K
Sapphire Nitro R9 Fury 4G Performance
1080p
4K
Sapphire Nitro RX 480 8G Performance
1080p
4K
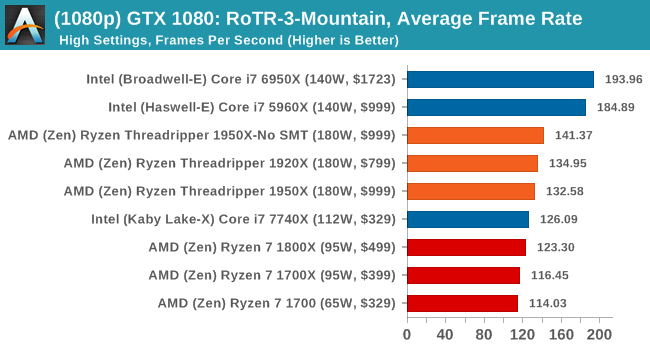
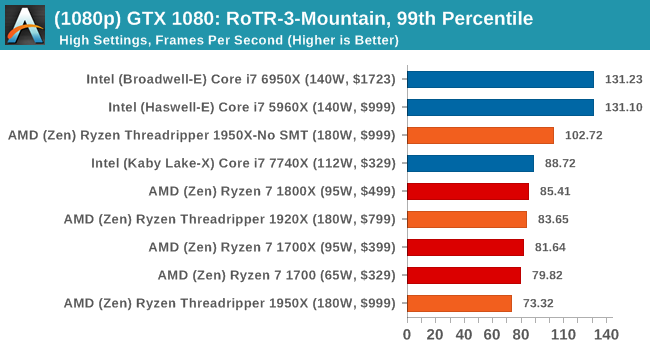
#3 Spine of the Mountain Geothermal Valley
MSI GTX 1080 Gaming 8G Performance
1080p
4K

ASUS GTX 1060 Strix 6G Performance
1080p
4K
Sapphire Nitro R9 Fury 4G Performance
1080p
4K
Sapphire Nitro RX 480 8G Performance
1080p
The 4K
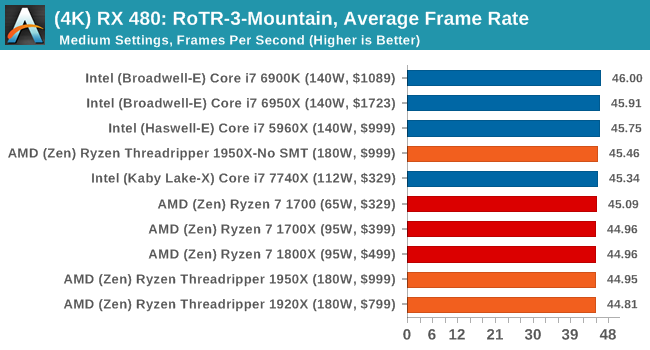
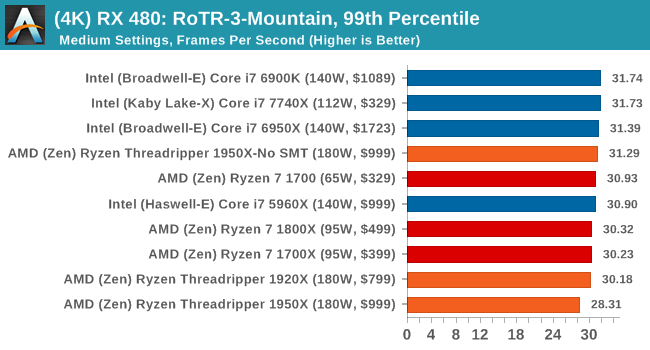
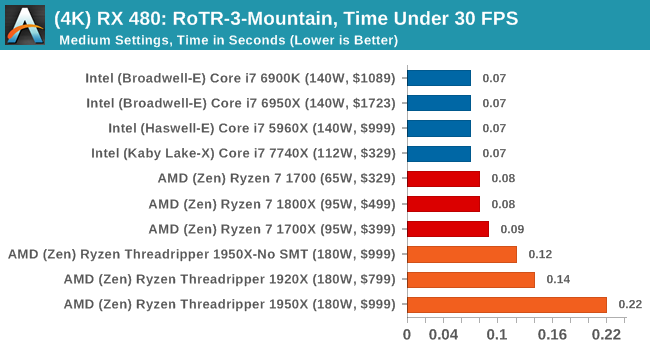
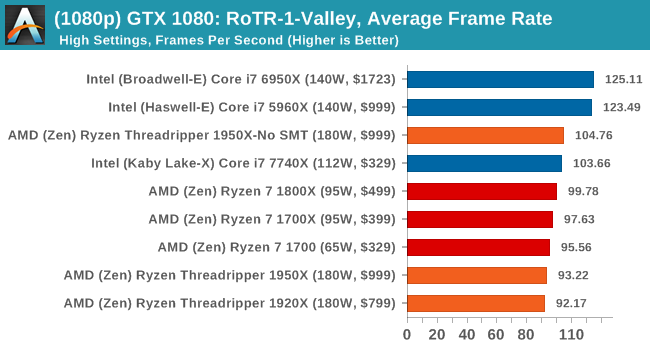
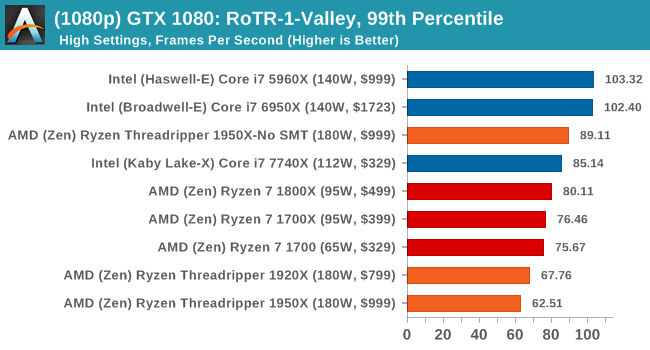
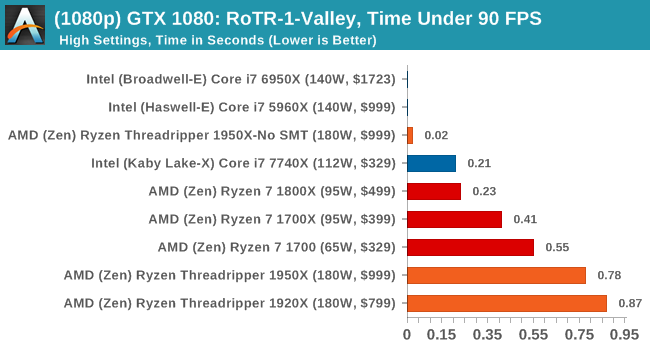
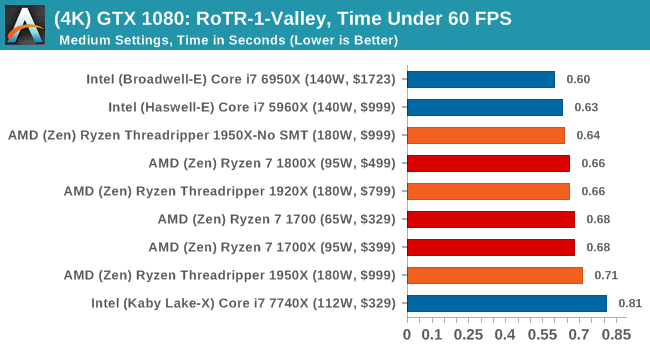
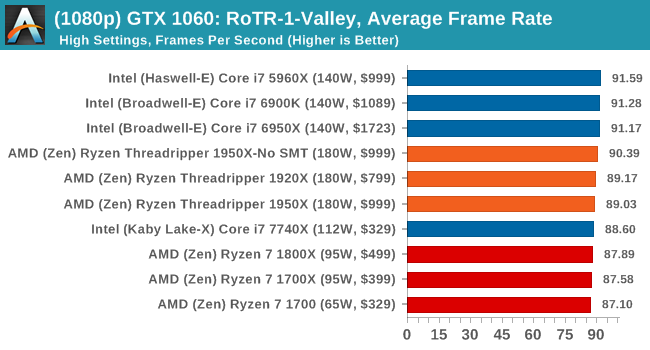
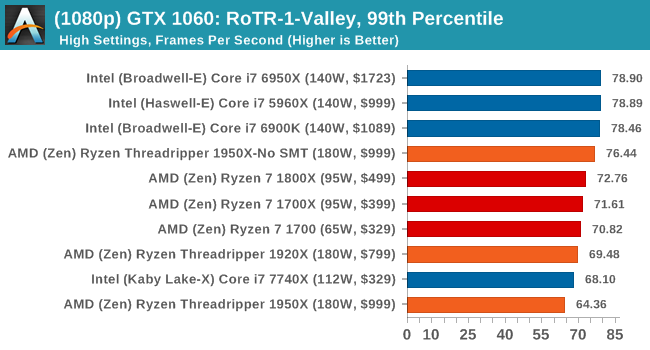
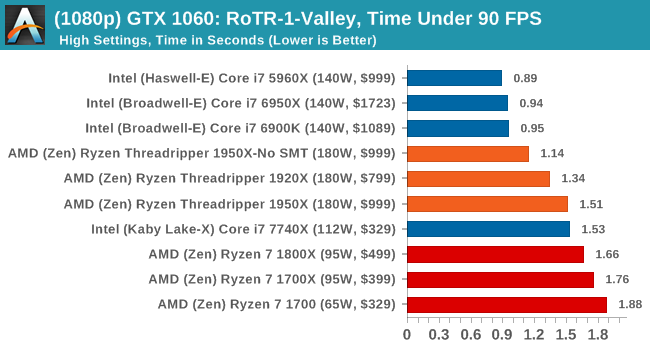
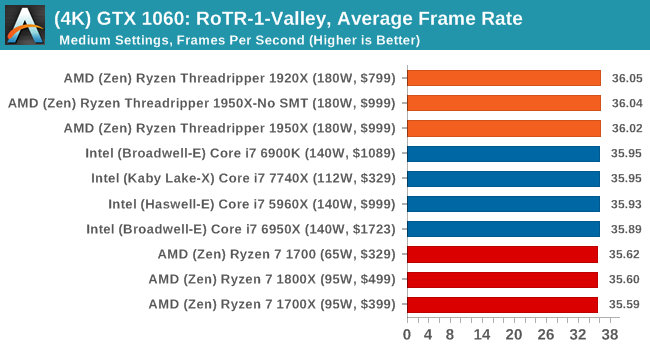
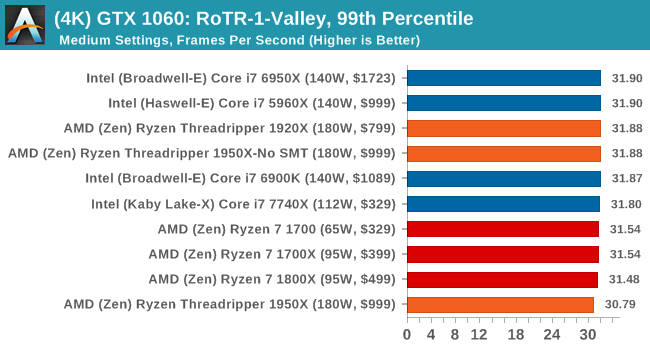
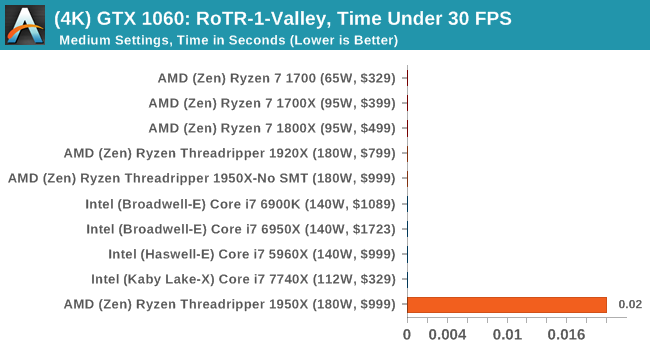
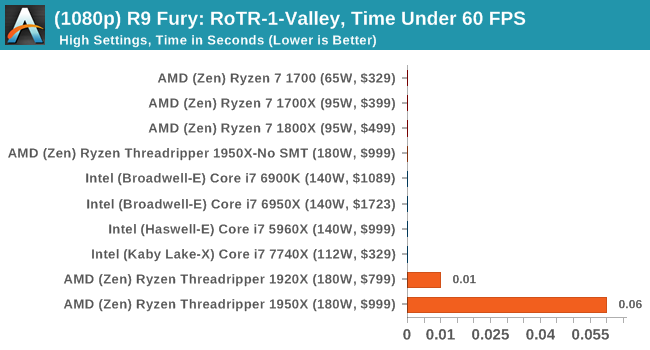
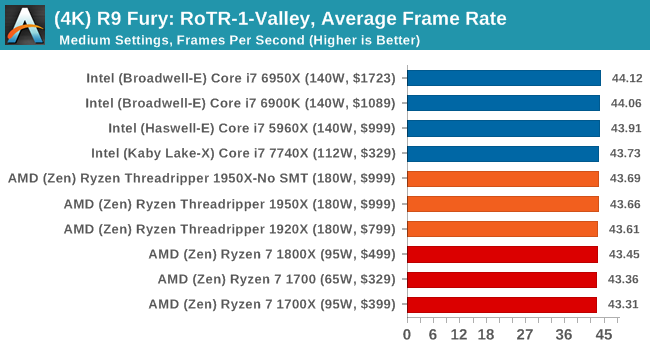
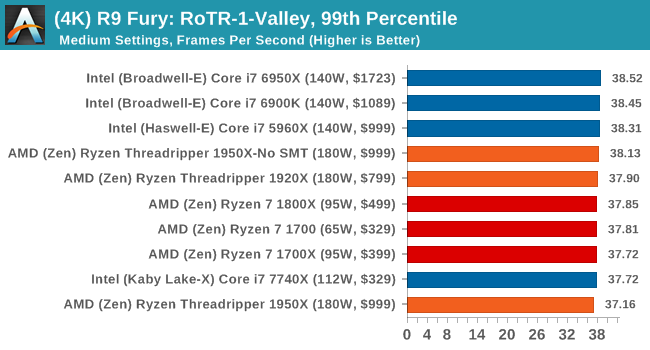
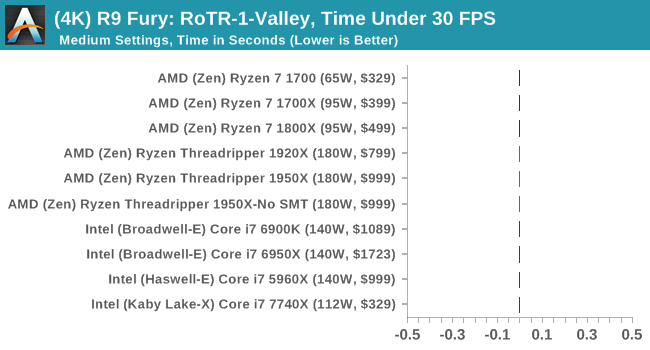
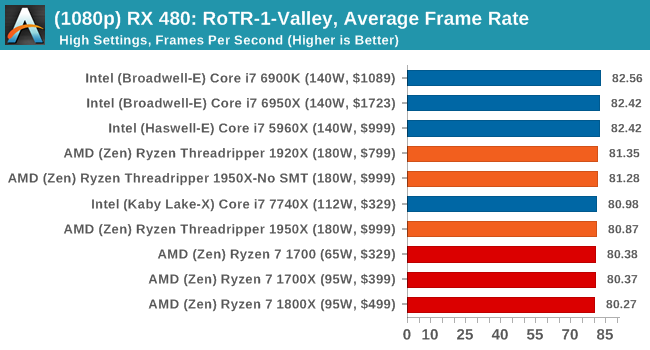
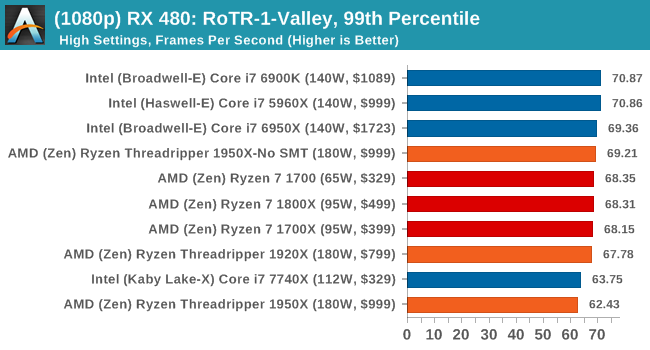
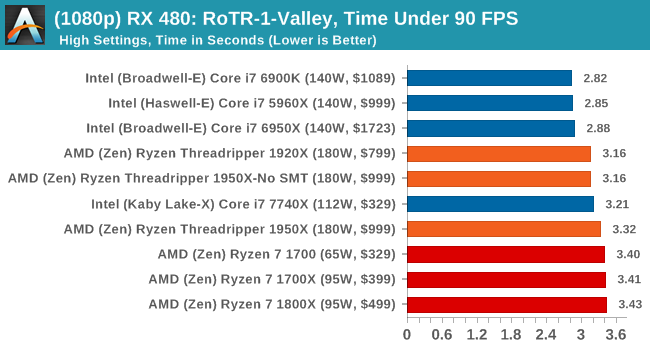
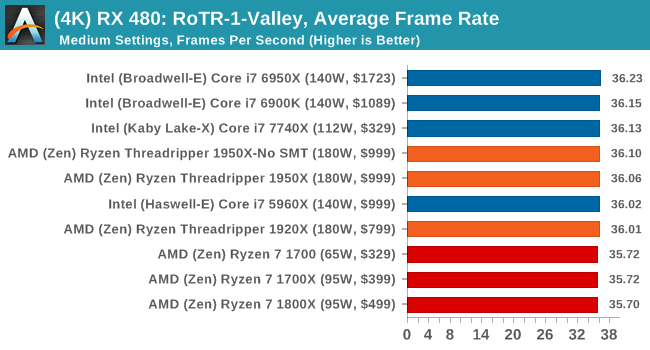
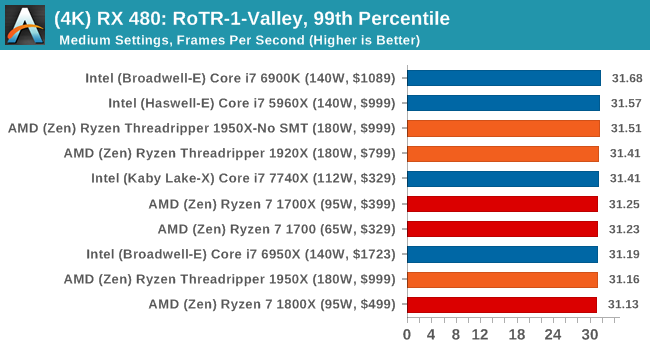
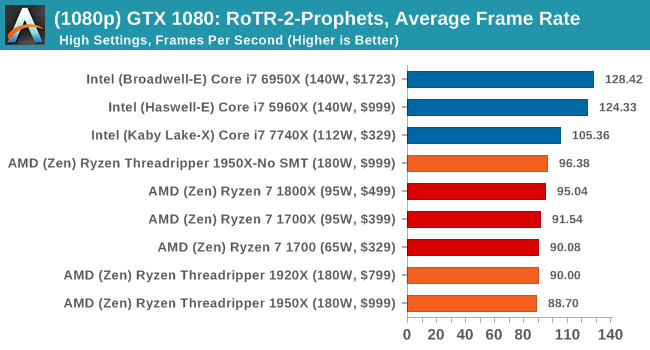
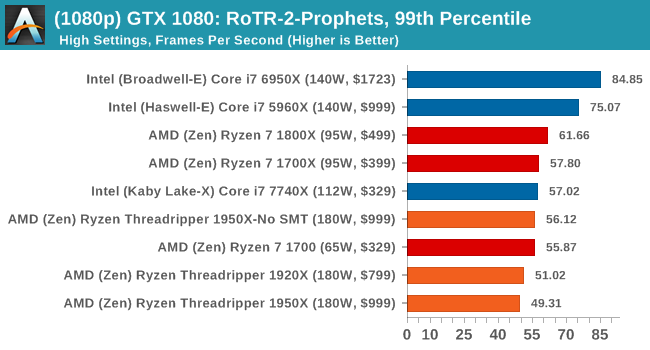
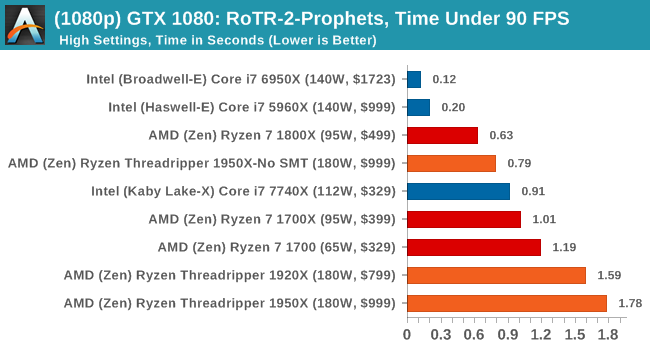
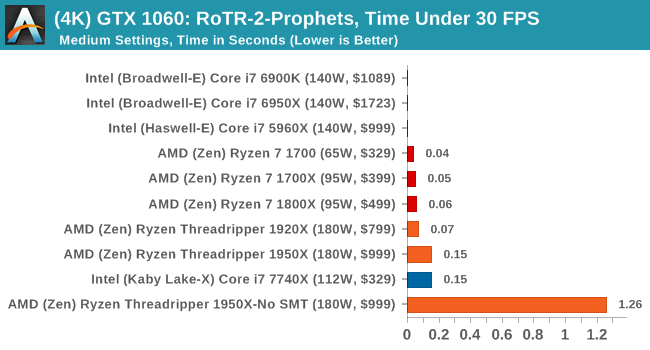
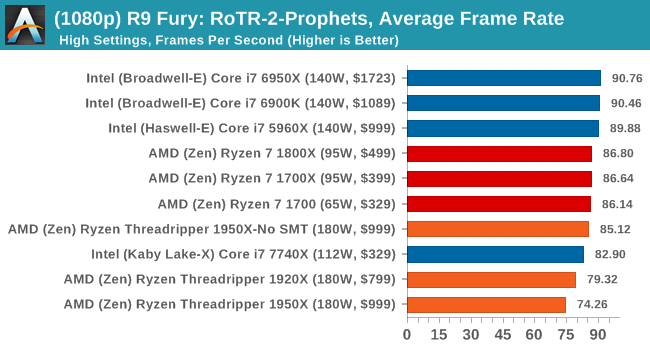
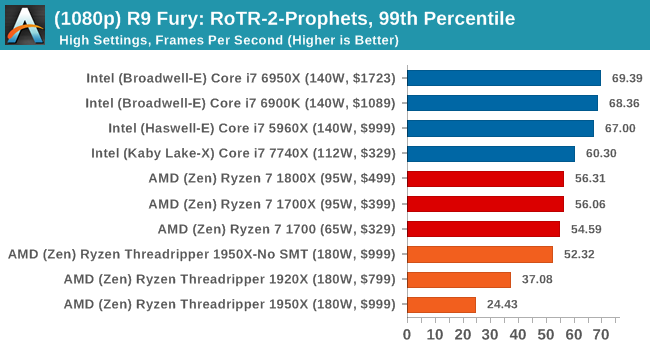
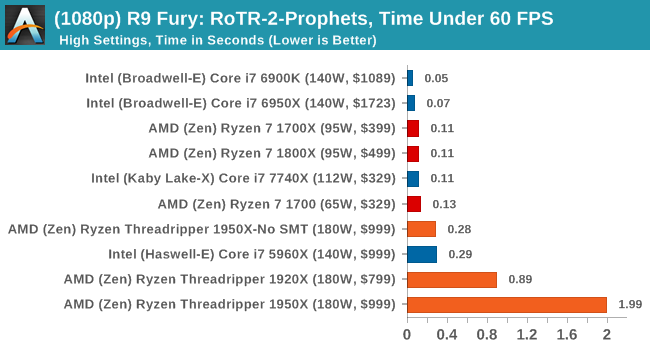
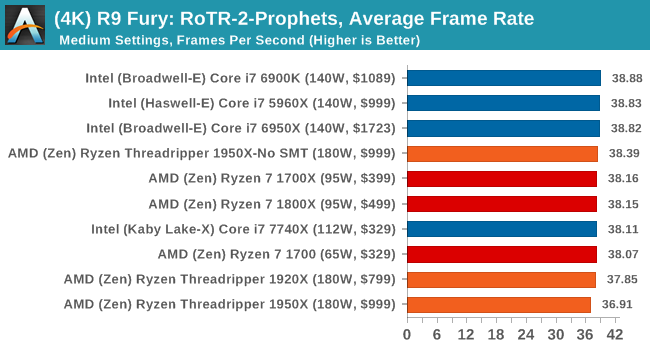
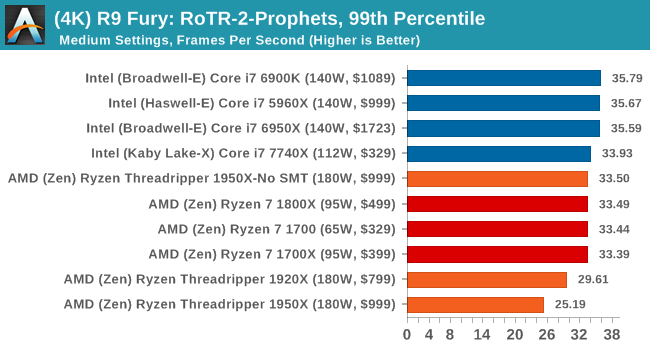
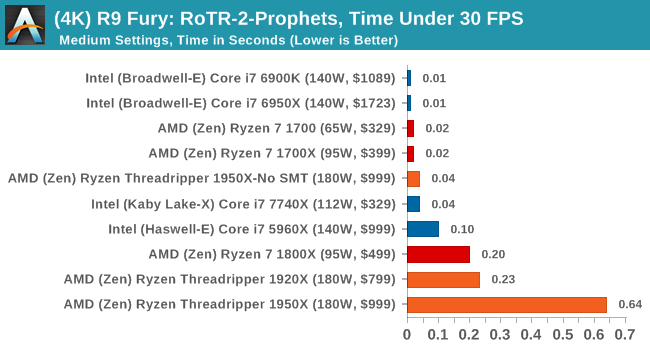
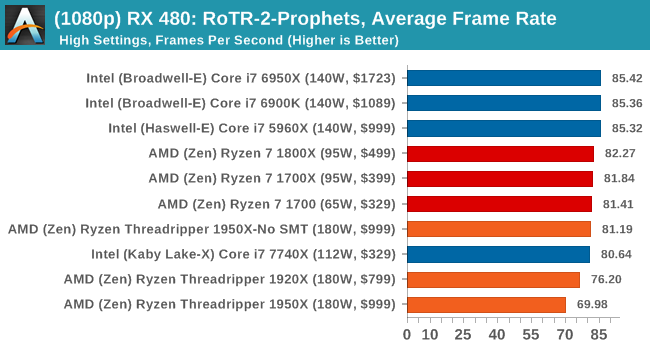
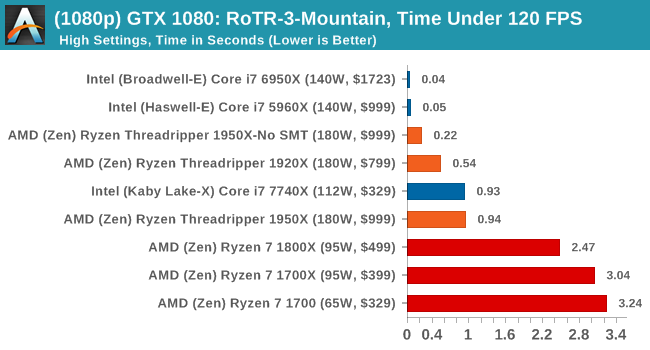
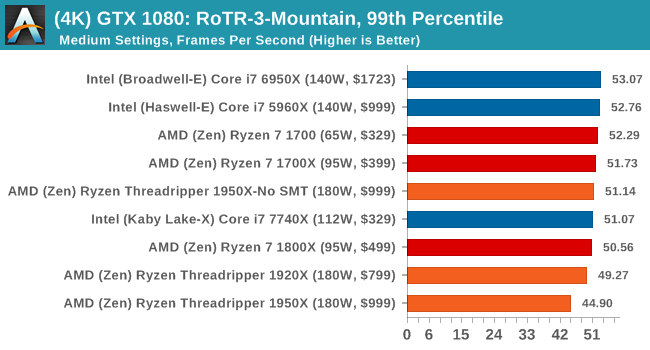
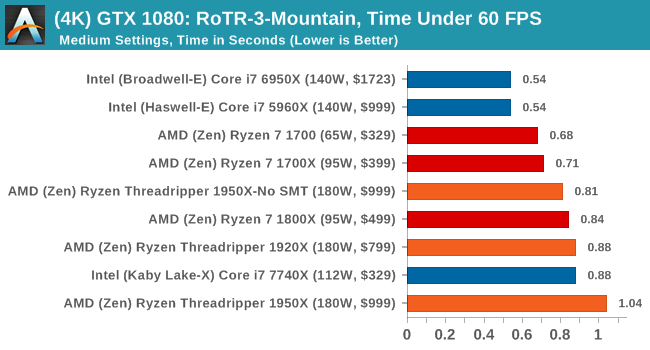
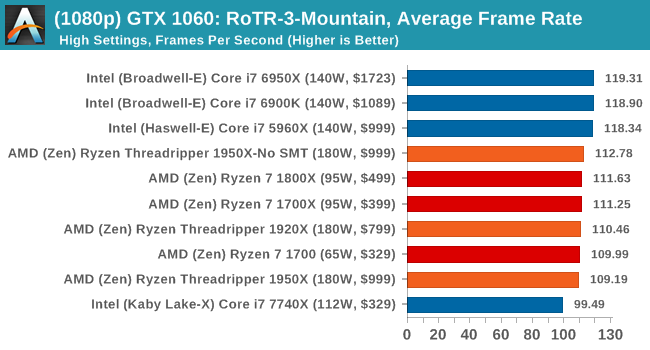
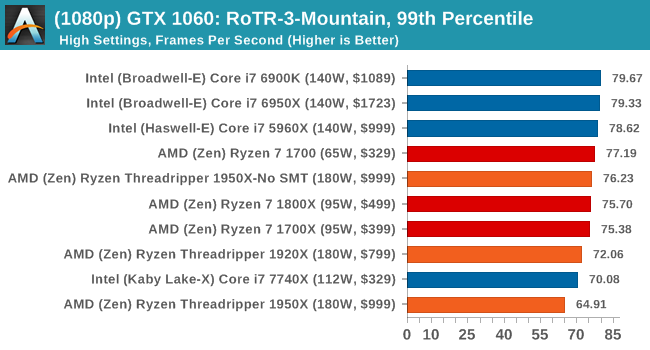
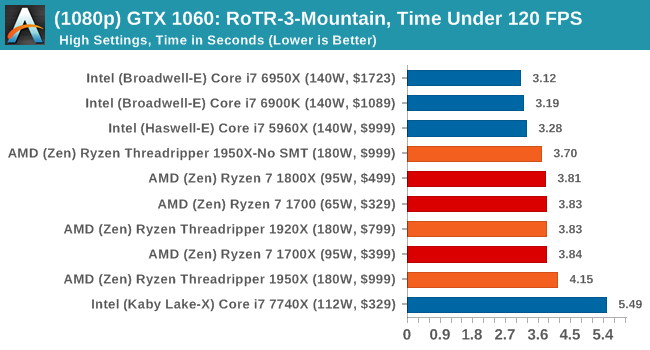
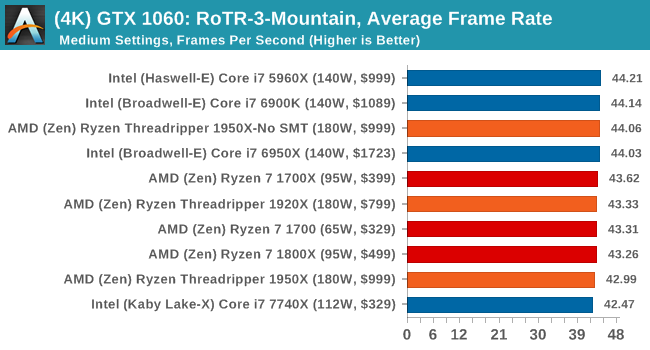
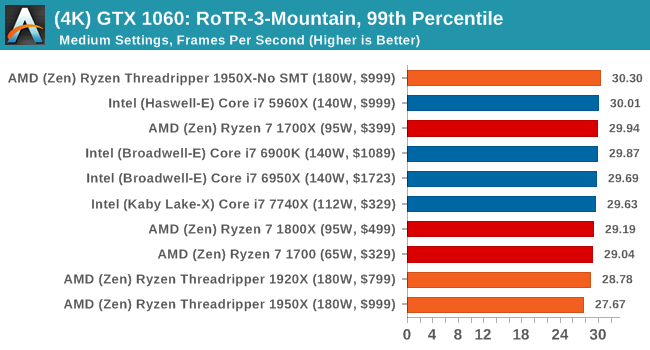
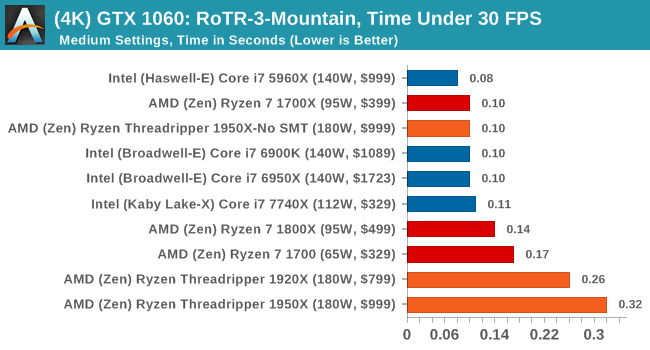
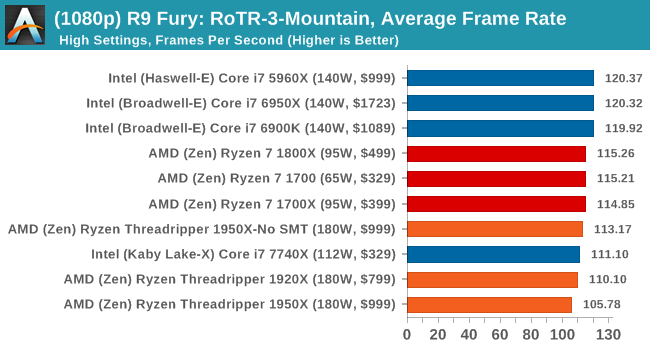
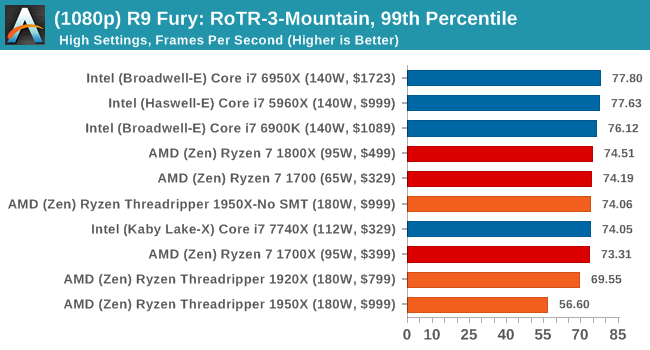
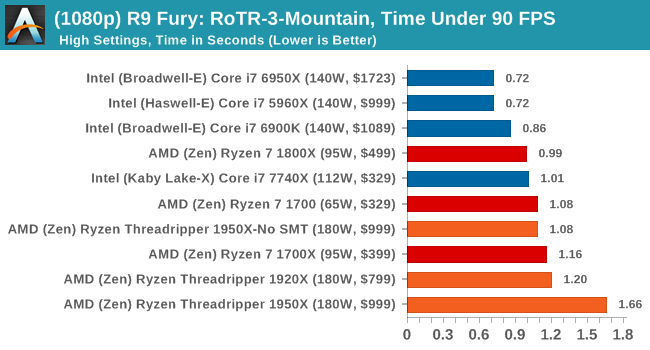
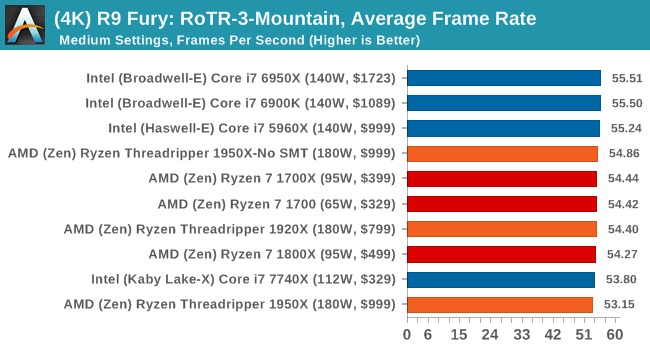
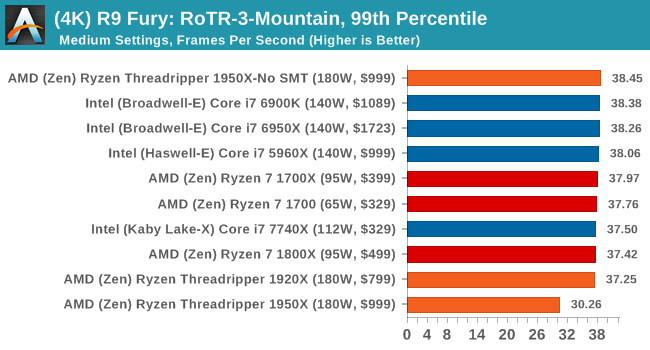
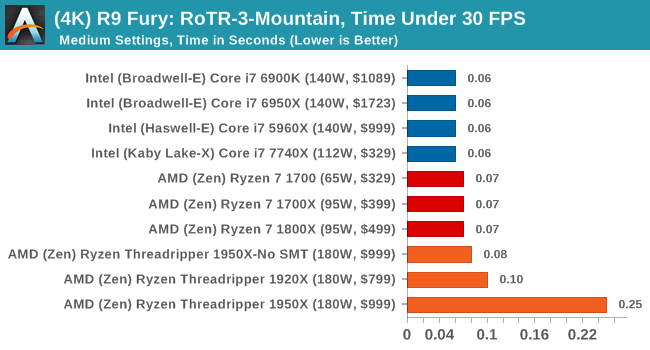
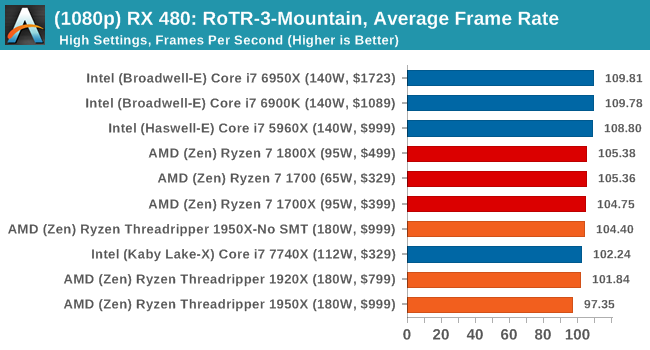
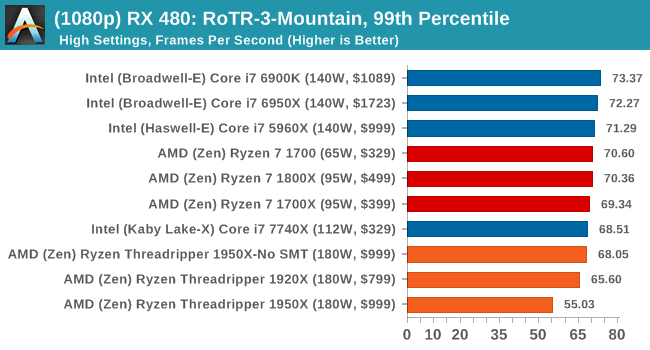
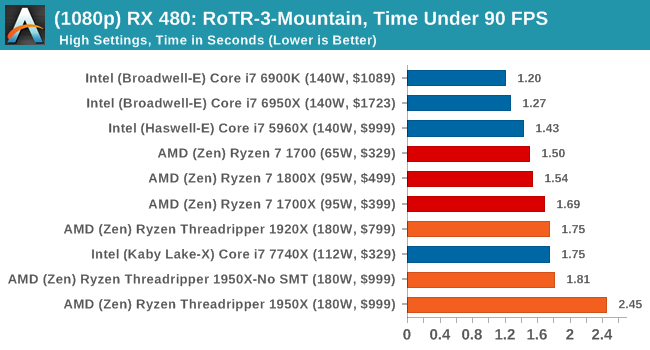
It's clear from these results that the 1950X is not the best gaming chip when in its default mode.


347 Comments
View All Comments
Pekish79 - Friday, August 11, 2017 - link
Vraybench 1.0.5SanX - Friday, August 11, 2017 - link
*** AMD, make 2-chip mobos for upcoming multicore wars, you will double your profit from this at no cost for you +++vicbee - Friday, August 11, 2017 - link
Off subject: Having just read the article about nVidia's meteoric rise in profits, some of which directly attributed to high end "gamers" video cards purchased expressly for coin mining, I wonder if it and AMD are going to manufacture CPU's and GPU's specifically for that purpose and how that will affect the price of said parts...Avro Arrow - Friday, August 11, 2017 - link
Hi Ian, thanks for doing this article. It's important to see all possible outcomes because in the real world, anything is possible. I do have one question that has be puzzled. Why do you say that Threadripper only has 64 PCI-Express 3.0 lanes when it's been reported several times by everyone, including official AMD releases (and also including by you) that it has 64? I thought it might be just a typo but you state it in several places and in all of your specs. This is not a new thing so is there something about Threadripper that we don't know?HotJob - Friday, August 11, 2017 - link
Could someone explain to me what a "2P" system is from the competition section of the article?coolhardware - Saturday, August 12, 2017 - link
"2P" system = two processor system, i.e. a system with two physical CPU sockets and two CPUs installed.In the past a 2P (or 4P) system was really handy to get more cores especially back when 1 core, 2 core, and eventually 4 core CPUs were high end. In the consumer realm, way back, the Pentium II was the first 2P system I ever built and people even did it with Celerons as well:
http://www.cpu-central.com/dualceleron/
the Opterons were also fun for dual or quad processor systems including some SFF options like the ZMAX-DP socket 940 system.
https://www.newegg.com/Product/Product.aspx?Item=N...
Now fast forward with ThreadRipper already available at Amazon and NewEgg
http://amzn.to/2wDqgWw (URL shortened)
https://www.newegg.com/Product/Product.aspx?Item=N...
I do not think I will ever be building a 2P or 4P system again!!!
:-)
rvborgh - Friday, August 11, 2017 - link
hi Ian,i think the Cinebench 11.5 benchmarks are incorrect for both ThreadRippers. ThreadRipper is almost equivalent to my Quad Opteron (48 core) system which scores 3229cb on R15... and 39.04 on Cinebench 11.5. if i downclock all cores to approximately 2.9 GHz i end up with around 3000cb in R15 and in the 36 range point range for 11.5.
The fact that you are only scoring in the 18 range makes me wonder if you had the Threadripper set in some mode where it was only using 8 out of the 16 cores. Can you verify this... please? Thanks :) i would think you should see scores in the 36 range with 11.5.
Other than this minor detail... great article.
PS: i've had the same issues with software not liking NUMA on my quad opteron system as well... Cinebench especially does not like it.
Tchamber - Saturday, August 12, 2017 - link
Hi, Ian. Thanks for the review. As usual it was in depth and informative. I'm in the middle of building a 1700x system now based on your review. I wanted to say you handle all the nay-Sayers, gloomy Gusses and negative Nacies with aplomb! I think most people's own slant colors how they see your reviews. I appreciate the consistency of what you do here. I took a look over at Ars, and they could be called AMD shills for all the positive things they say... Keep it up!Tchamber - Saturday, August 12, 2017 - link
P.S.I loved your Kessel Run reference, it tied in nicely with your Yoda quote.
B3an - Saturday, August 12, 2017 - link
Too many plebs complaining about a lack of 3D rendering benches. The fact is a 16 core CPU is still much slower than GPU's at rendering. I'll be getting a 1950X but it wont even be used for rendering when i know for a fact that my two GPUs will still be much faster with things like Blender. Even a single high-end GPU will still easily beat the 1950X at these tasks.Seems like immature moron fanboys are crying over this stuff because they just want to see AMD at the top of the charts.