The AMD Ryzen 3 1300X and Ryzen 3 1200 CPU Review: Zen on a Budget
by Ian Cutress on July 27, 2017 9:30 AM EST- Posted in
- CPUs
- AMD
- Zen
- Ryzen
- Ryzen 3
- Ryzen 3 1300X
- Ryzen 3 1200
Rise of the Tomb Raider
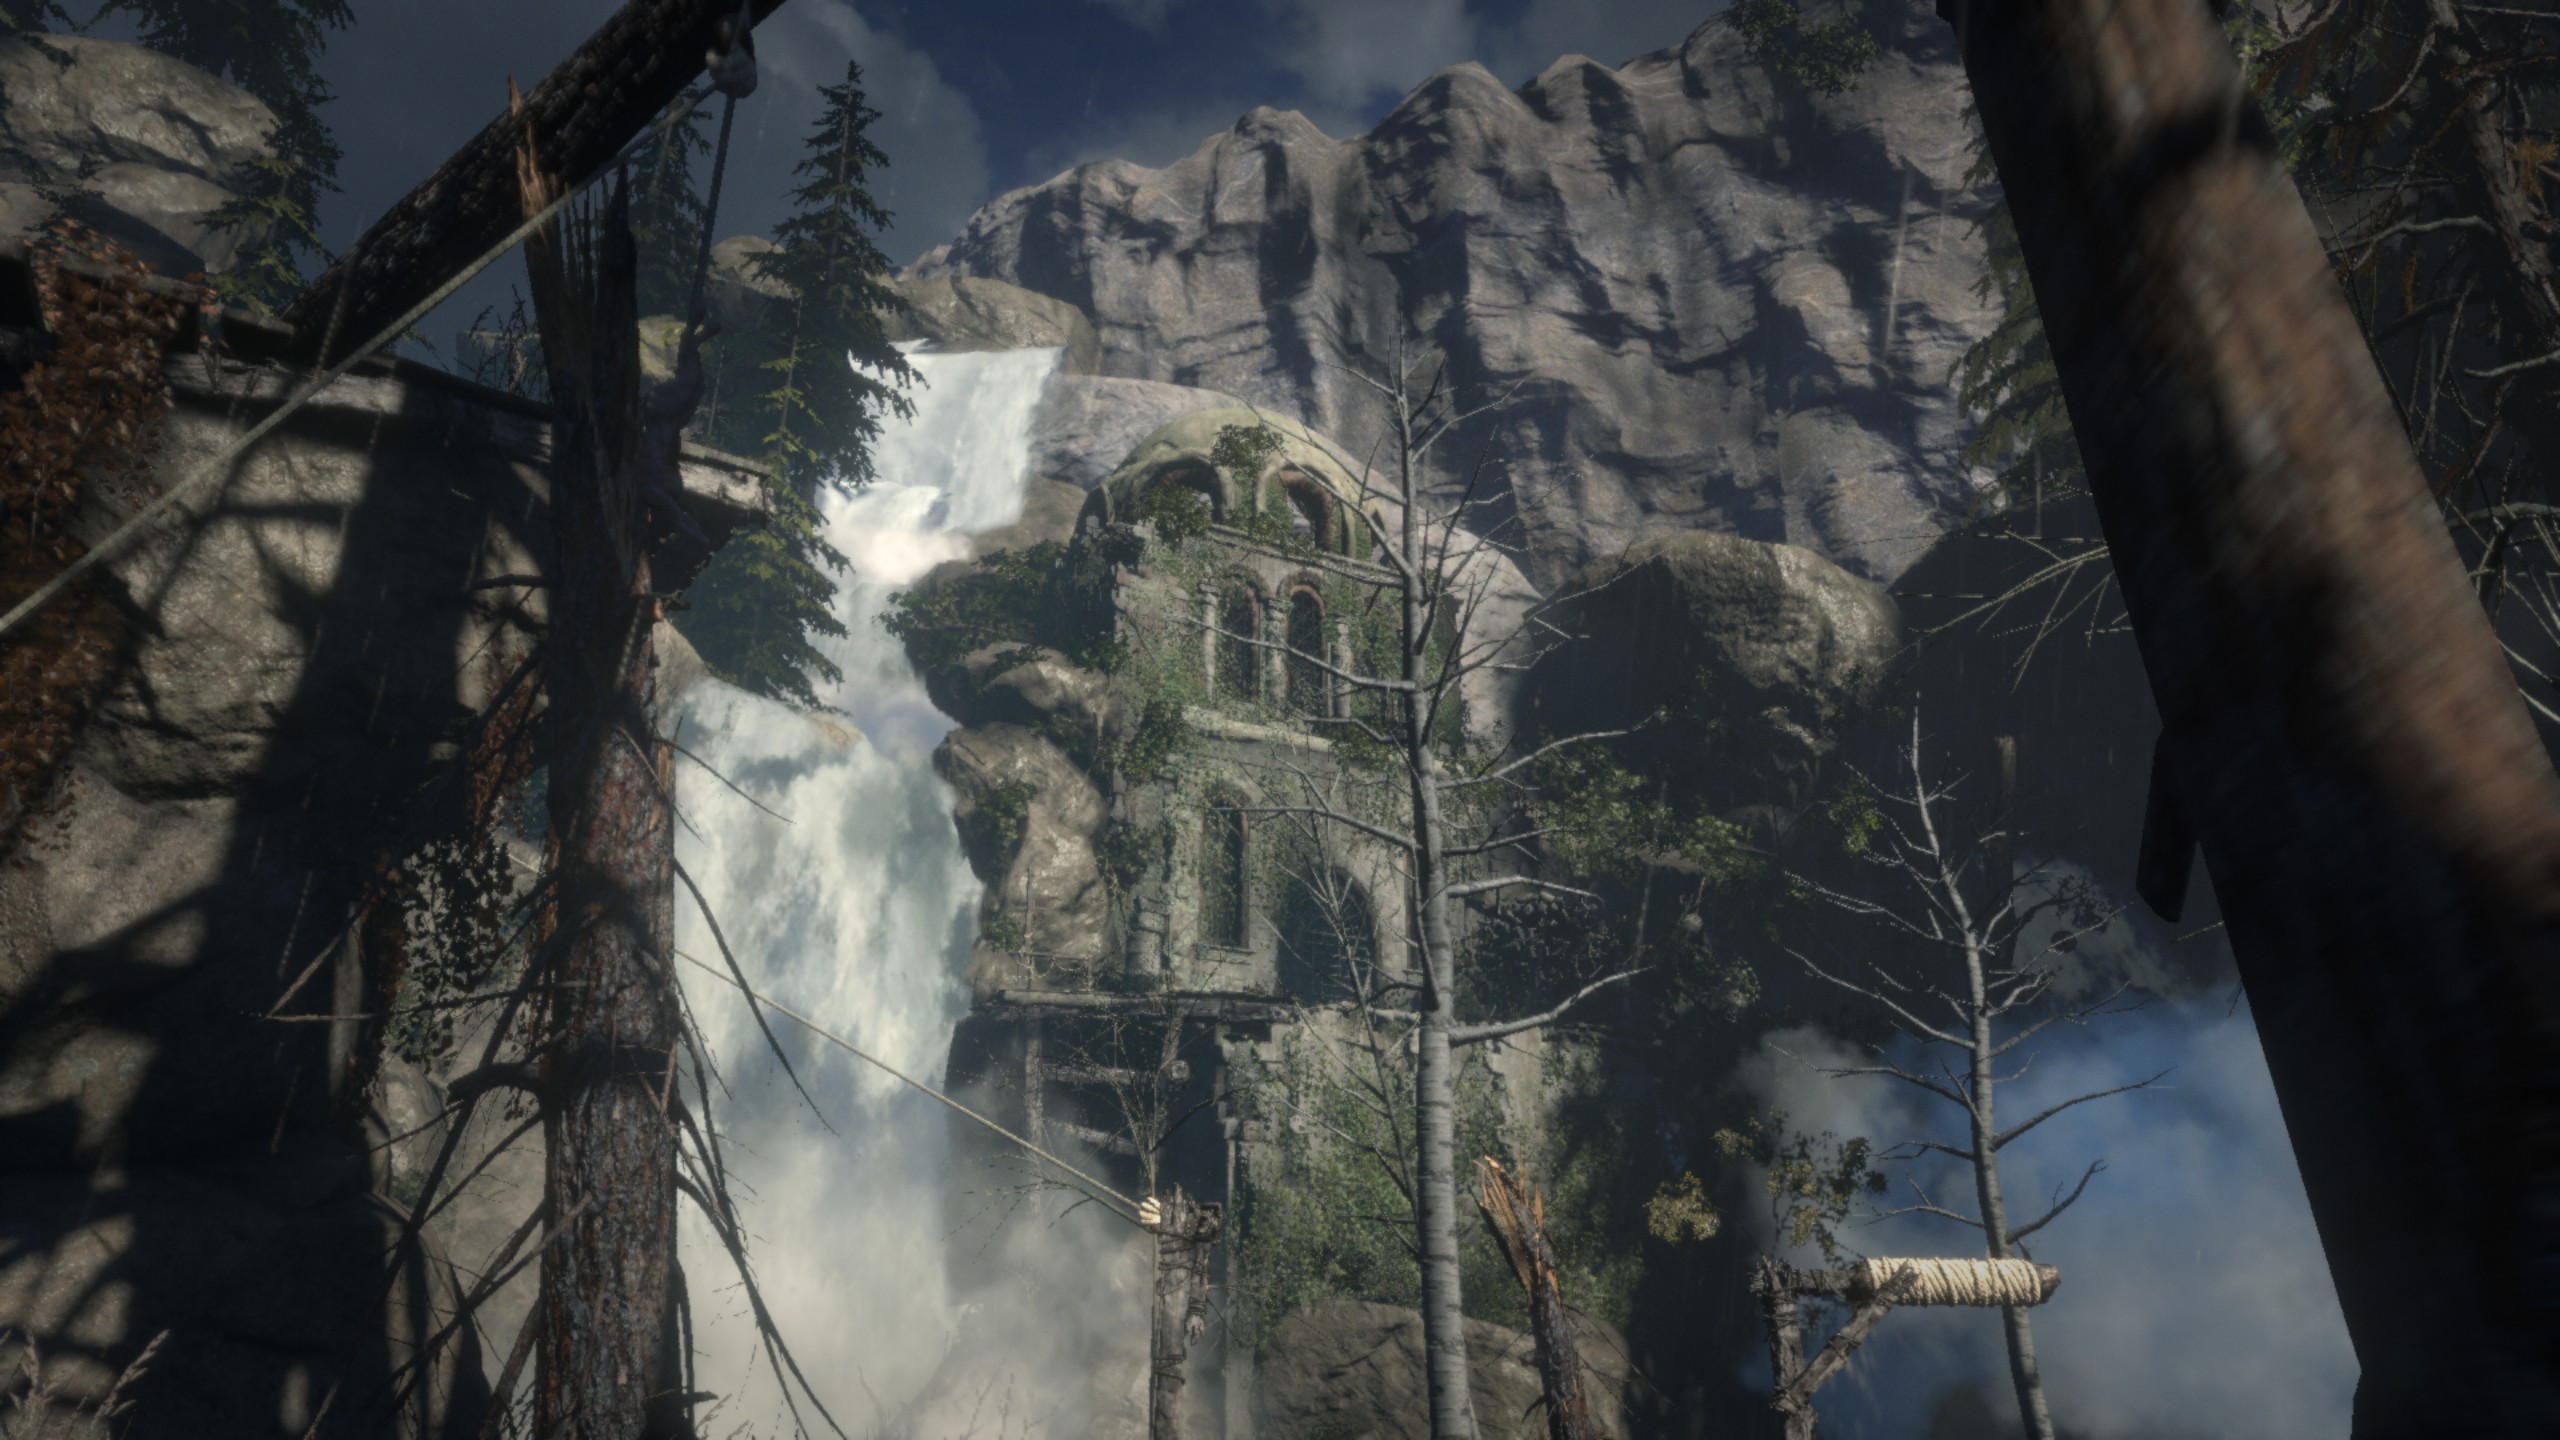
One of the newest games in the gaming benchmark suite is Rise of the Tomb Raider (RoTR), developed by Crystal Dynamics, and the sequel to the popular Tomb Raider which was loved for its automated benchmark mode. But don’t let that fool you: the benchmark mode in RoTR is very much different this time around.
Visually, the previous Tomb Raider pushed realism to the limits with features such as TressFX, and the new RoTR goes one stage further when it comes to graphics fidelity. This leads to an interesting set of requirements in hardware: some sections of the game are typically GPU limited, whereas others with a lot of long-range physics can be CPU limited, depending on how the driver can translate the DirectX 12 workload.
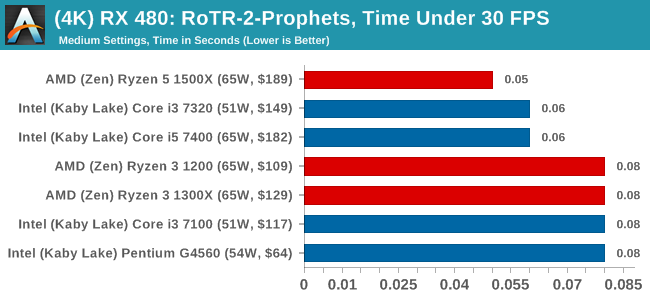
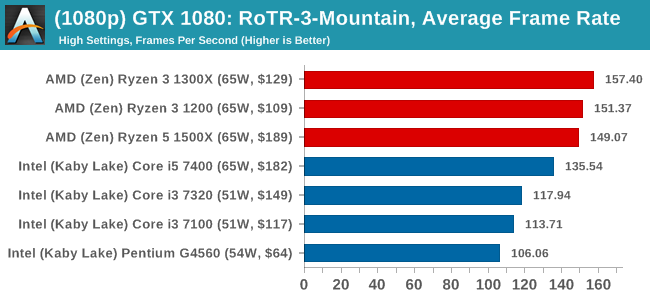
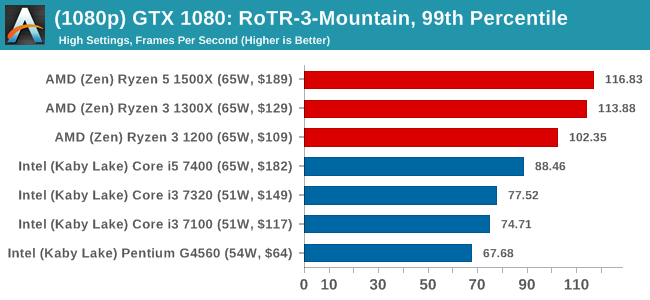
Where the old game had one benchmark scene, the new game has three different scenes with different requirements: Geothermal Valley (1-Valley), Prophet’s Tomb (2-Prophet) and Spine of the Mountain (3-Mountain) - and we test all three. These are three scenes designed to be taken from the game, but it has been noted that scenes like 2-Prophet shown in the benchmark can be the most CPU limited elements of that entire level, and the scene shown is only a small portion of that level. Because of this, we report the results for each scene on each graphics card separately.

Graphics options for RoTR are similar to other games in this type, offering some presets or allowing the user to configure texture quality, anisotropic filter levels, shadow quality, soft shadows, occlusion, depth of field, tessellation, reflections, foliage, bloom, and features like PureHair which updates on TressFX in the previous game.
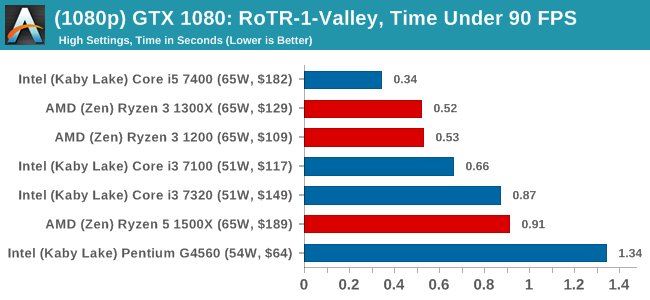
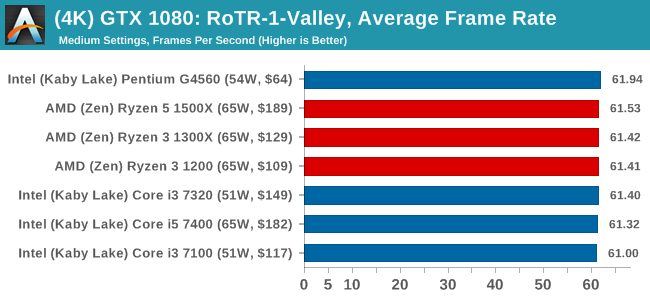
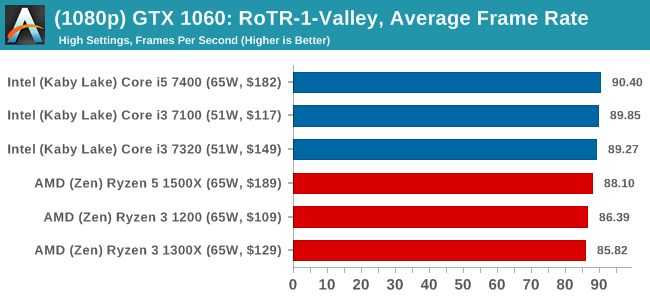
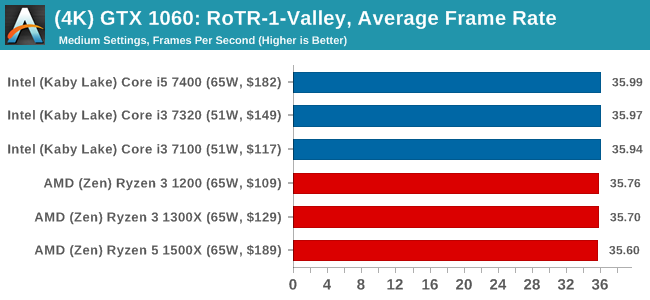
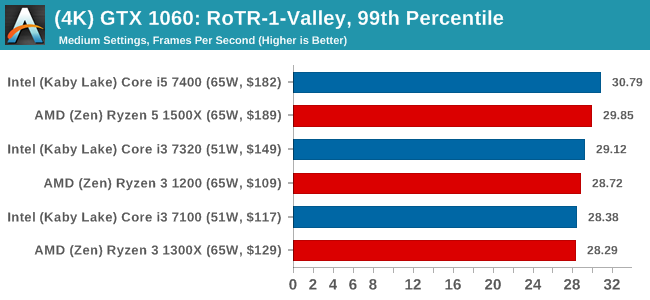
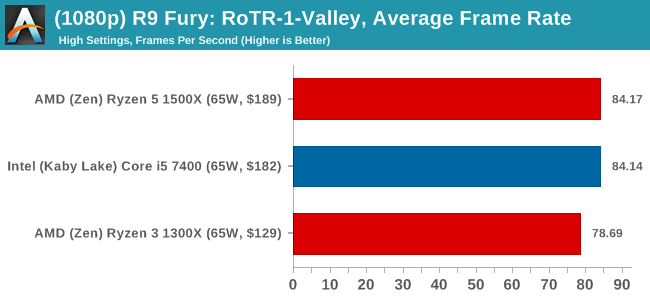
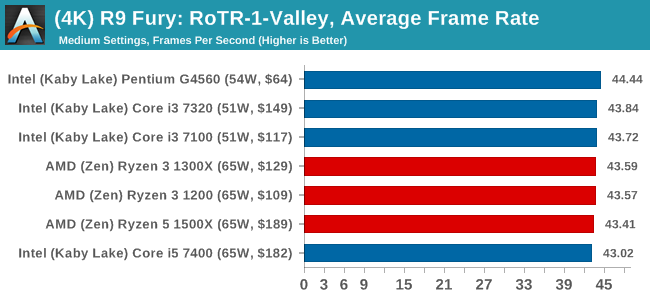
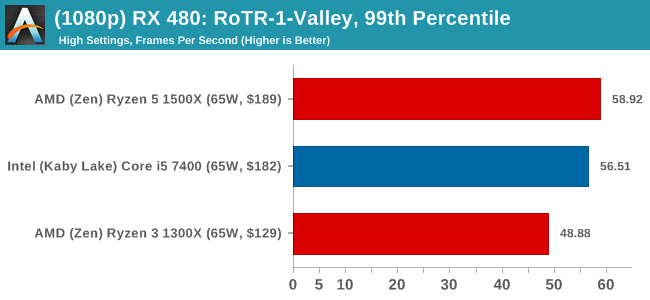
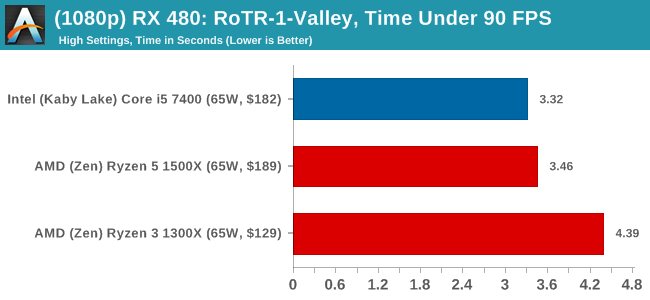
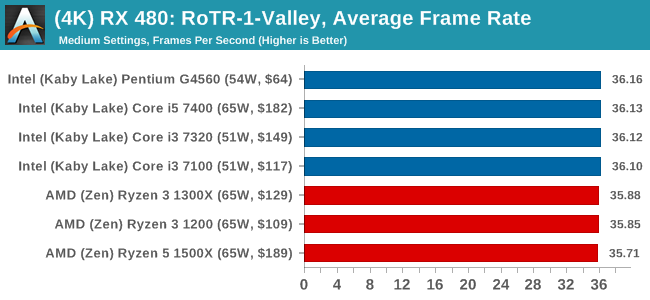
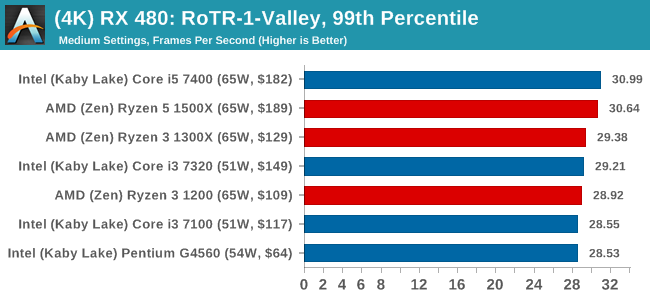
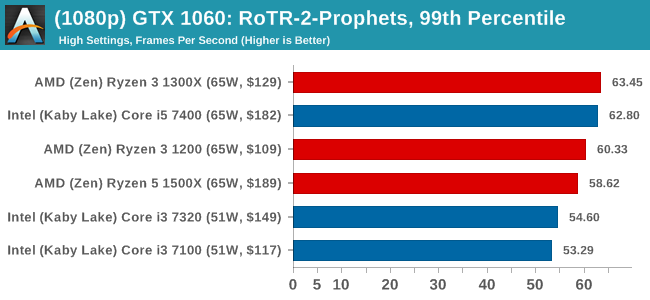
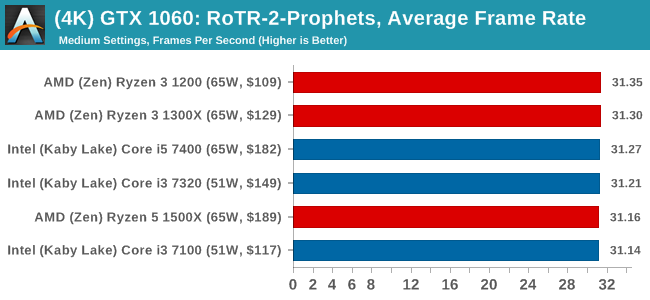
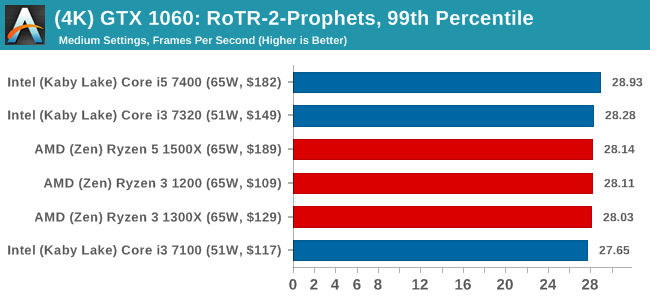
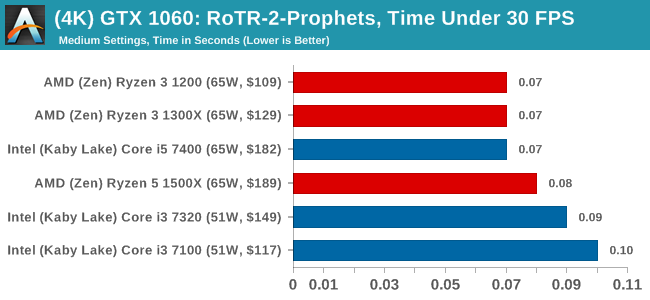
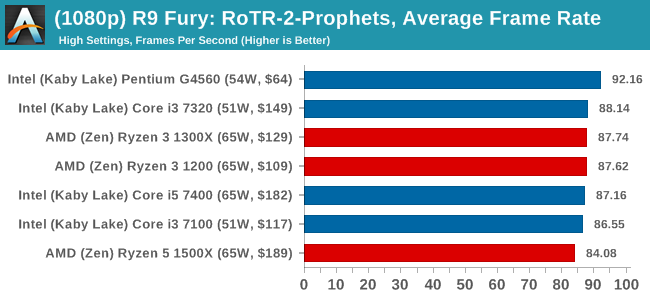
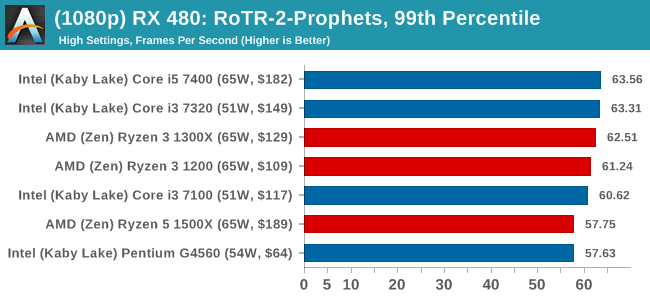
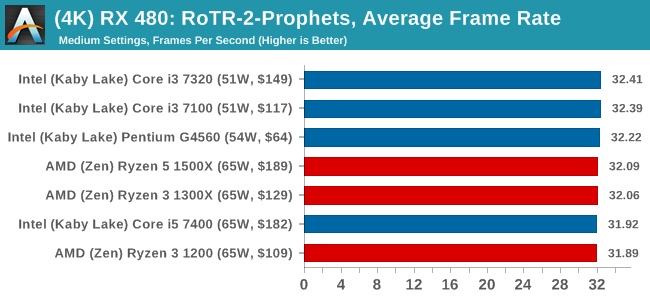
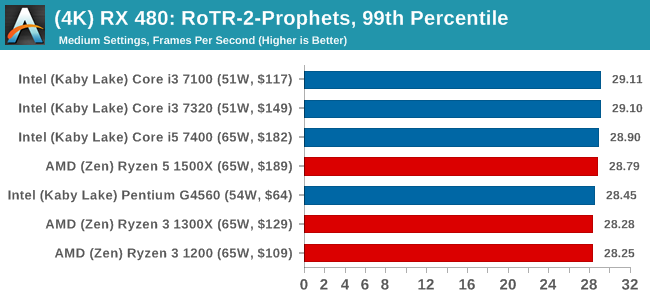
Again, we test at 1920x1080 and 4K using our native 4K displays. At 1080p we run the High preset, while at 4K we use the Medium preset which still takes a sizable hit in frame rate.
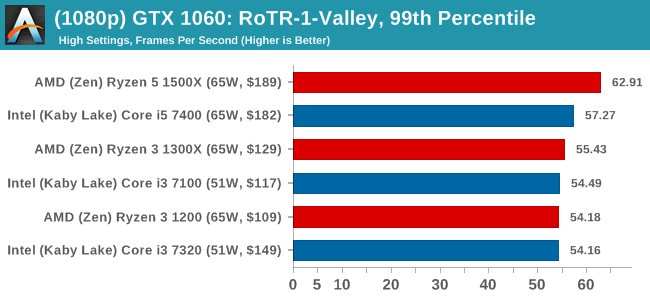
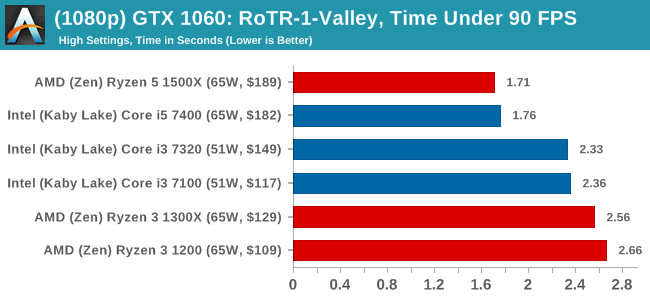
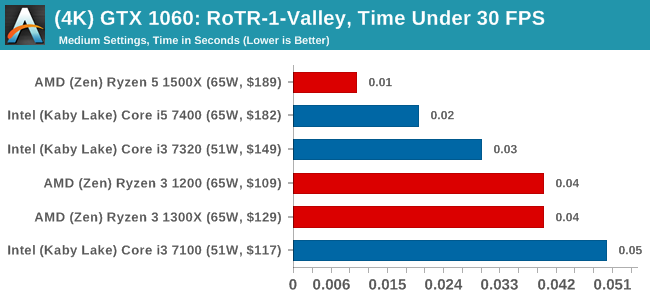
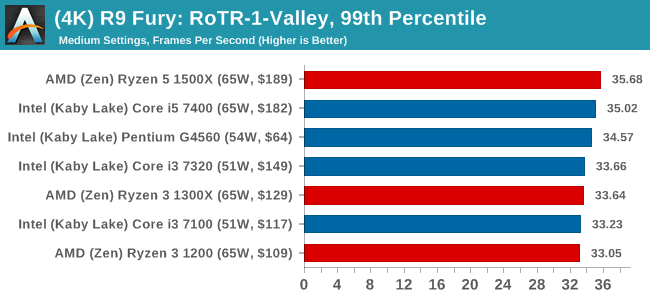
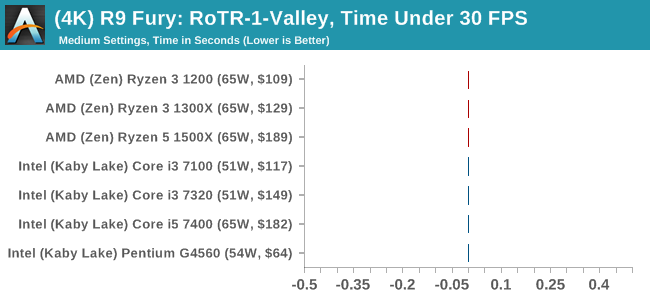
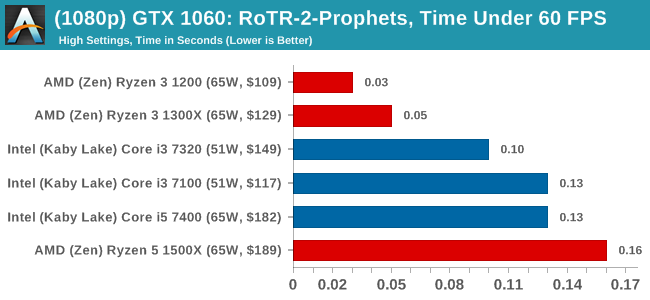
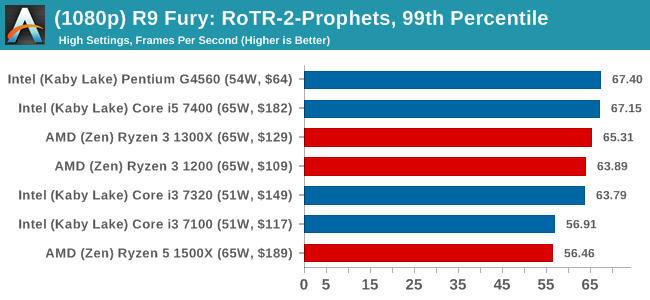
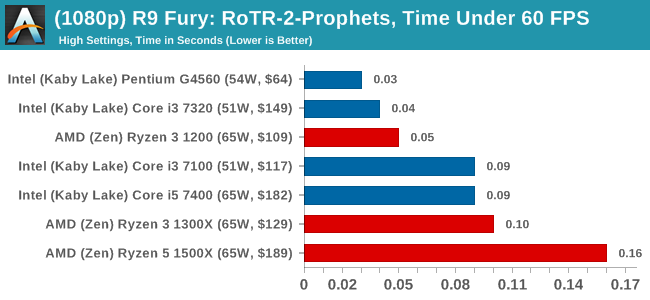
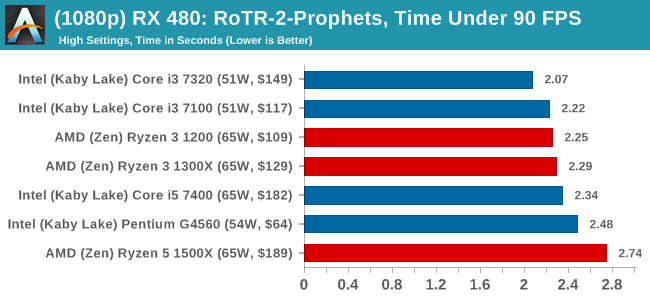
It is worth noting that RoTR is a little different to our other benchmarks in that it keeps its graphics settings in the registry rather than a standard ini file, and unlike the previous TR game the benchmark cannot be called from the command-line. Nonetheless we scripted around these issues to automate the benchmark four times and parse the results. From the frame time data, we report the averages, 99th percentiles, and our time under analysis.
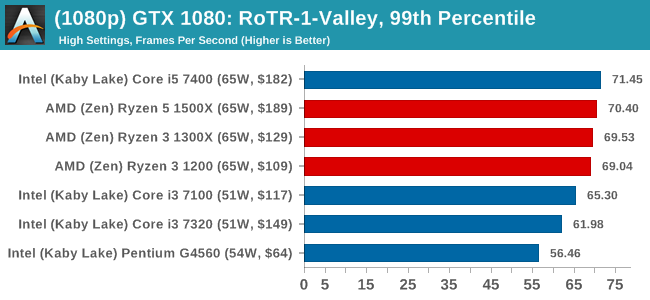
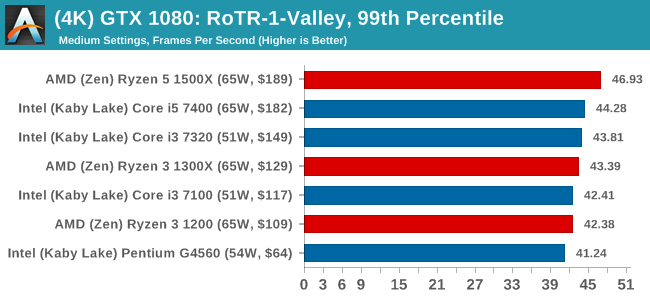
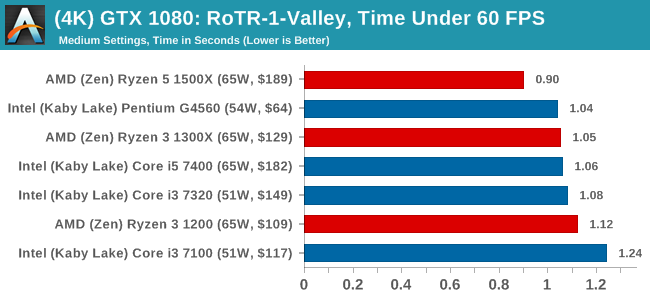
For all our results, we show the average frame rate at 1080p first. Mouse over the other graphs underneath to see 99th percentile frame rates and 'Time Under' graphs, as well as results for other resolutions. All of our benchmark results can also be found in our benchmark engine, Bench.
#1 Geothermal Valley
MSI GTX 1080 Gaming 8G Performance
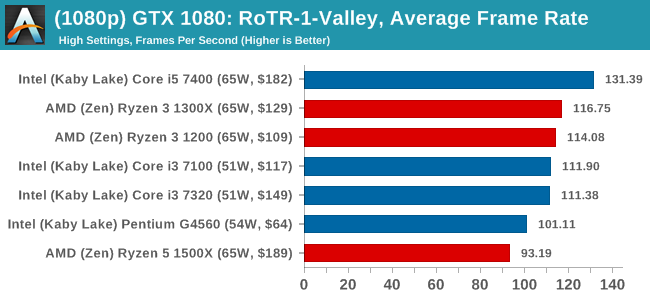
1080p
4K
ASUS GTX 1060 Strix 6GB Performance
1080p
4K
Sapphire R9 Fury 4GB Performance
1080p

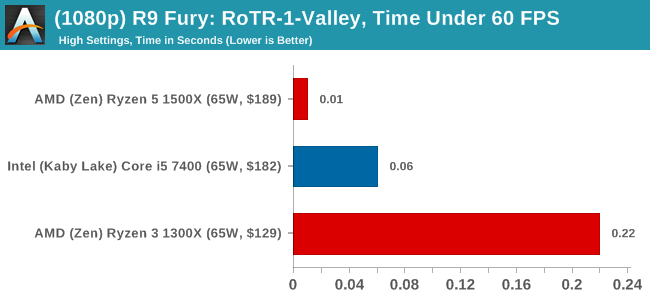
4K
Sapphire RX 480 8GB Performance
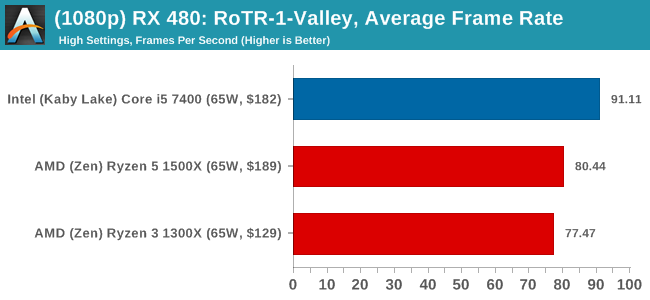
1080p
4K

Geothermal Valley had some issues in our benchmark test suite, where the 1080p benchmark wouldn't output frame time data for the first section. The issue has been debugged from our end and future reviews should contain all the data.
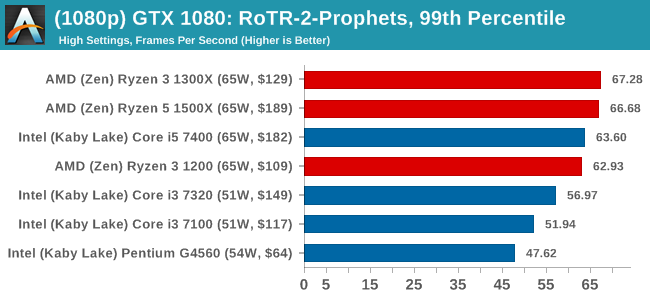
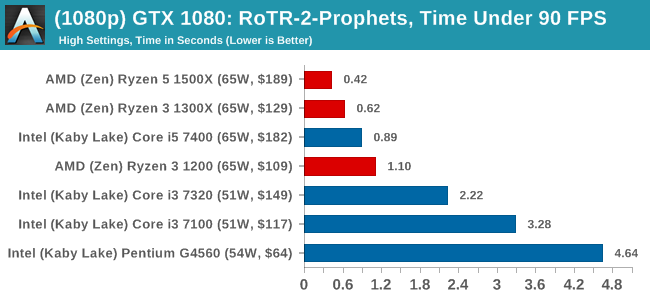
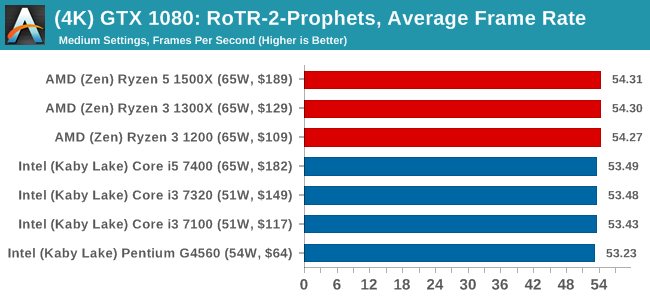
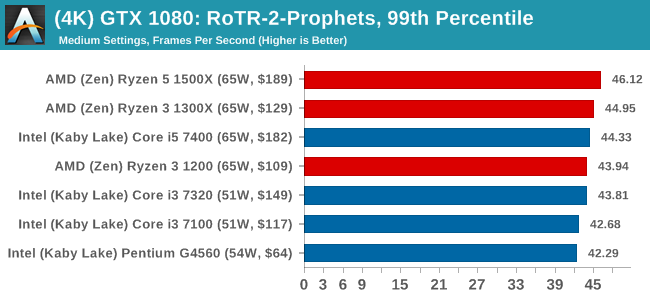
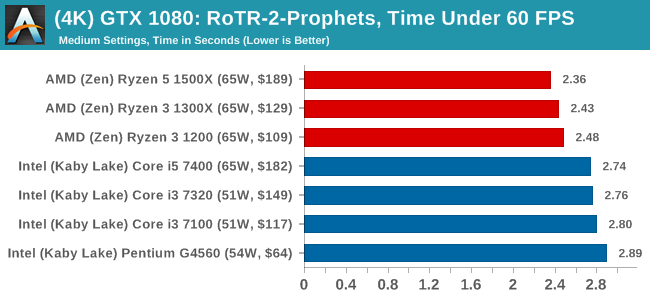
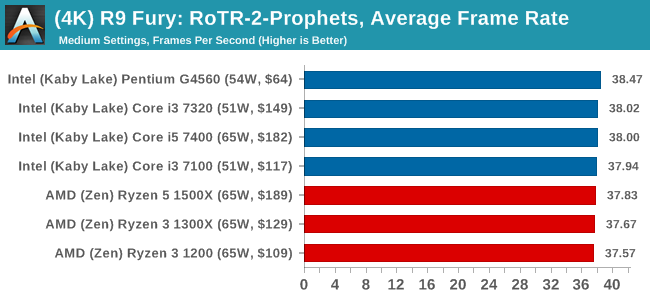
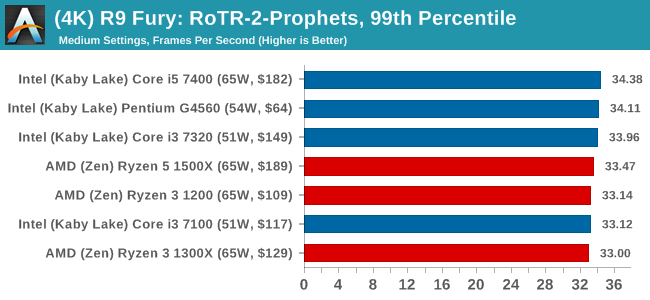
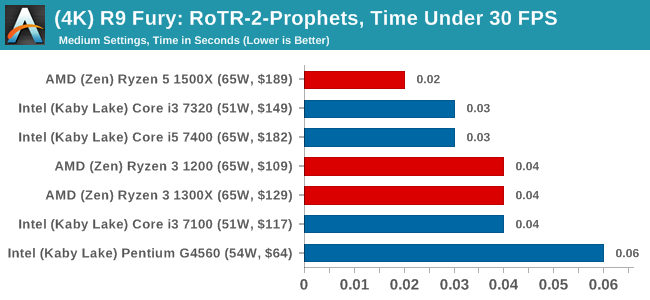
#2 Prophet's Tomb
MSI GTX 1080 Gaming 8G Performance
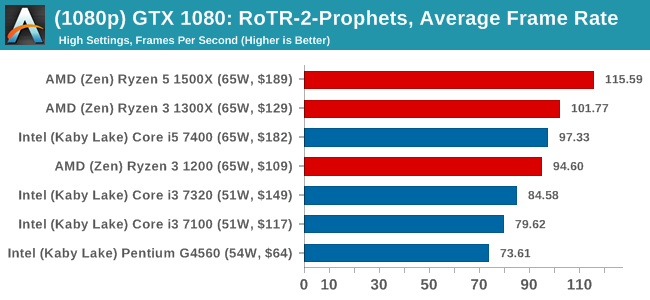
1080p
4K
ASUS GTX 1060 Strix 6GB Performance
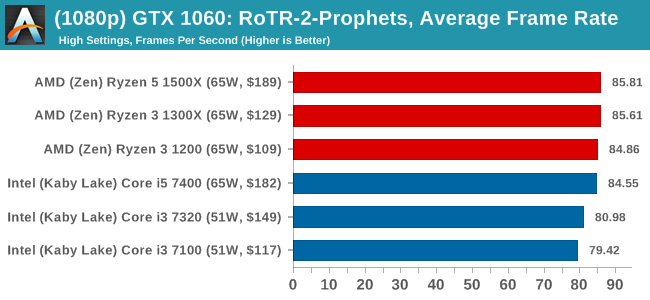
1080p
4K
Sapphire R9 Fury 4GB Performance
1080p
4K
Sapphire RX 480 8GB Performance
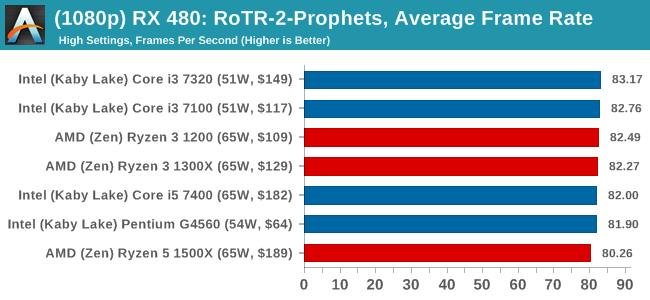
1080p
4K
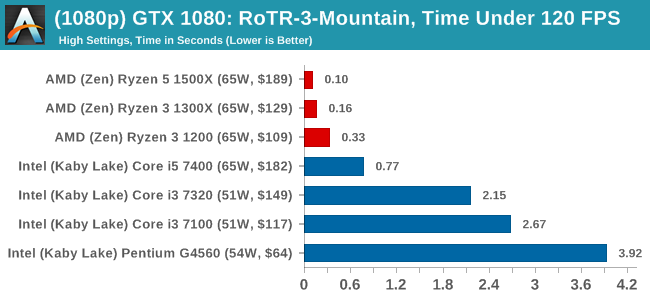
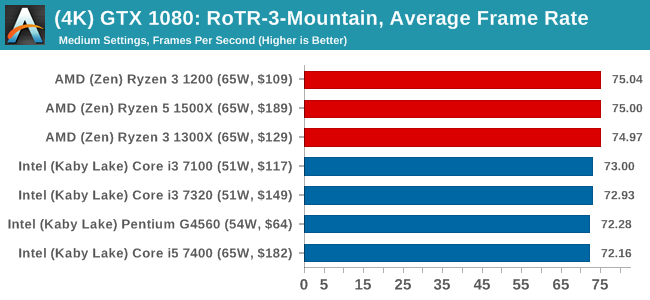
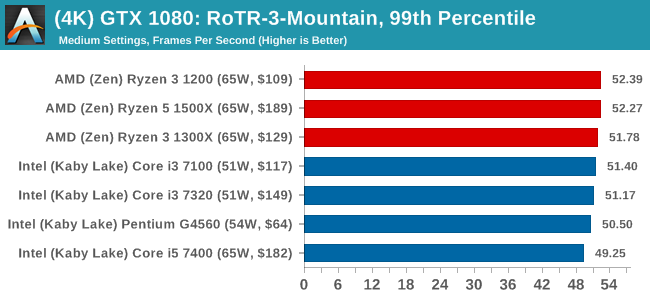
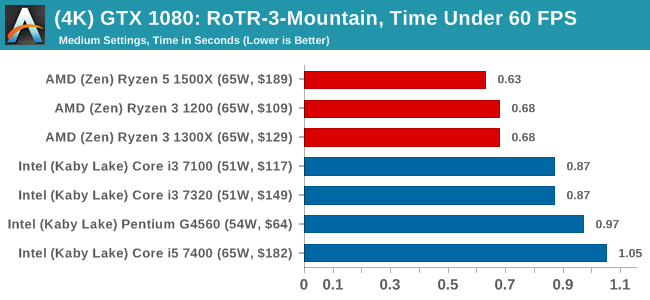
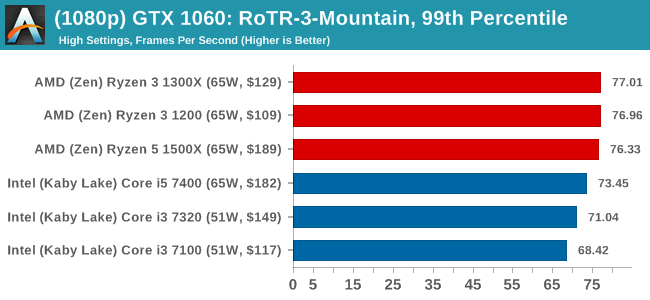
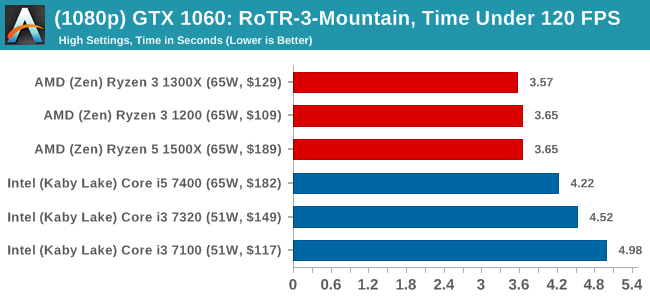
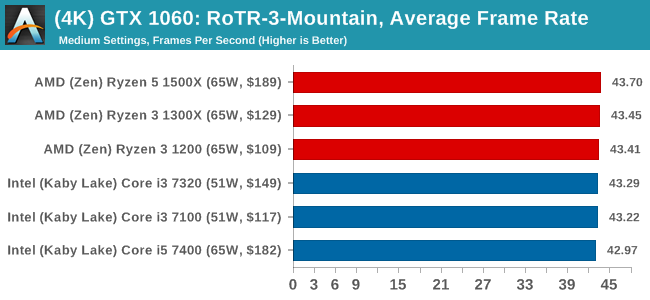
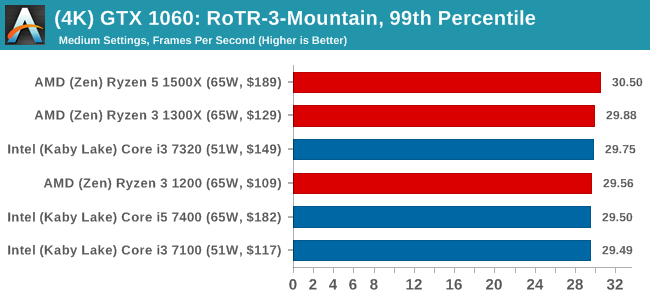
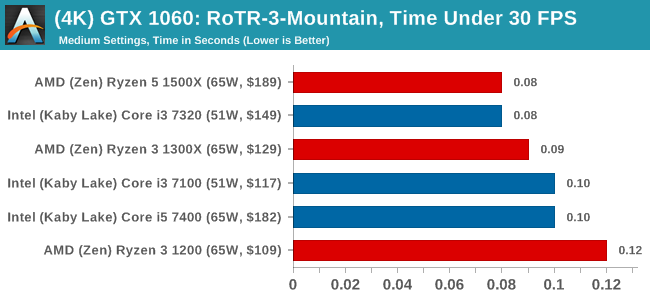
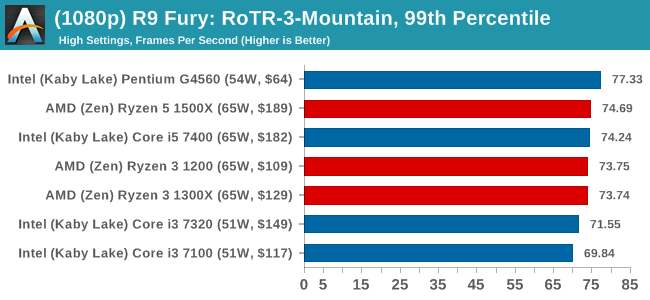
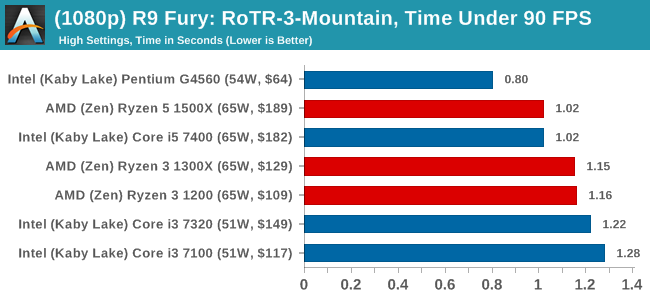
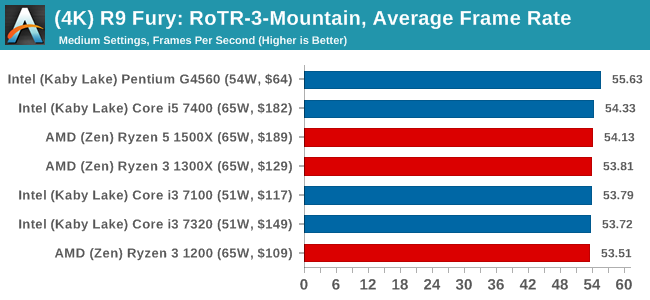
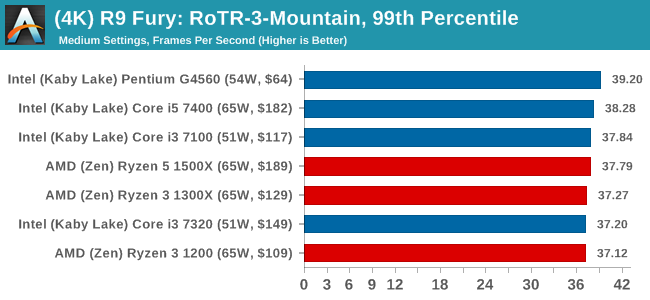
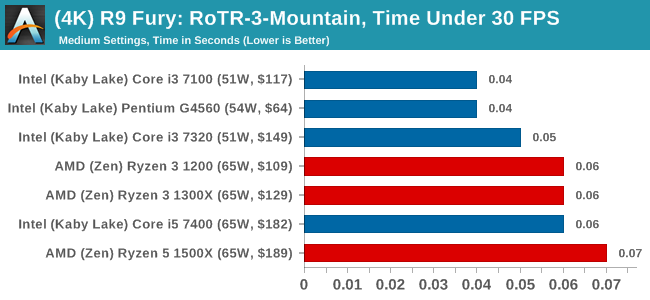
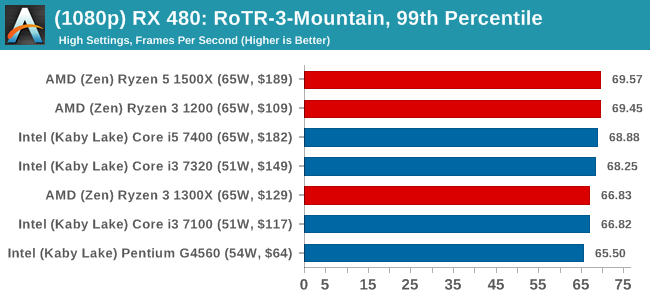
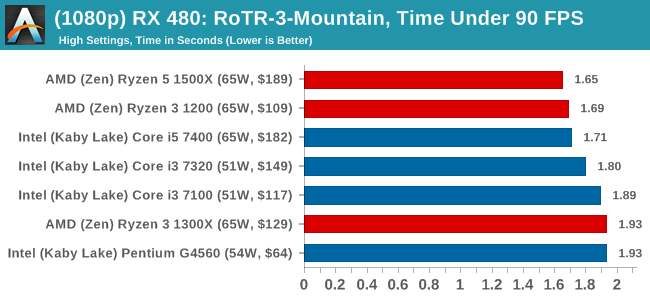
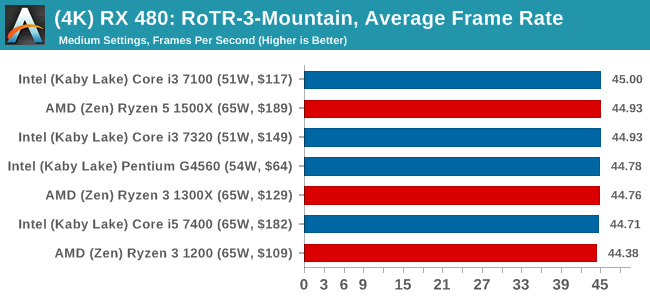
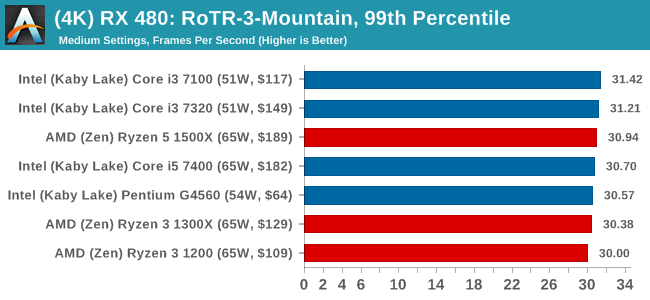
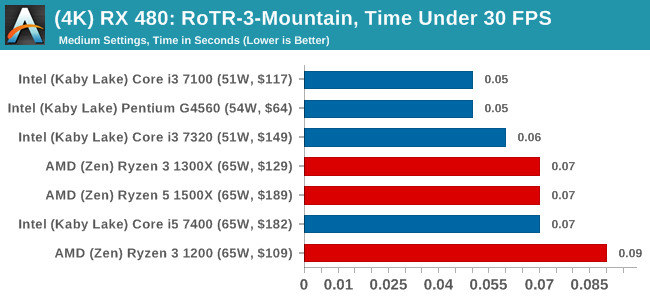
#3 Spine of the Mountain
MSI GTX 1080 Gaming 8G Performance
1080p
4K
ASUS GTX 1060 Strix 6GB Performance
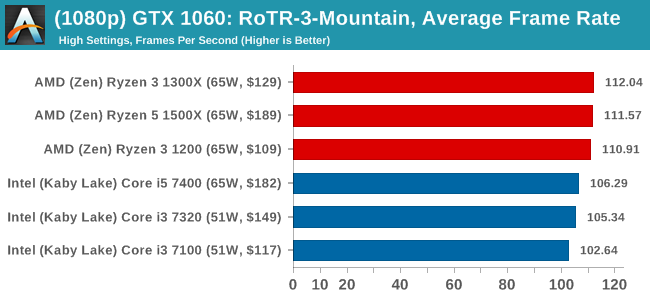
1080p
4K
Sapphire R9 Fury 4GB Performance
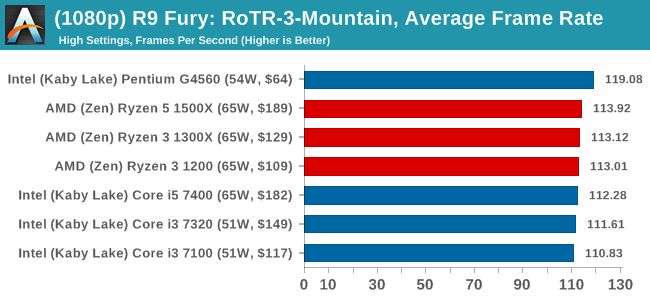
1080p
4K
Sapphire RX 480 8GB Performance

1080p
4K


140 Comments
View All Comments
Ian Cutress - Thursday, July 27, 2017 - link
So one, overclocking is for a later review. Can't pass judgement on something that's not been tested. Other sites have certainly had more time (I get my chips 3-4 days after the US sites do, as I'm not in the US). This review was being written as the deadline passed, and is still being tested. It's not written it weeks in advance, with time to tooth comb and perfect every sentence. I've pulled an all-nighter to get to where it is now, even with some of the missing tests which are still being run. So when you say 'does not tell the full story', well not everything has been tested. I've made that abundantly clear several times in the review.Two, these chips are filling in volume at the lower end, especially in B2B where nothing is overclocked. You want me to sing the praises of a feature that we haven't had time to test for a product that's going to fill a market that won't use that feature, even though some in a different market might? If/when we get around to a pt2, I'll focus more on the enthusiast perspective. If you've read most of our CPU reviews over the past two years, most of the emphasis usually goes on out-of-the-box performance anyway.
Third, on the very first page, in black and white, it states 'The big upswing for AMD here is going to be overclocking, and potentially push the Ryzen 3 CPUs through to compete with the next one up the stack depending on stock performance.'
vanilla_gorilla - Thursday, July 27, 2017 - link
Ian, first off, great review as always and thank you. Second, you should just write up a large FAQ/disclaimer for your reviews that you can just link in the article and in comment replies. The same questions and complaints come up over and over, you've got to be tired of addressing them.DrKlahn - Thursday, July 27, 2017 - link
As I said, I understand it is for a later review. I also understand that a lot of these chips will never be overclocked. I don't want you to sing the praises of anything. I want a caveat in the conclusion that this potential exists and it impacts the value proposition. History has shown us (think the initial Radeon 290 reviews) that the first impression sticks with the reader regardless of how a product fares in the future. I have zero issues with your conclusion as an out of the box evaluation and appreciate your efforts. However your conclusion should have a caveat attached to it to call attention to everything the chip offers.mikato - Thursday, July 27, 2017 - link
I think that's fair. Here's another vote.Gothmoth - Thursday, July 27, 2017 - link
just saw your reply.... and i count on that. :-)Gothmoth - Thursday, July 27, 2017 - link
i hope anandtech will test the overcloked ryzen against the locked intels.but then... is amd paying enough fot advertising on anandtech..... :)
willis936 - Thursday, July 27, 2017 - link
There is an R7 review and now an R3 review but nothing on the most interesting segment: R5. I've seen multiple other sites say that the R5 segment is where AMD is the clear winner for all workloads. Go up or down $50 and Intel makes more sense for gaming.MrCommunistGen - Thursday, July 27, 2017 - link
http://www.anandtech.com/show/11244/the-amd-ryzen-...willis936 - Thursday, July 27, 2017 - link
I wonder why that doesn't show up when using anandtech's search feature.http://www.anandtech.com/SearchResults?q=R5
MrCommunistGen - Thursday, July 27, 2017 - link
This article doesn't show up when you search R3, and the 1800X article doesn't show up if you search R7.AMD isn't actually using R3, R5, and R7 as part of their branding for Ryzen, though I guess at least some are using that shorthand. The R3/5/7 are being used for GPU branding for some generations of discrete cards and APUs.
If you look at the top of the article underneath the author's name, you'll see what tags the article has (and thus search terms) that you could use to find it in the future. Looks like "Ryzen" or "Ryzen 3" "Ryzen 5" and "Ryzen 7" are good terms.
On the other hand, I found the link I posted above by going to Google and typing:
anandtech 1600x review