The AMD Ryzen 3 1300X and Ryzen 3 1200 CPU Review: Zen on a Budget
by Ian Cutress on July 27, 2017 9:30 AM EST- Posted in
- CPUs
- AMD
- Zen
- Ryzen
- Ryzen 3
- Ryzen 3 1300X
- Ryzen 3 1200
Rise of the Tomb Raider
One of the newest games in the gaming benchmark suite is Rise of the Tomb Raider (RoTR), developed by Crystal Dynamics, and the sequel to the popular Tomb Raider which was loved for its automated benchmark mode. But don’t let that fool you: the benchmark mode in RoTR is very much different this time around.
Visually, the previous Tomb Raider pushed realism to the limits with features such as TressFX, and the new RoTR goes one stage further when it comes to graphics fidelity. This leads to an interesting set of requirements in hardware: some sections of the game are typically GPU limited, whereas others with a lot of long-range physics can be CPU limited, depending on how the driver can translate the DirectX 12 workload.
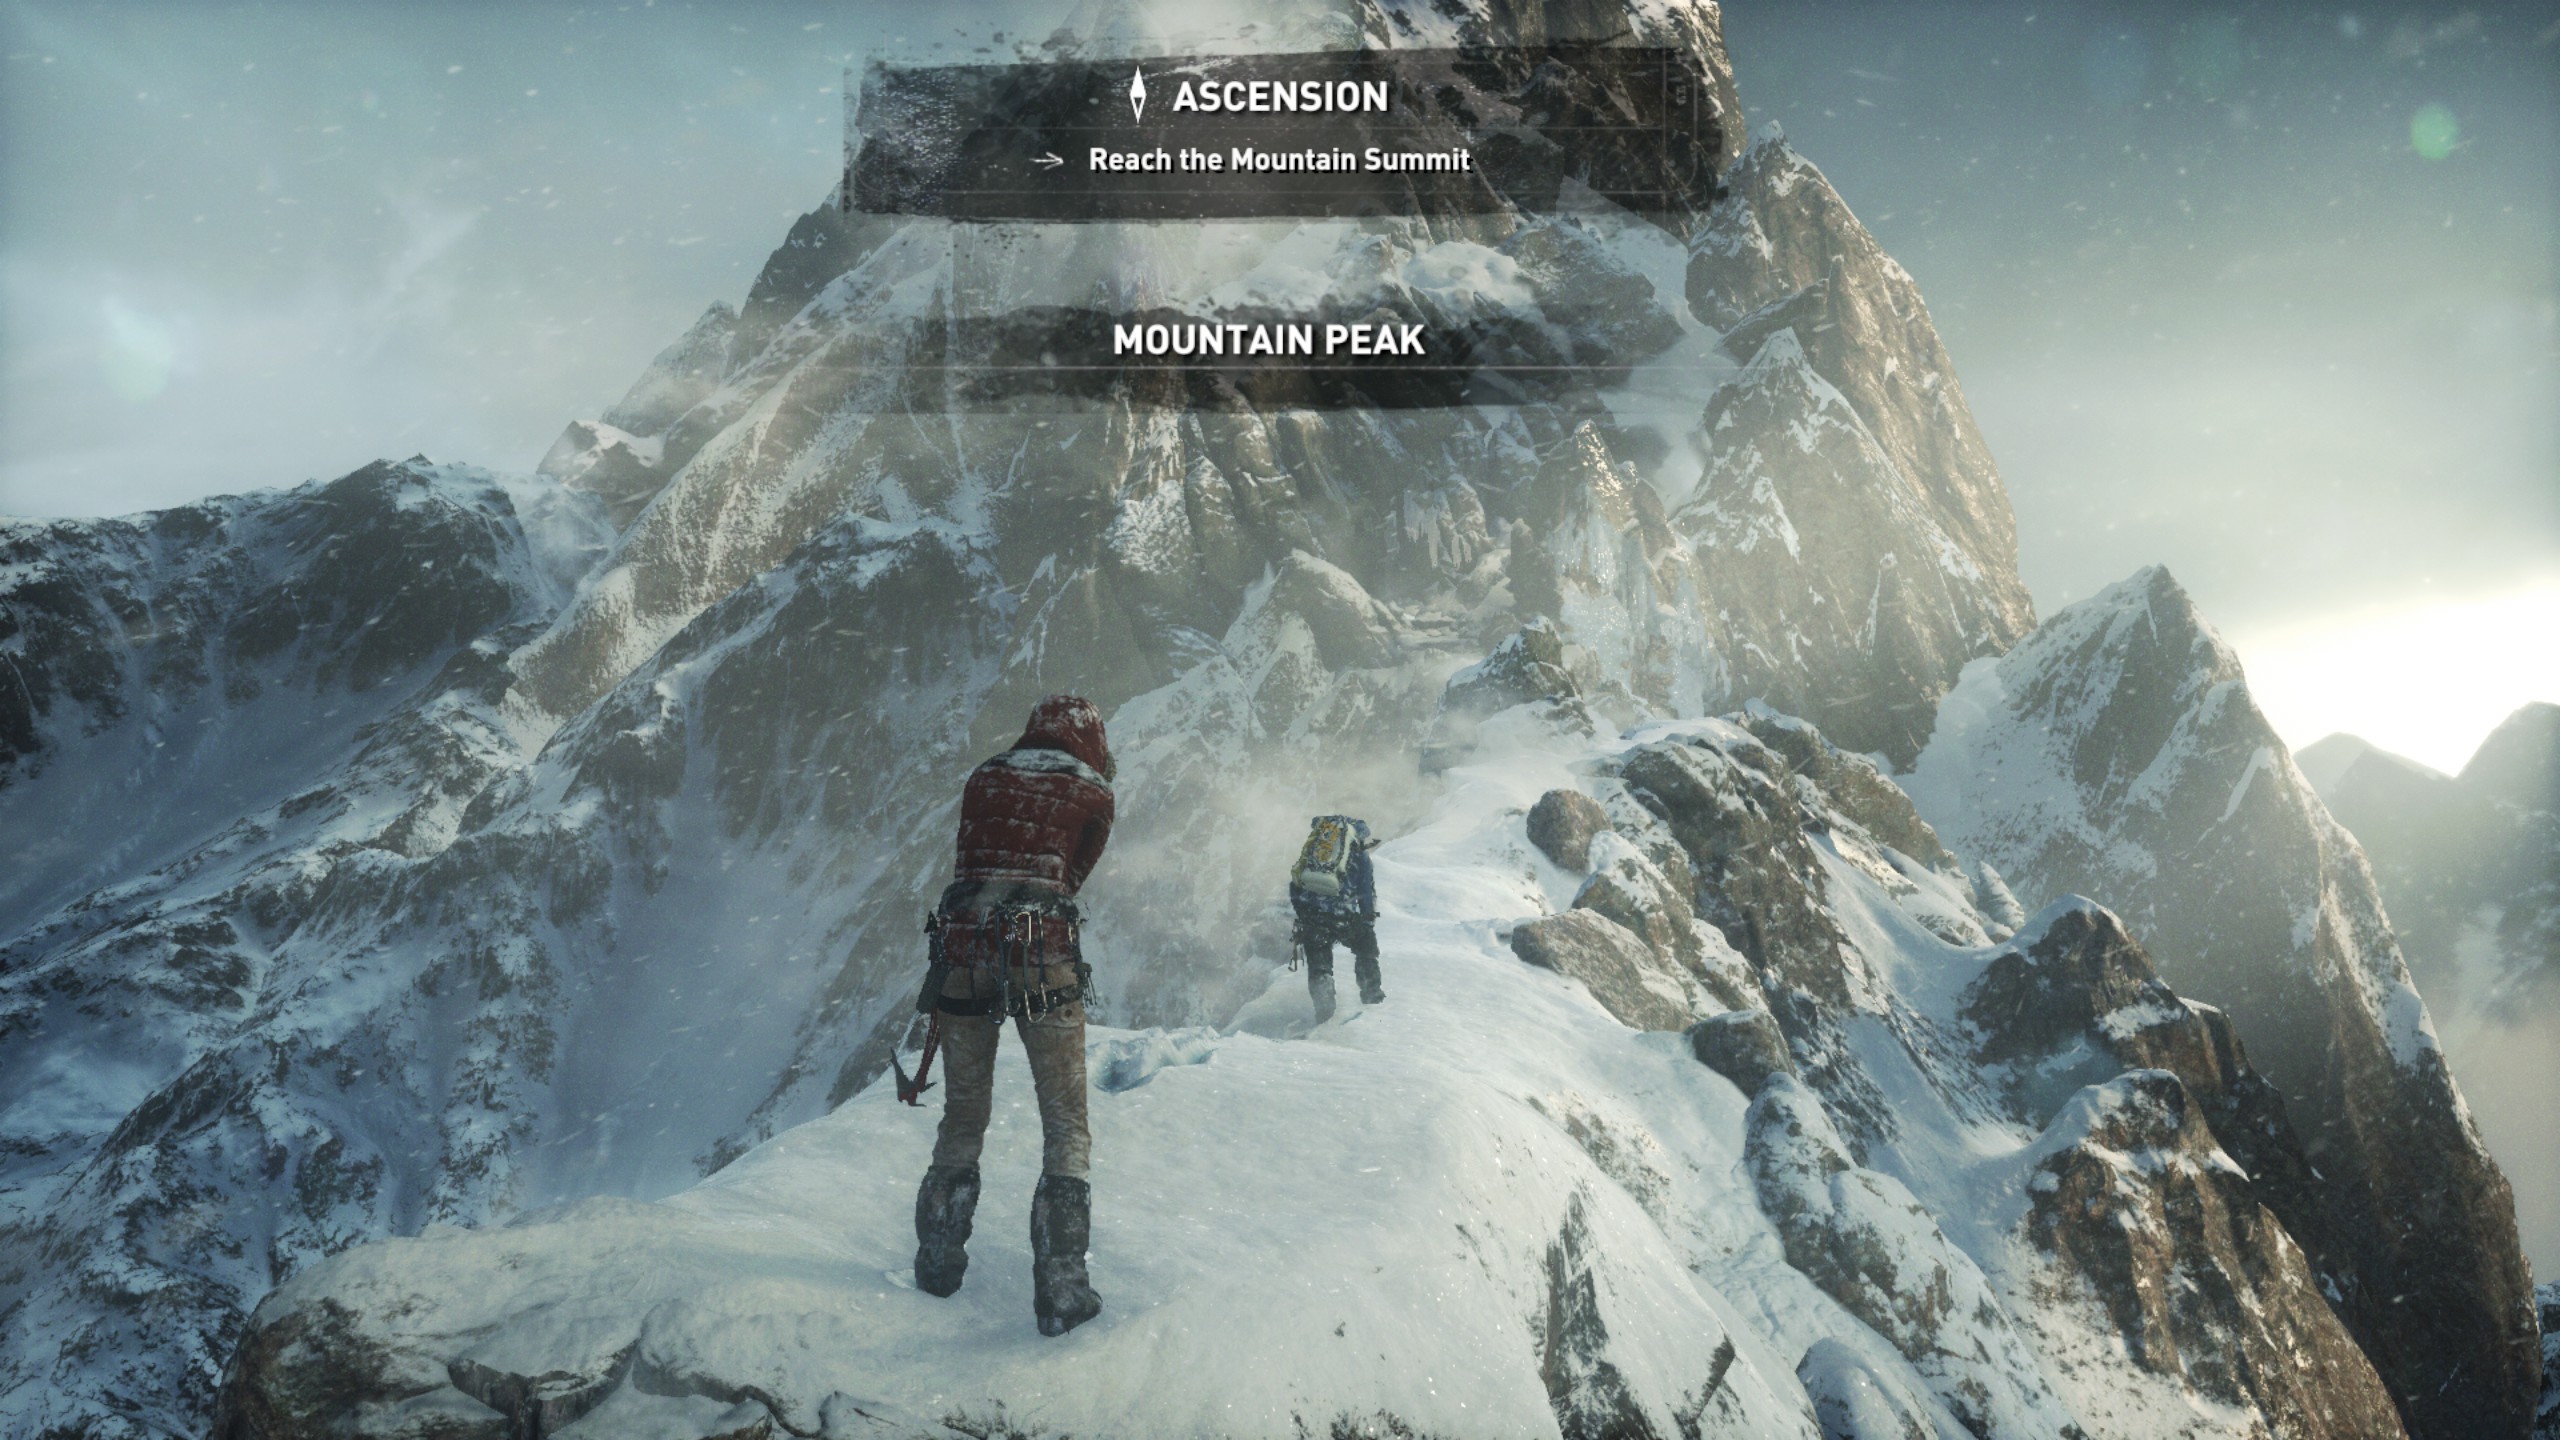
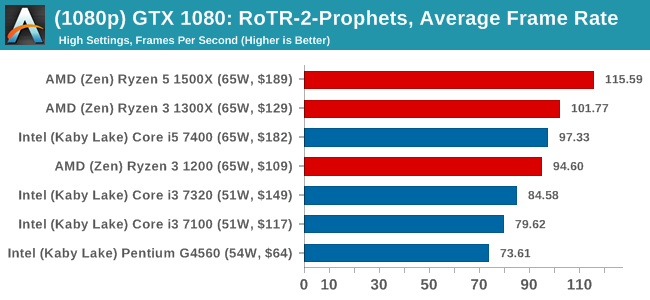
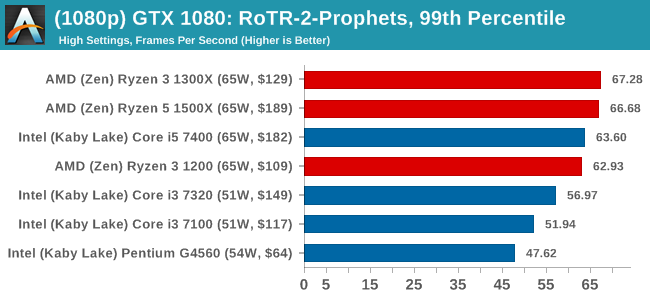
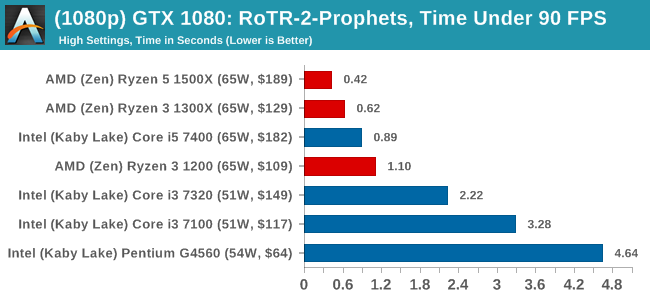
Where the old game had one benchmark scene, the new game has three different scenes with different requirements: Geothermal Valley (1-Valley), Prophet’s Tomb (2-Prophet) and Spine of the Mountain (3-Mountain) - and we test all three. These are three scenes designed to be taken from the game, but it has been noted that scenes like 2-Prophet shown in the benchmark can be the most CPU limited elements of that entire level, and the scene shown is only a small portion of that level. Because of this, we report the results for each scene on each graphics card separately.

Graphics options for RoTR are similar to other games in this type, offering some presets or allowing the user to configure texture quality, anisotropic filter levels, shadow quality, soft shadows, occlusion, depth of field, tessellation, reflections, foliage, bloom, and features like PureHair which updates on TressFX in the previous game.
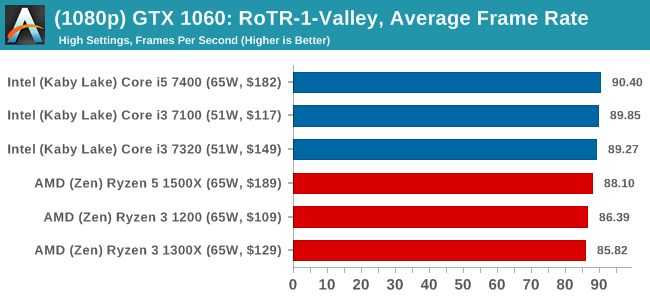
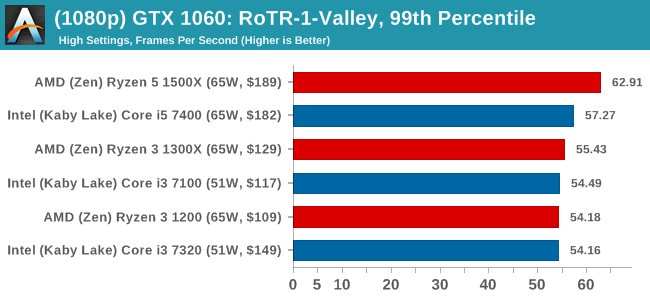
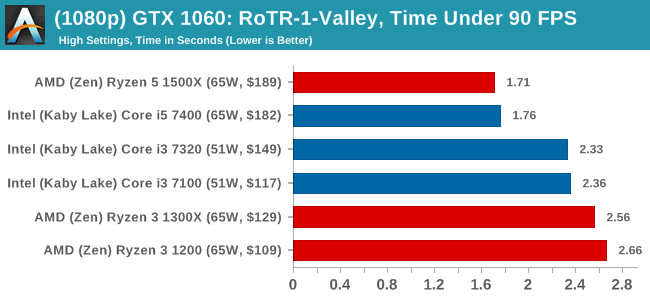
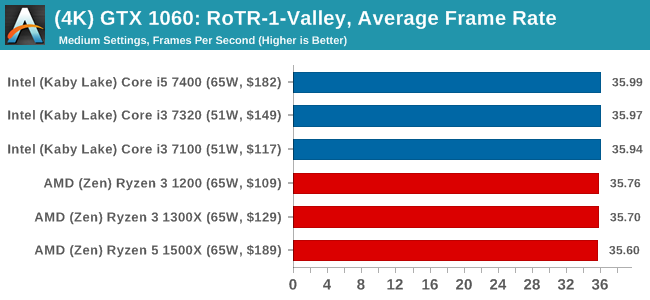
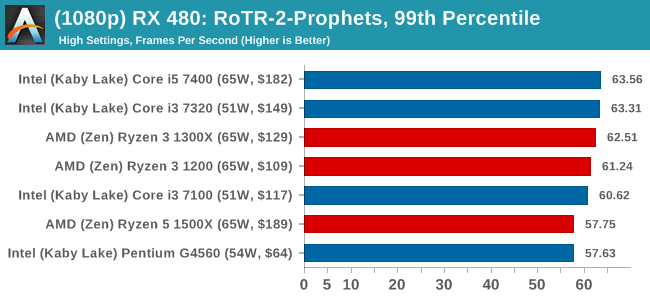
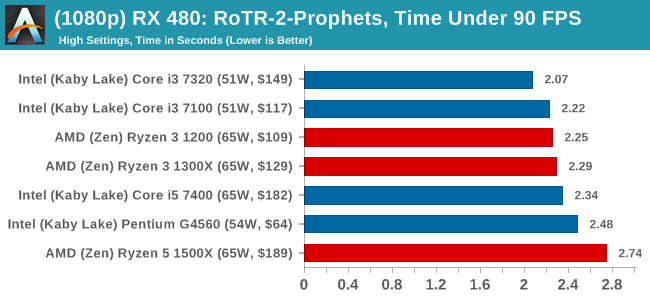
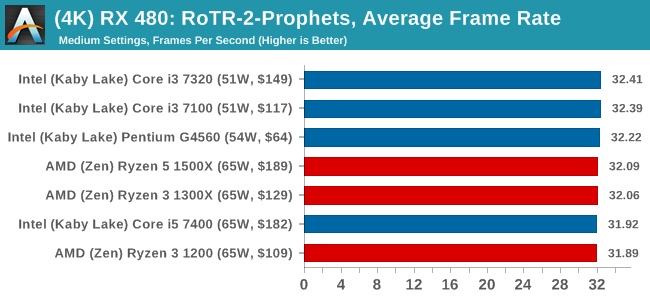
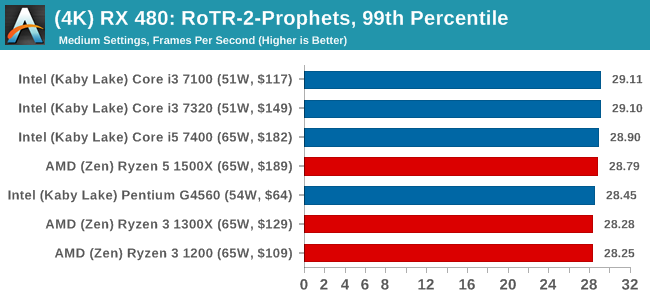
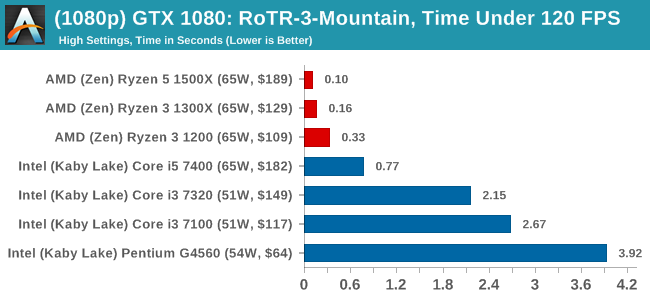
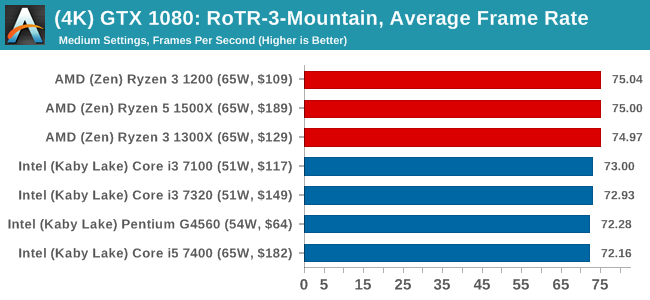
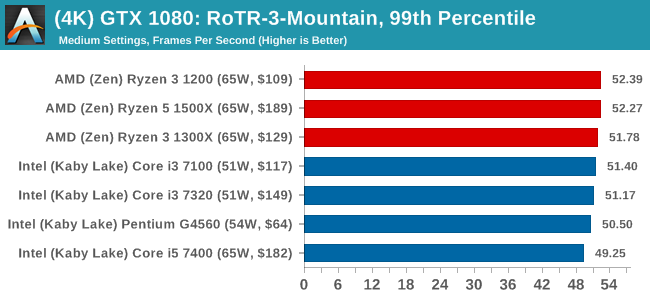
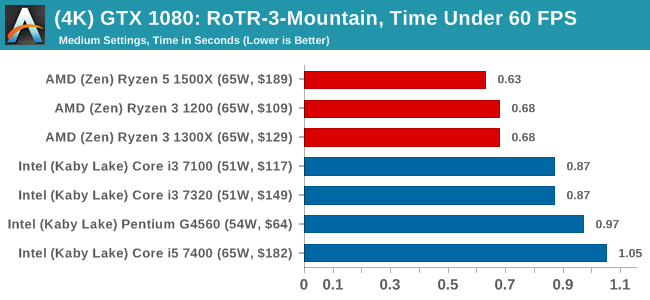
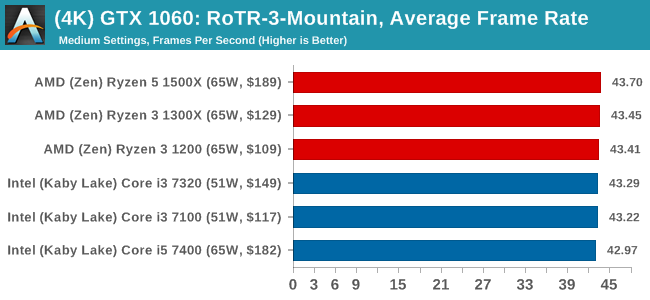
Again, we test at 1920x1080 and 4K using our native 4K displays. At 1080p we run the High preset, while at 4K we use the Medium preset which still takes a sizable hit in frame rate.
It is worth noting that RoTR is a little different to our other benchmarks in that it keeps its graphics settings in the registry rather than a standard ini file, and unlike the previous TR game the benchmark cannot be called from the command-line. Nonetheless we scripted around these issues to automate the benchmark four times and parse the results. From the frame time data, we report the averages, 99th percentiles, and our time under analysis.
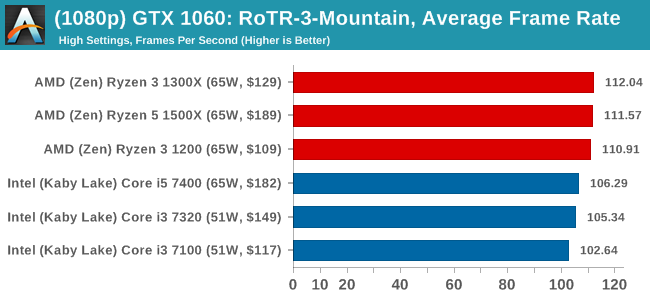
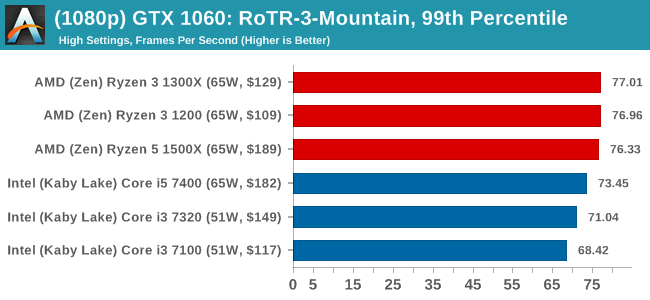
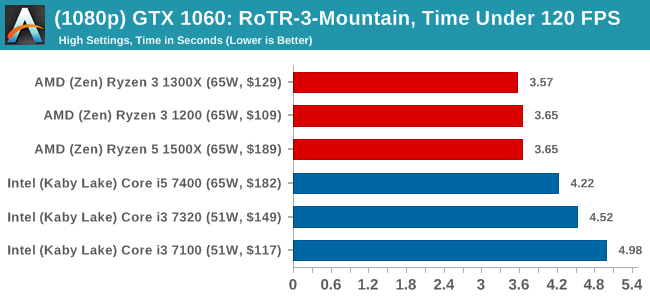
For all our results, we show the average frame rate at 1080p first. Mouse over the other graphs underneath to see 99th percentile frame rates and 'Time Under' graphs, as well as results for other resolutions. All of our benchmark results can also be found in our benchmark engine, Bench.
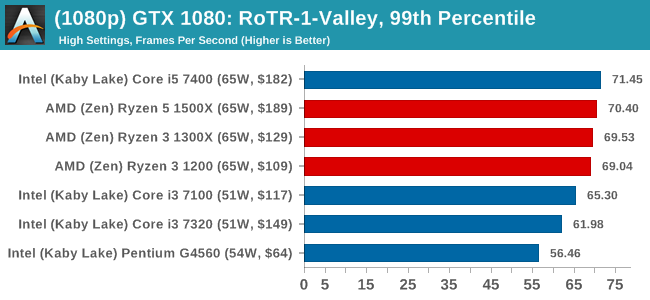
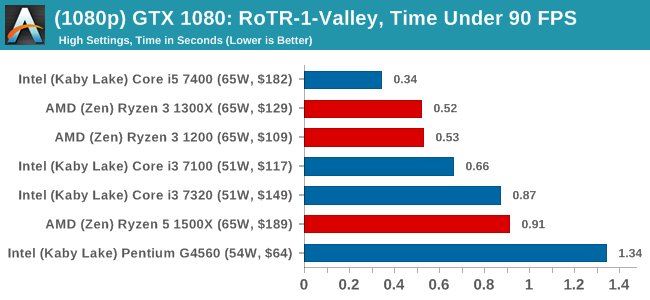
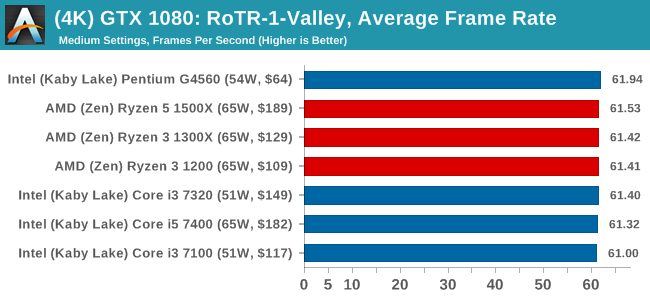
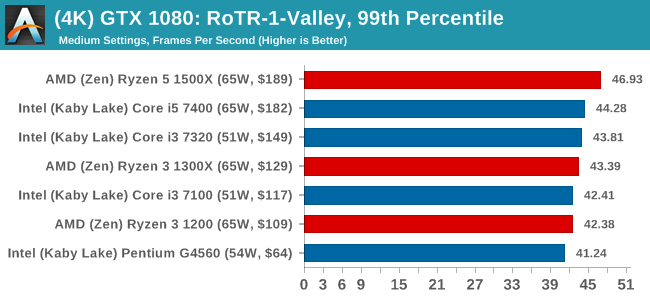
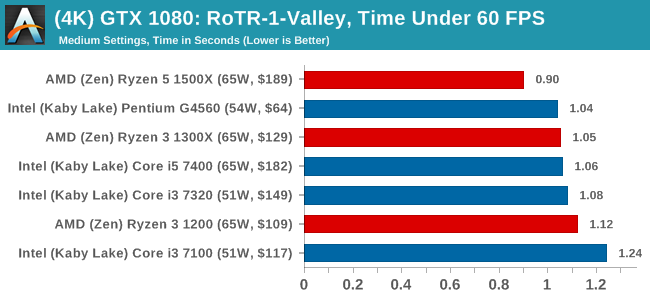
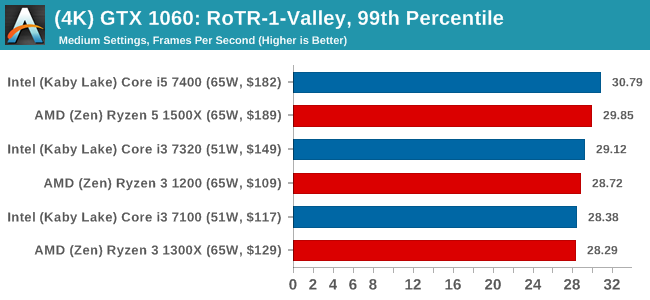
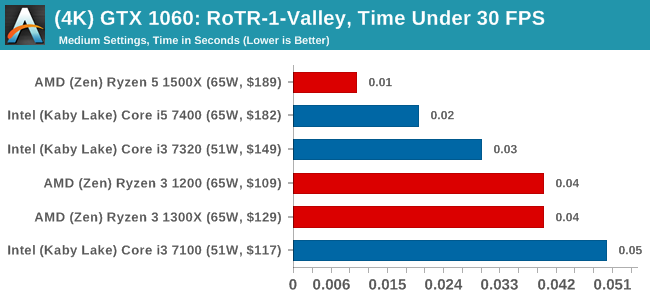
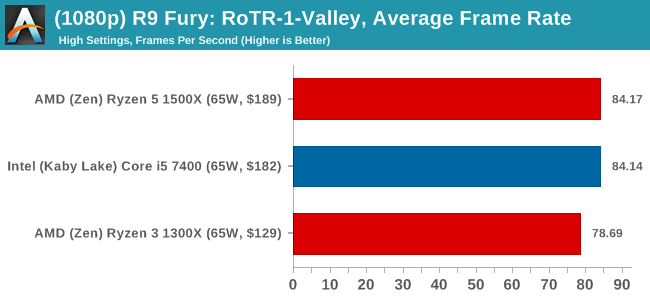
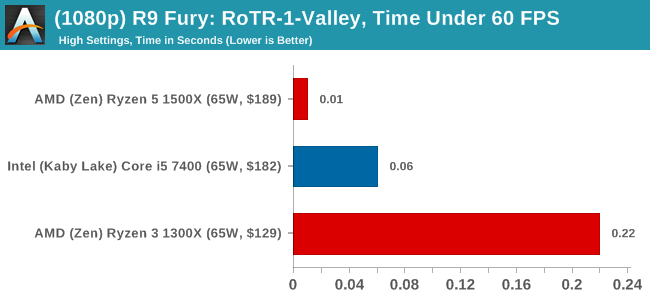
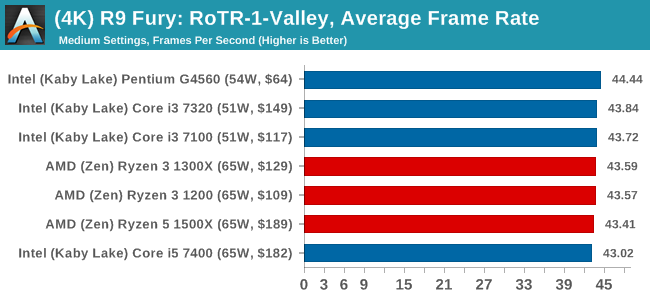
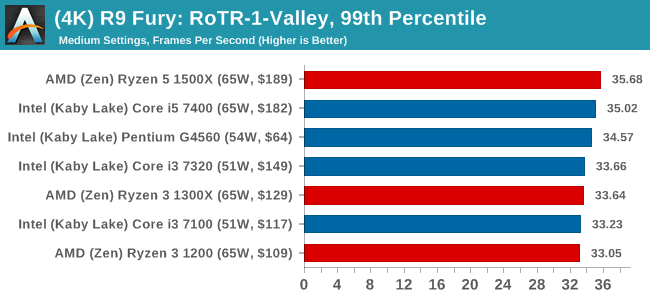
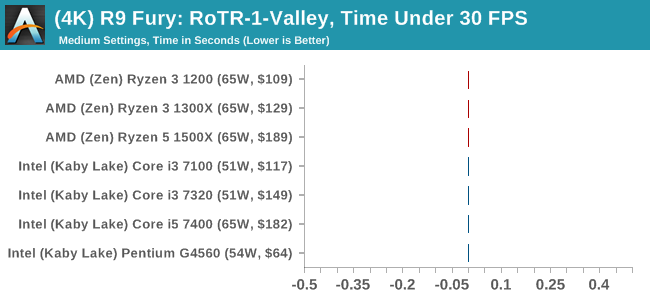
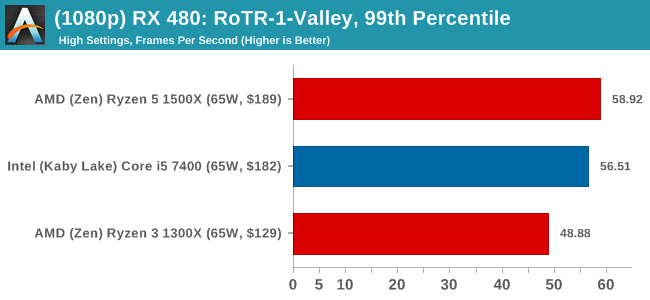
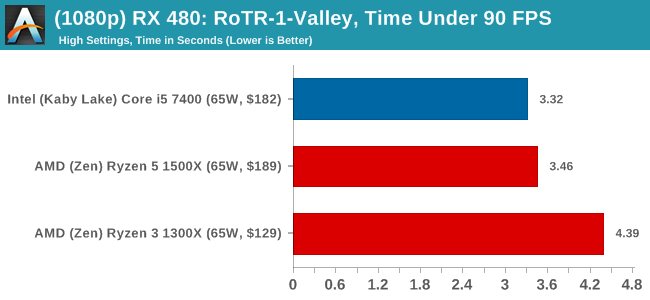
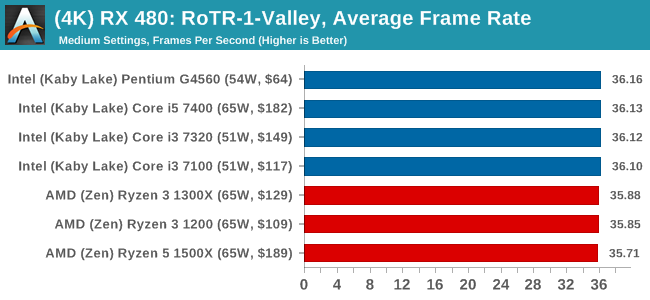
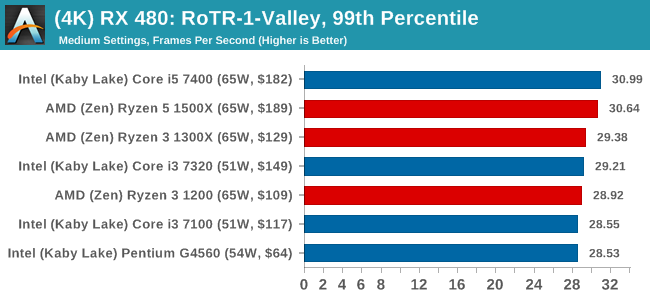
#1 Geothermal Valley
MSI GTX 1080 Gaming 8G Performance
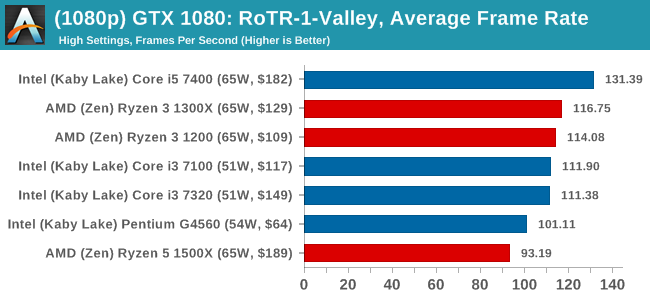
1080p
4K
ASUS GTX 1060 Strix 6GB Performance
1080p
4K
Sapphire R9 Fury 4GB Performance
1080p

4K
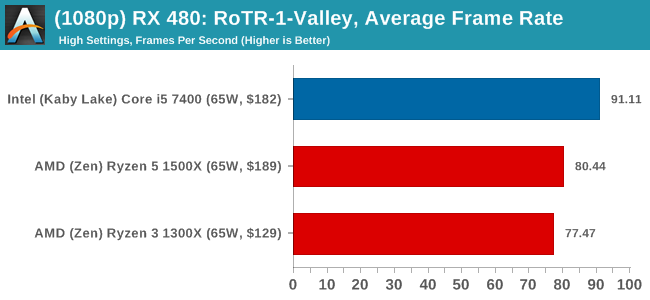
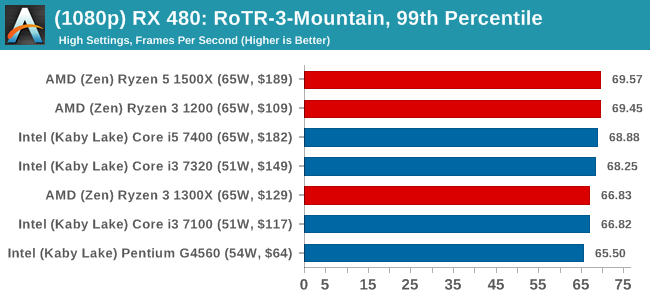
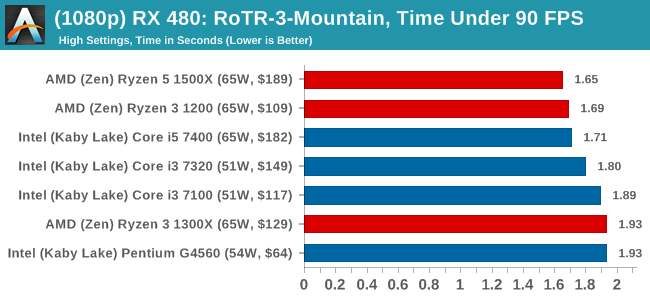
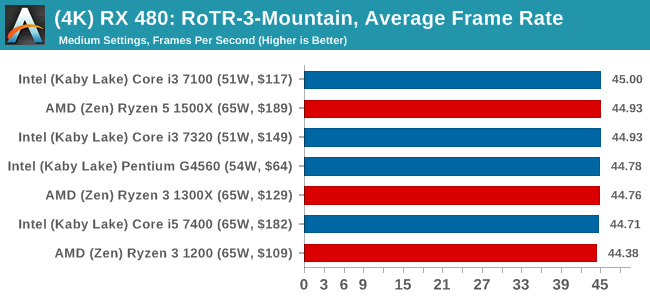
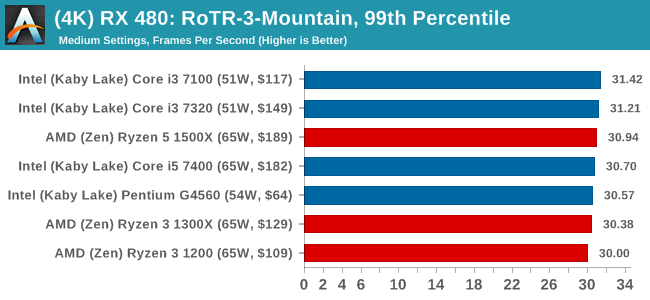
Sapphire RX 480 8GB Performance
1080p
4K

Geothermal Valley had some issues in our benchmark test suite, where the 1080p benchmark wouldn't output frame time data for the first section. The issue has been debugged from our end and future reviews should contain all the data.
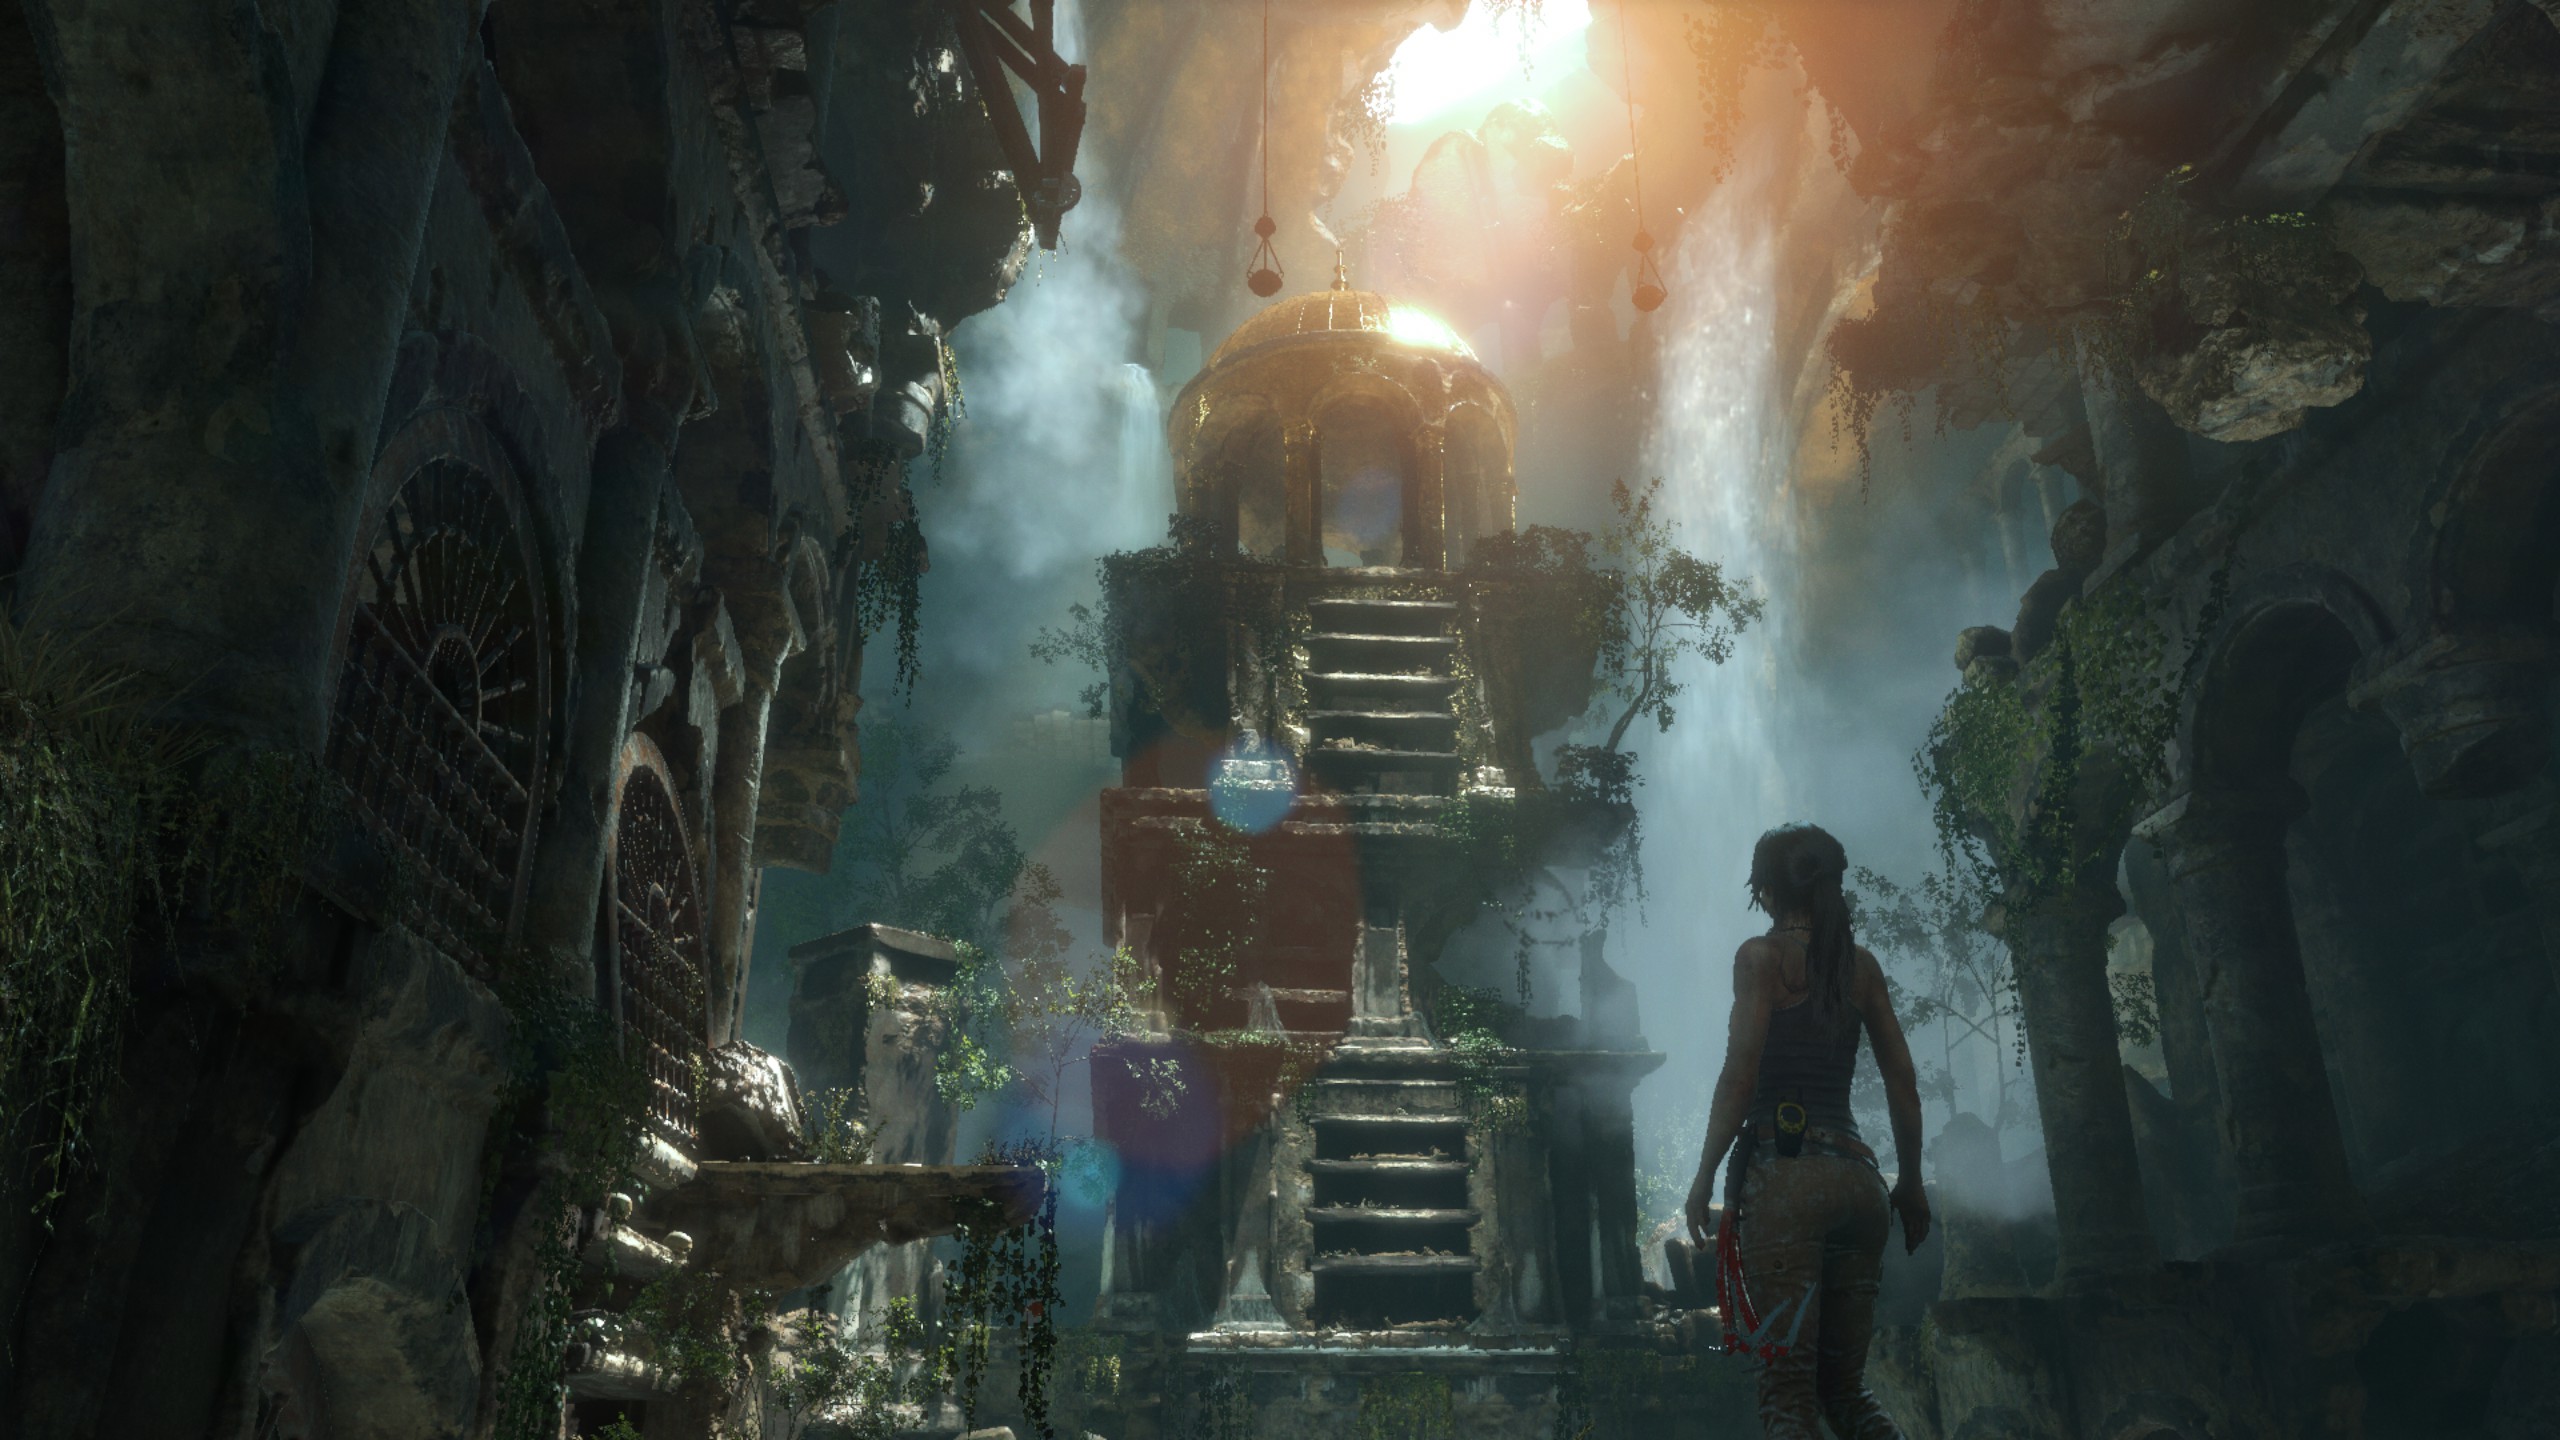
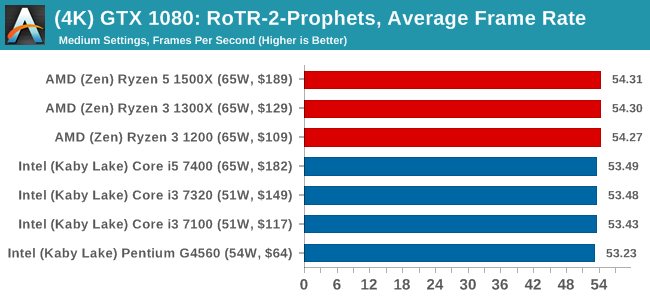
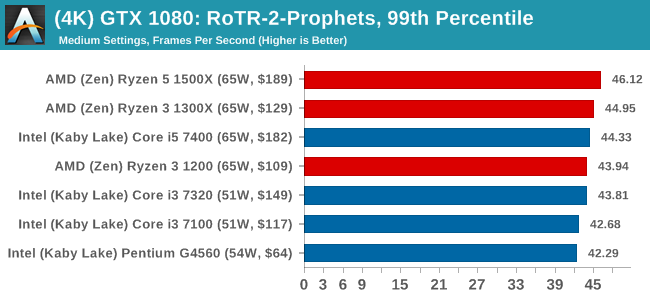
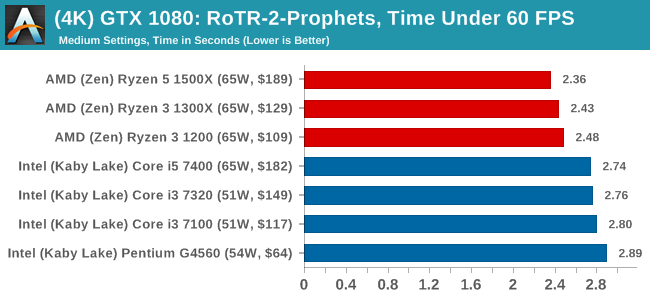
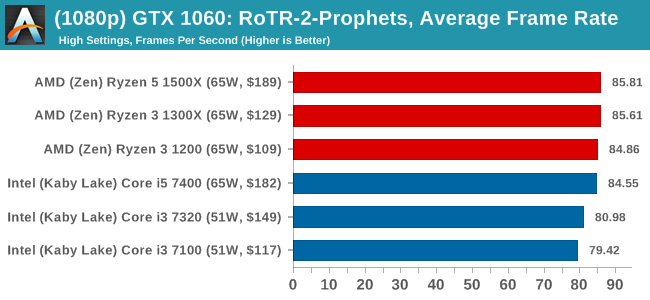
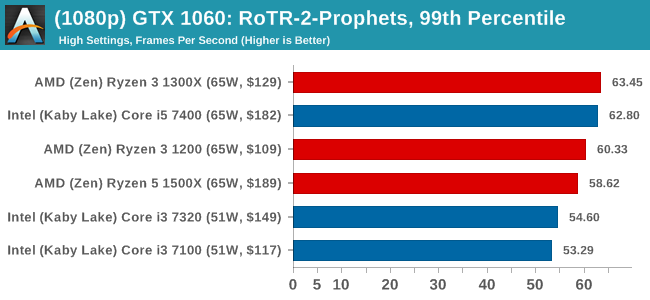
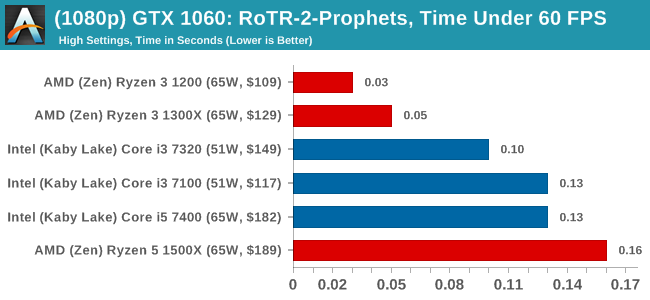
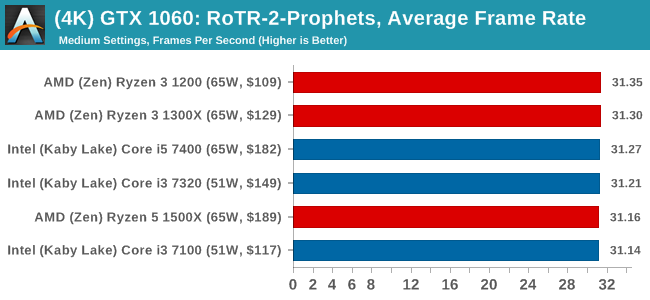
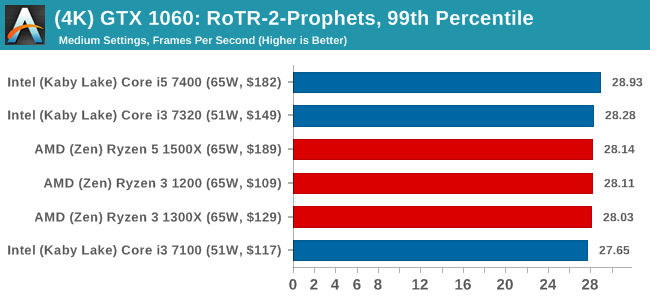
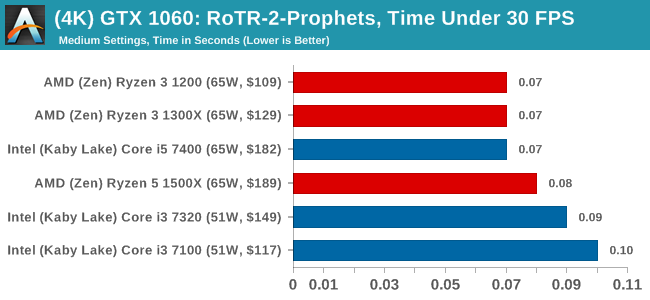
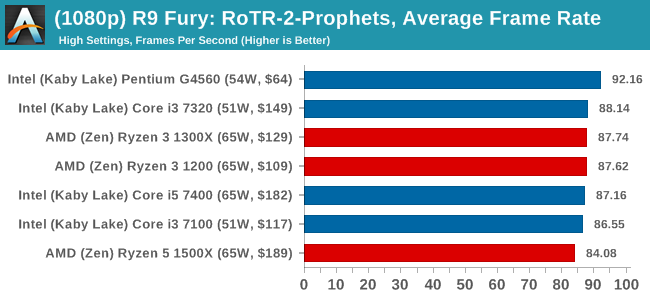
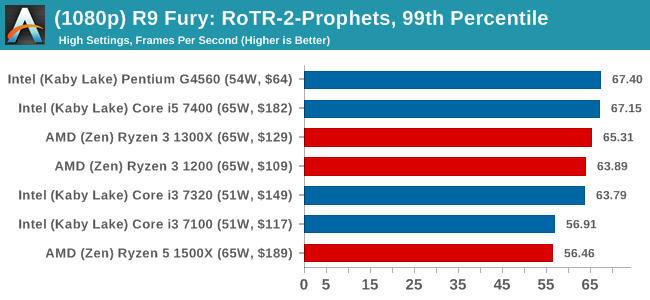
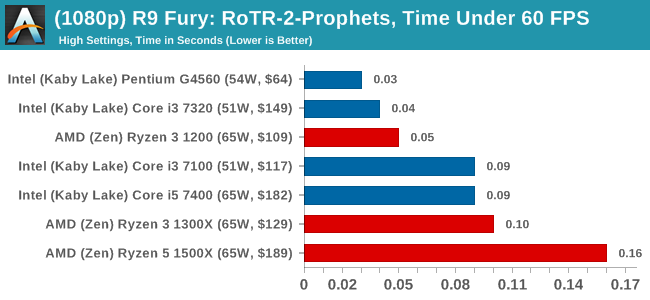
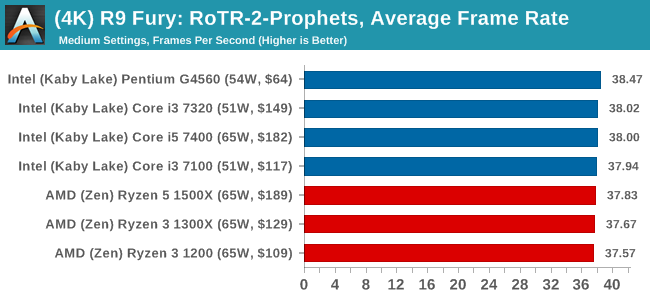
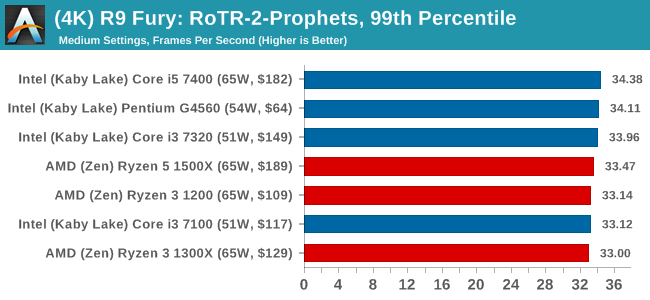
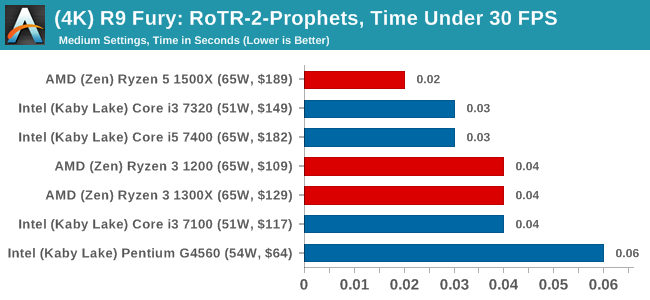
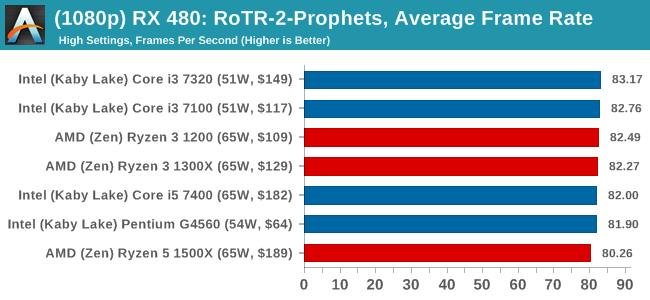
#2 Prophet's Tomb
MSI GTX 1080 Gaming 8G Performance
1080p
4K
ASUS GTX 1060 Strix 6GB Performance
1080p
4K
Sapphire R9 Fury 4GB Performance
1080p
4K
Sapphire RX 480 8GB Performance
1080p
4K
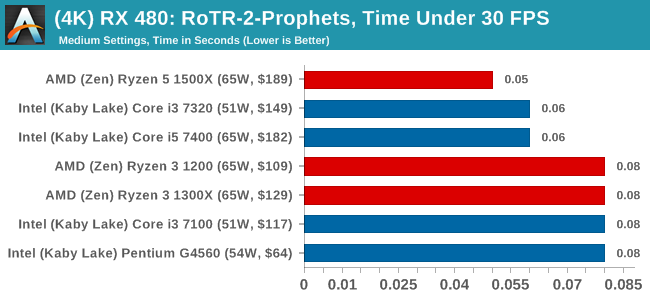
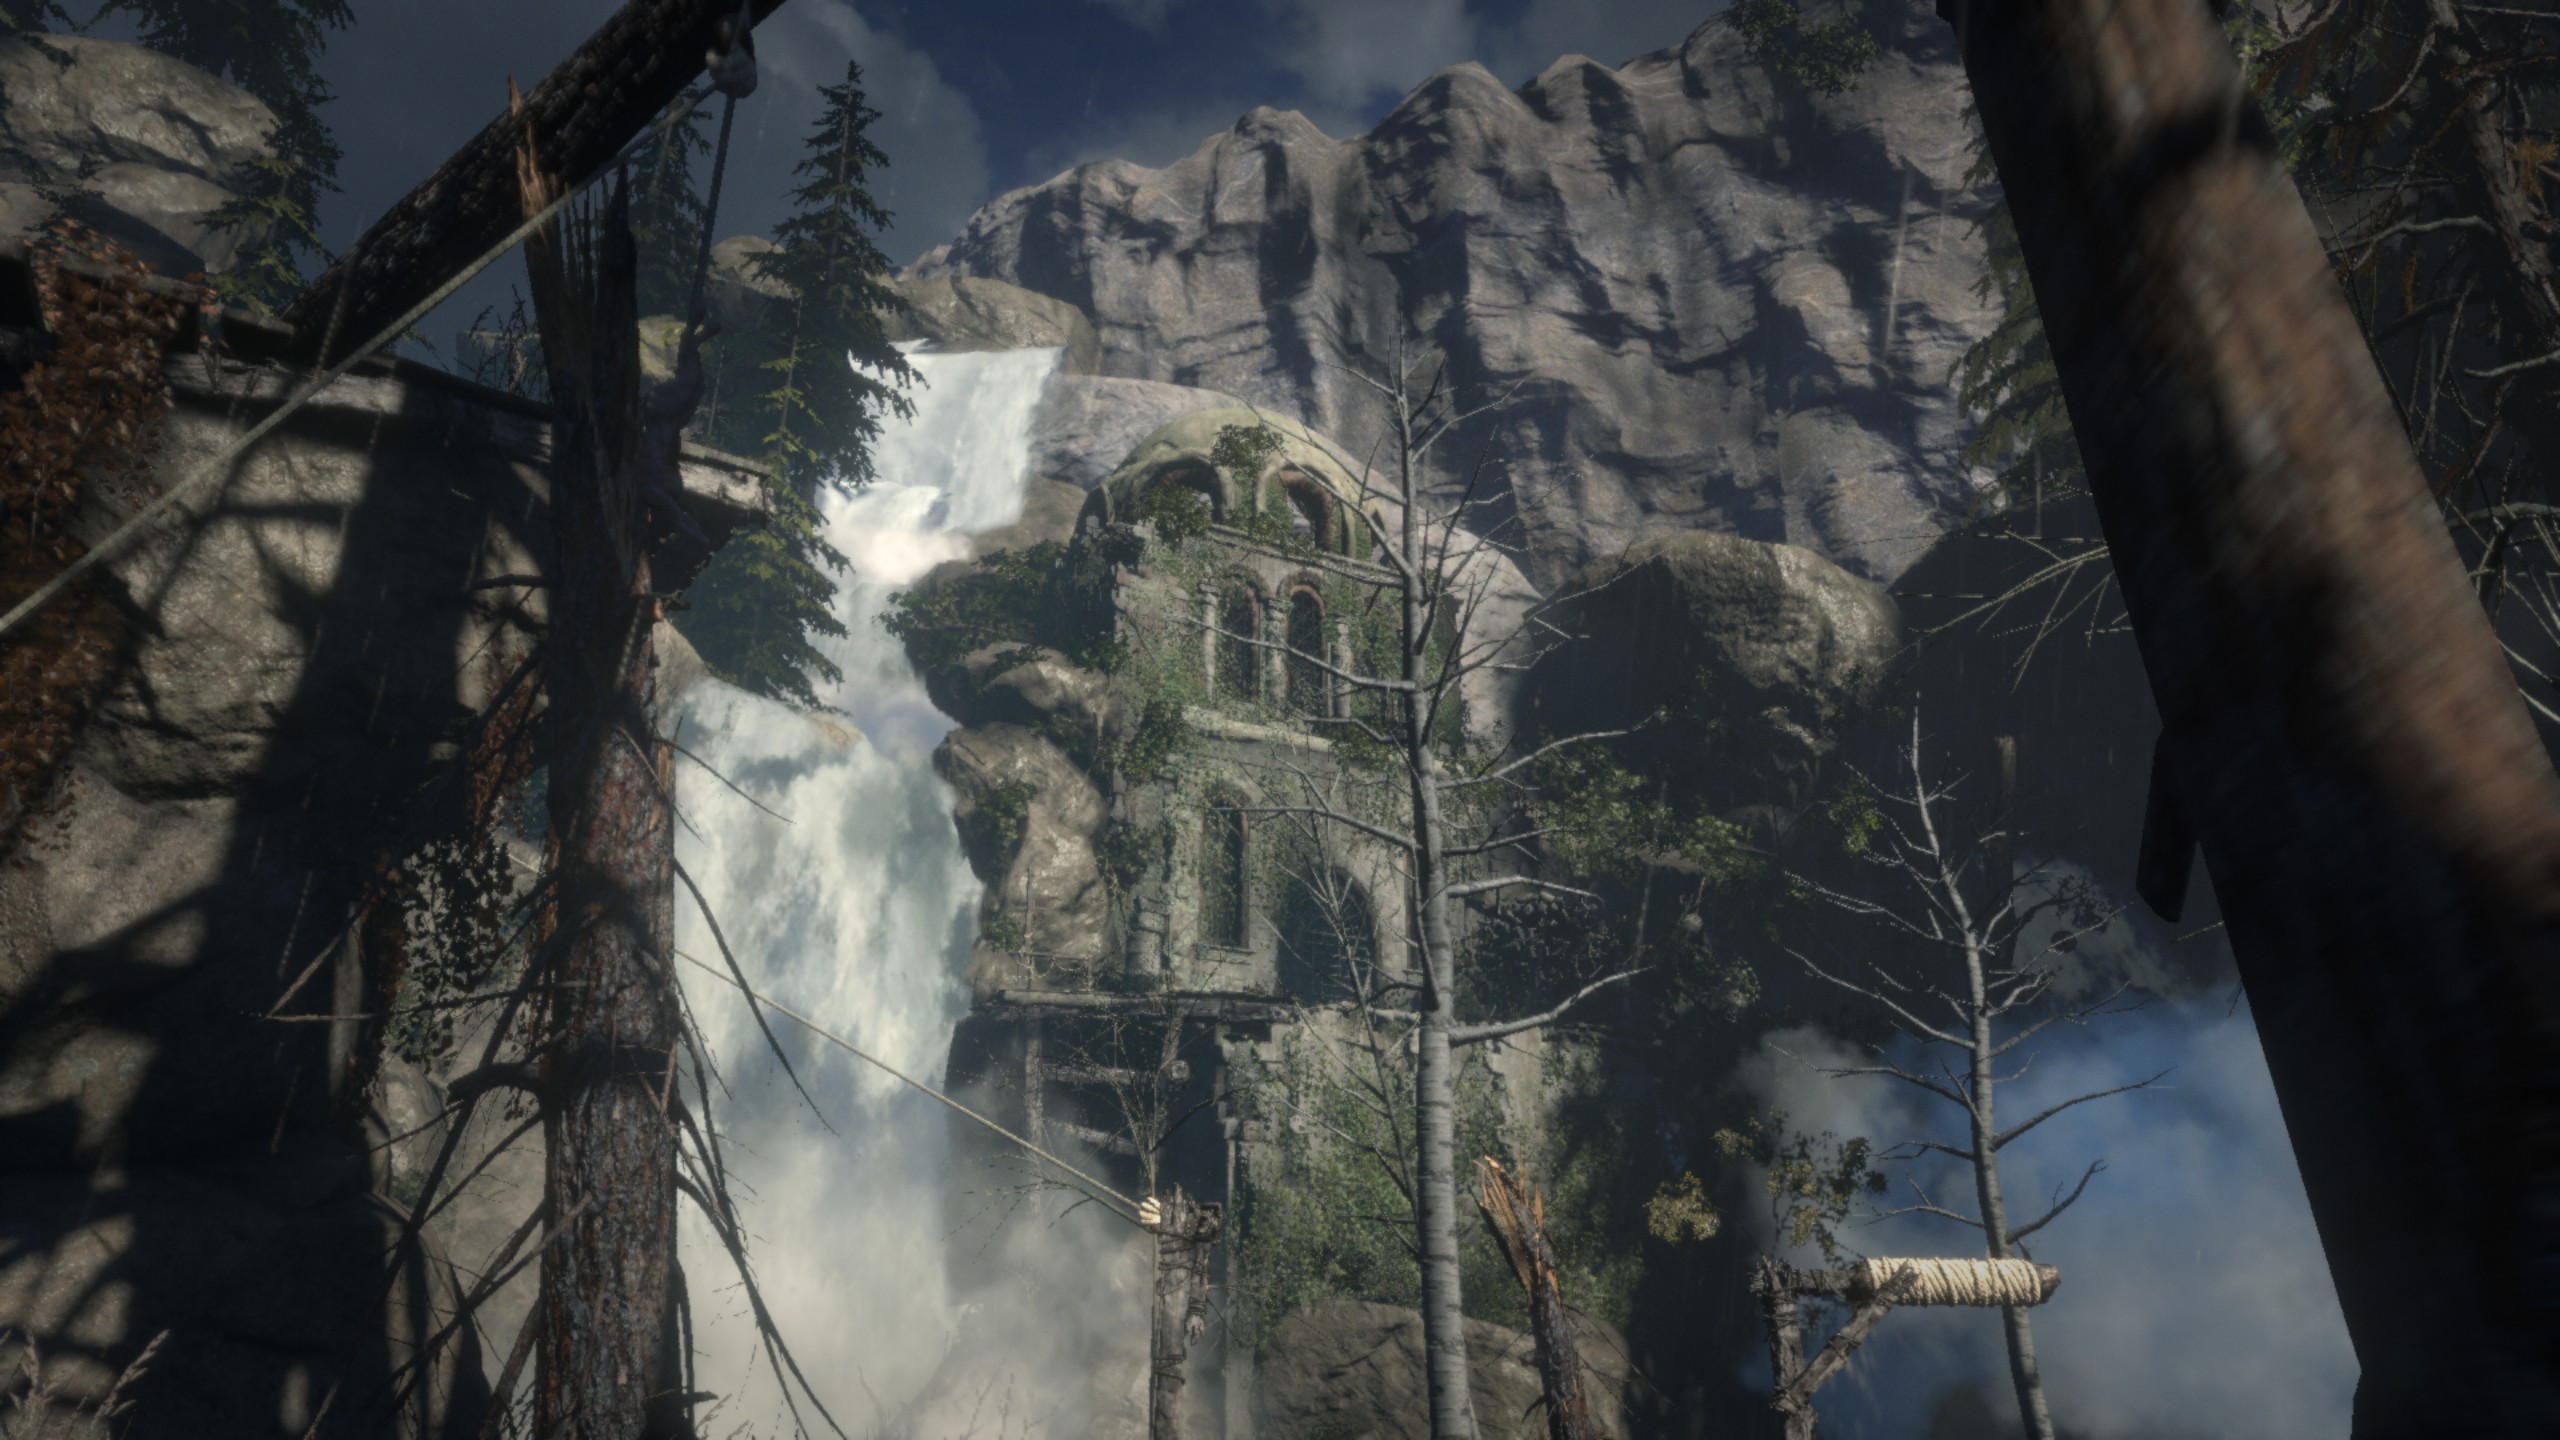
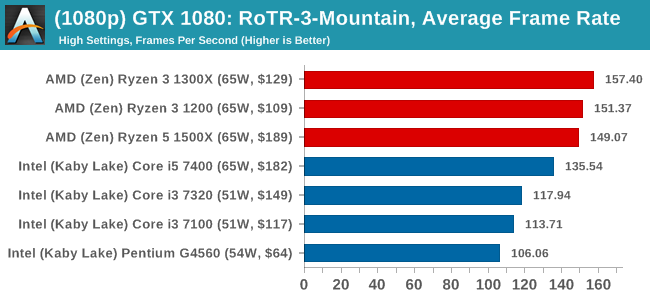
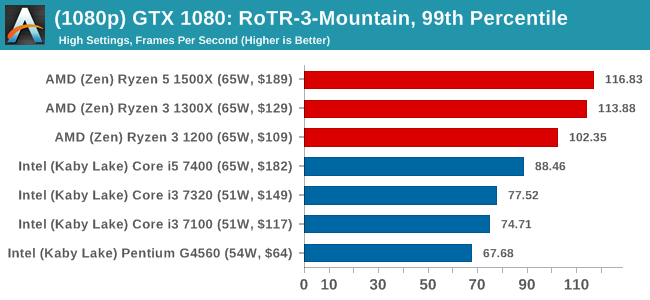
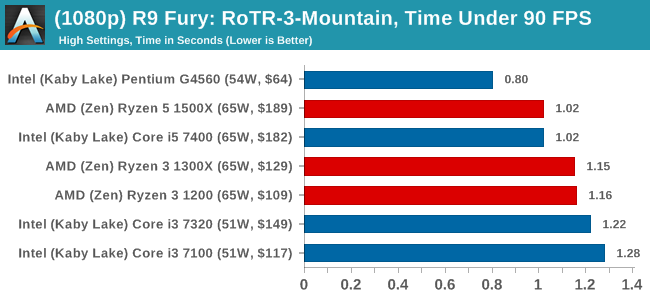
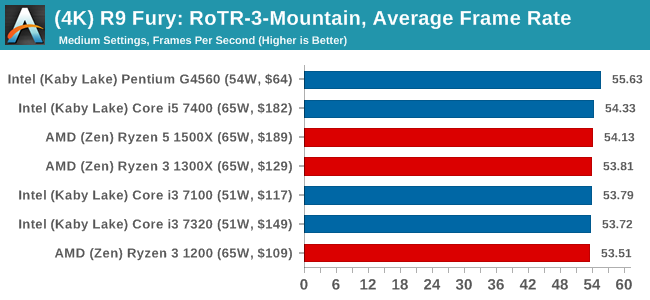
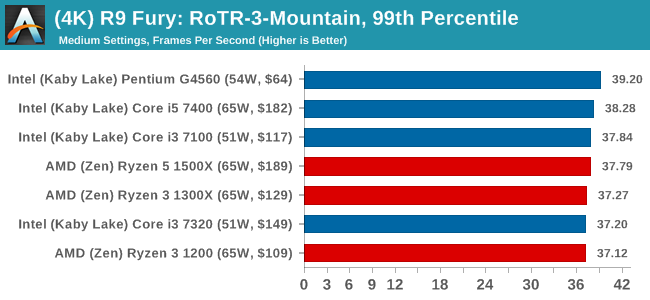
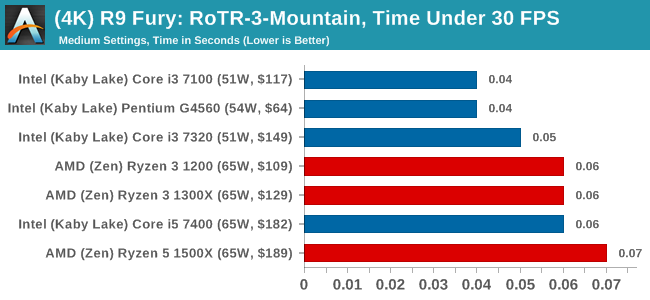
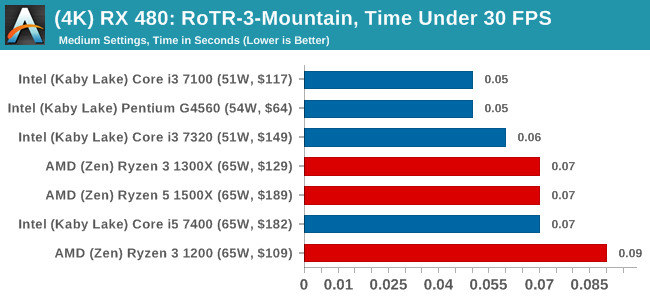
#3 Spine of the Mountain
MSI GTX 1080 Gaming 8G Performance
1080p
4K
ASUS GTX 1060 Strix 6GB Performance
1080p
4K
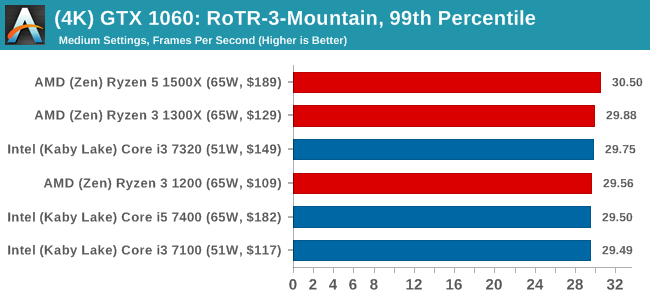
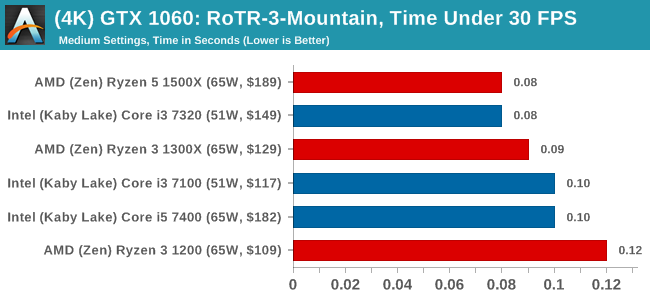
Sapphire R9 Fury 4GB Performance
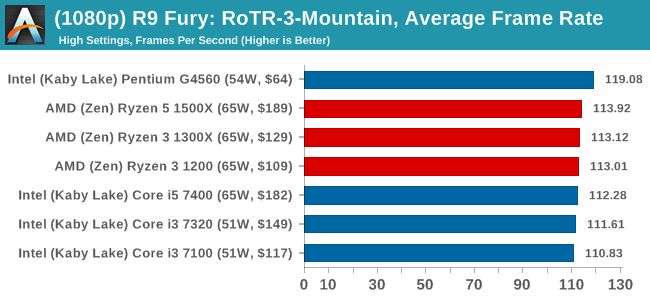
1080p
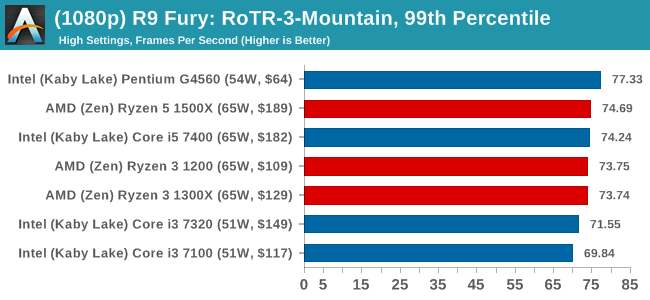
4K
Sapphire RX 480 8GB Performance

1080p
4K


140 Comments
View All Comments
CSM 2 - Friday, July 28, 2017 - link
1200 with A320 + GTX 1050ti perfect family pc or sff media pc I'm very impressed. Thanks AMD for some competitionslickr - Sunday, July 30, 2017 - link
They actually are releasing their APU's at the same time, so if you want cpu+igp you can buy their new APU's.MajGenRelativity - Thursday, July 27, 2017 - link
Could you add an overclocking section? I've been seeing the 1200 overclock well, and that could definitely close the gap with the i3'sIan Cutress - Thursday, July 27, 2017 - link
In the plans, maybe Pt 2 next week after finishing the 1300X.T1beriu - Thursday, July 27, 2017 - link
Yey!AndrewJacksonZA - Thursday, July 27, 2017 - link
"M." You're missing an "m" at the end of your username, T1beriu. ;-)MajGenRelativity - Thursday, July 27, 2017 - link
Awesome! I think overclocking is one of Ryzen's strong points, and it doesn't seem to drive up power consumption too much, because you can hit good clocks on stock voltageOxford Guy - Thursday, July 27, 2017 - link
Or, maybe we could see what happens without being kneecapped by the absurd JEDEC RAM setting.venkatsrin - Thursday, July 27, 2017 - link
Thanks, can only second this request! Pls, pretty pls, do include the overclocked benchmarks for gaming not only with high-end cards like GTX1080 but also the RX470 that you have in there currently.QinX - Thursday, July 27, 2017 - link
The Blender graph seems to be wrong for the 1300X, beating the 1500x by 500 seconds seems excessive.