The AMD Ryzen 3 1300X and Ryzen 3 1200 CPU Review: Zen on a Budget
by Ian Cutress on July 27, 2017 9:30 AM EST- Posted in
- CPUs
- AMD
- Zen
- Ryzen
- Ryzen 3
- Ryzen 3 1300X
- Ryzen 3 1200
Benchmarking Performance: CPU System Tests
Our first set of tests is our general system tests. These set of tests are meant to emulate more about what people usually do on a system, like opening large files or processing small stacks of data. This is a bit different to our office testing, which uses more industry standard benchmarks, and a few of the benchmarks here are relatively new and different.
All of our benchmark results can also be found in our benchmark engine, Bench.
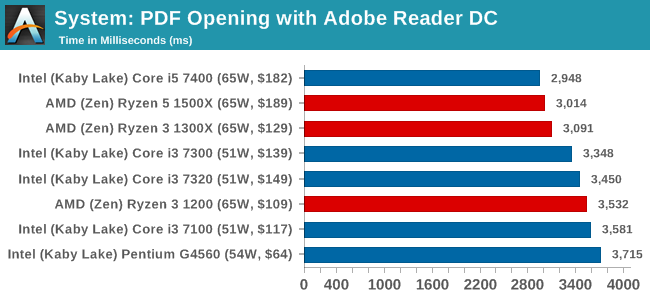
PDF Opening
First up is a self-penned test using a monstrous PDF we once received in advance of attending an event. While the PDF was only a single page, it had so many high-quality layers embedded it was taking north of 15 seconds to open and to gain control on the mid-range notebook I was using at the time. This put it as a great candidate for our 'let's open an obnoxious PDF' test. Here we use Adobe Reader DC, and disable all the update functionality within. The benchmark sets the screen to 1080p, opens the PDF to in fit-to-screen mode, and measures the time from sending the command to open the PDF until it is fully displayed and the user can take control of the software again. The test is repeated ten times, and the average time taken. Results are in milliseconds.
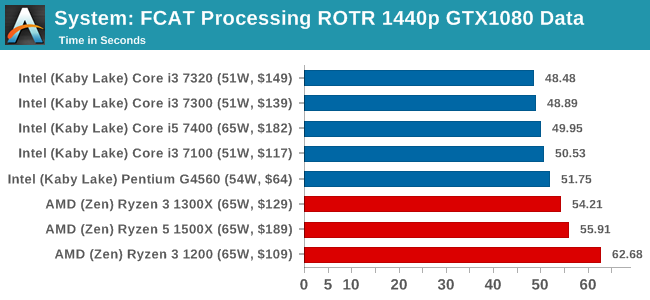
FCAT Processing: link
One of the more interesting workloads that has crossed our desks in recent quarters is FCAT - the tool we use to measure stuttering in gaming due to dropped or runt frames. The FCAT process requires enabling a color-based overlay onto a game, recording the gameplay, and then parsing the video file through the analysis software. The software is mostly single-threaded, however because the video is basically in a raw format, the file size is large and requires moving a lot of data around. For our test, we take a 90-second clip of the Rise of the Tomb Raider benchmark running on a GTX 980 Ti at 1440p, which comes in around 21 GB, and measure the time it takes to process through the visual analysis tool.
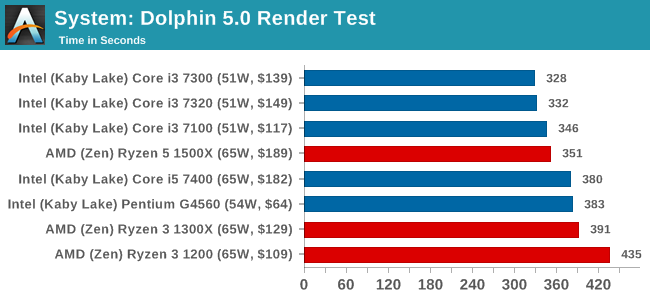
Dolphin Benchmark: link
Many emulators are often bound by single thread CPU performance, and general reports tended to suggest that Haswell provided a significant boost to emulator performance. This benchmark runs a Wii program that ray traces a complex 3D scene inside the Dolphin Wii emulator. Performance on this benchmark is a good proxy of the speed of Dolphin CPU emulation, which is an intensive single core task using most aspects of a CPU. Results are given in minutes, where the Wii itself scores 17.53 minutes.
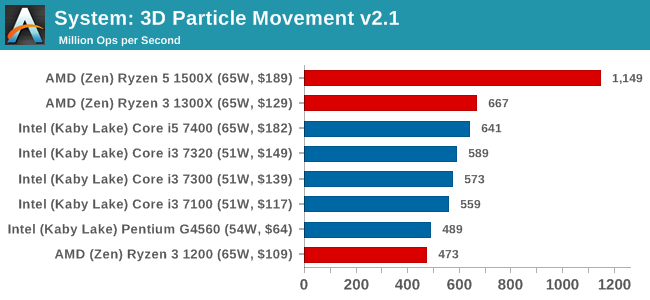
3D Movement Algorithm Test v2.1: link
This is the latest version of the self-penned 3DPM benchmark. The goal of 3DPM is to simulate semi-optimized scientific algorithms taken directly from my doctorate thesis. Version 2.1 improves over 2.0 by passing the main particle structs by reference rather than by value, and decreasing the amount of double->float->double recasts the compiler was adding in. It affords a ~25% speed-up over v2.0, which means new data.
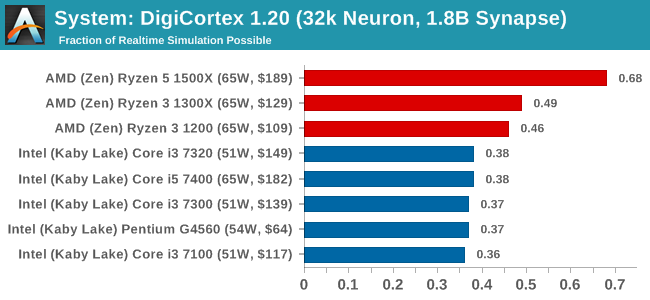
DigiCortex v1.20: link
Despite being a couple of years old, the DigiCortex software is a pet project for the visualization of neuron and synapse activity in the brain. The software comes with a variety of benchmark modes, and we take the small benchmark which runs a 32k neuron/1.8B synapse simulation. The results on the output are given as a fraction of whether the system can simulate in real-time, so anything above a value of one is suitable for real-time work. The benchmark offers a 'no firing synapse' mode, which in essence detects DRAM and bus speed, however we take the firing mode which adds CPU work with every firing.
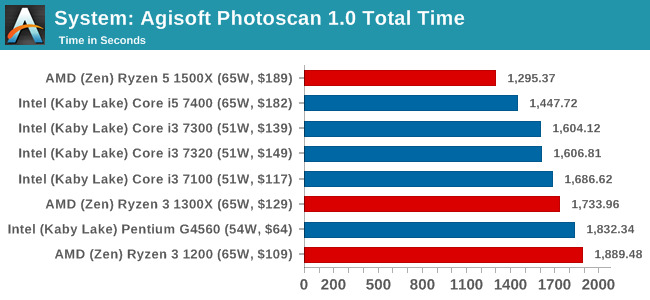
Agisoft Photoscan 1.0: link
Photoscan stays in our benchmark suite from the previous version, however now we are running on Windows 10 so features such as Speed Shift on the latest processors come into play. The concept of Photoscan is translating many 2D images into a 3D model - so the more detailed the images, and the more you have, the better the model. The algorithm has four stages, some single threaded and some multi-threaded, along with some cache/memory dependency in there as well. For some of the more variable threaded workload, features such as Speed Shift and XFR will be able to take advantage of CPU stalls or downtime, giving sizeable speedups on newer microarchitectures.


140 Comments
View All Comments
Teknobug - Friday, July 28, 2017 - link
Guess the Rzyen 3 1300X isn't much of an upgrade over my other PC which is i5 3550 (OC'd to 3.9GHz) system then.jamyryals - Friday, July 28, 2017 - link
It's great to have some competition going on again!Mumrik - Friday, July 28, 2017 - link
If you run a 0% line horizontally through a graph like you do on page 17, and especially if it actually moves around a bit from graph to graph, I'd suggest making that line thicker than the others.harobikes333 - Saturday, July 29, 2017 - link
AMD pretty much has all the CPU segments covered <3Planning on a build soon!
LostPassword - Sunday, July 30, 2017 - link
i know a lot of people will say it doesn't matter. but the beauty about these ryzen 3 is that they are unlocked. i see alot of youtubers hit 3.7-3.8ghz on stock cooler.Oxford Guy - Wednesday, August 2, 2017 - link
Tom's Hardware used 3200 RAM for its review. I suggest reading that one because it paints a different picture than this one which uses slow RAM.Mugur - Thursday, August 3, 2017 - link
I think the author missed the point with this review: Ryzen 3 is obviously targeted towards gaming to a very tight budget, not B2B, not Enterprise, not Office, etc...Of course, this doesn't mean that certain cpu benchmarks shouldn't be used, but the test bed should definitely include overclocking (using the included Stealth cooler) and 3200 Mhz RAM (I wonder about AGESA 1006?). I don't care as much for "normalizing" benchmarks and Anandtech bench (a useful tool though), but just make me see how those 2 cpus are performing in the kind of environment they will be used. And add 2 entry level cards like RX 560 and GTX 1050/Ti; I know the reason about using a high end graphics card and I agree on paper, but this is not how those cpus will be used. It's an academical exercise.
Not everything should be a PhD dissertation, especially for this low level, budget components. If I have to reconmmend someone a cheap gaming machine I need to know whether a Ryzen 1200@3.9 Ghz + 8 GB 3200 DDR4 + RX 560 4 GB is a viable option (or not), better than a G4560 + 8 GB 2400 + GTX 1050 for example, especially in the long run.
Oxford Guy - Friday, August 11, 2017 - link
Worrying about RAM speed when you're using a low-grade GPU is unwise. You'll be very GPU-limited most of the time.No, what this review needed was 3200 RAM plus relevant GPUs. At the very least the 3000 speed RAM in the machine they tested with shouldn't have been heavily downclocked.
chiname - Saturday, November 18, 2017 - link
This actually depends on where you live.I did a pc a week ago.It's just an small entry level pc for kids to play some games.The price to performance was favoring AMD.I really wouldve liked to get an intel i3 7100 but the cost was higher than the 1200 amd.So hench we went with amd.Complete amd pc cost 6.5k include gfx card.intel wouldve cost us over 8k.
John_M - Sunday, April 29, 2018 - link
"We’re still working through our gaming testing as this review goes live, and we’ll add graphs for that in a bit."I've read that so often on this site but the promise is seldom fulfilled.