The AMD Ryzen 3 1300X and Ryzen 3 1200 CPU Review: Zen on a Budget
by Ian Cutress on July 27, 2017 9:30 AM EST- Posted in
- CPUs
- AMD
- Zen
- Ryzen
- Ryzen 3
- Ryzen 3 1300X
- Ryzen 3 1200
Rise of the Tomb Raider
One of the newest games in the gaming benchmark suite is Rise of the Tomb Raider (RoTR), developed by Crystal Dynamics, and the sequel to the popular Tomb Raider which was loved for its automated benchmark mode. But don’t let that fool you: the benchmark mode in RoTR is very much different this time around.
Visually, the previous Tomb Raider pushed realism to the limits with features such as TressFX, and the new RoTR goes one stage further when it comes to graphics fidelity. This leads to an interesting set of requirements in hardware: some sections of the game are typically GPU limited, whereas others with a lot of long-range physics can be CPU limited, depending on how the driver can translate the DirectX 12 workload.
Where the old game had one benchmark scene, the new game has three different scenes with different requirements: Geothermal Valley (1-Valley), Prophet’s Tomb (2-Prophet) and Spine of the Mountain (3-Mountain) - and we test all three. These are three scenes designed to be taken from the game, but it has been noted that scenes like 2-Prophet shown in the benchmark can be the most CPU limited elements of that entire level, and the scene shown is only a small portion of that level. Because of this, we report the results for each scene on each graphics card separately.

Graphics options for RoTR are similar to other games in this type, offering some presets or allowing the user to configure texture quality, anisotropic filter levels, shadow quality, soft shadows, occlusion, depth of field, tessellation, reflections, foliage, bloom, and features like PureHair which updates on TressFX in the previous game.
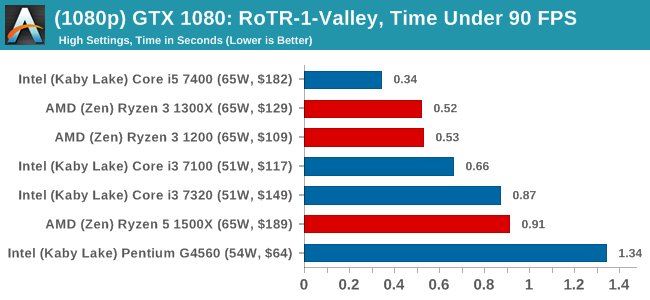
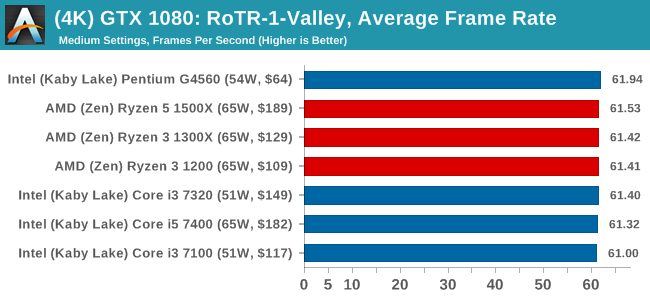
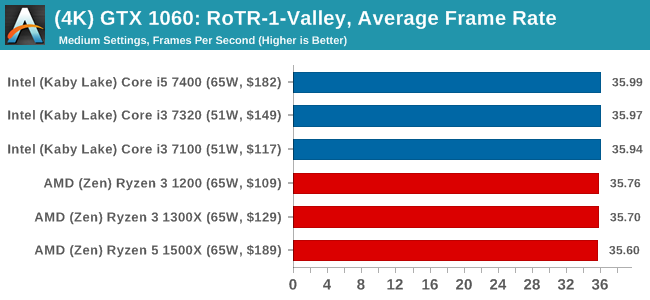
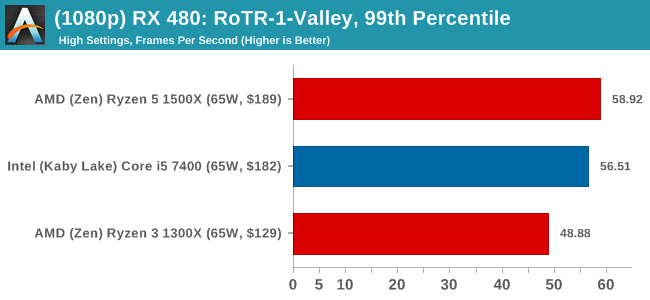
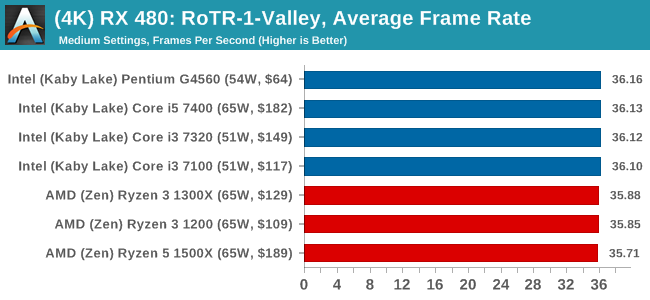
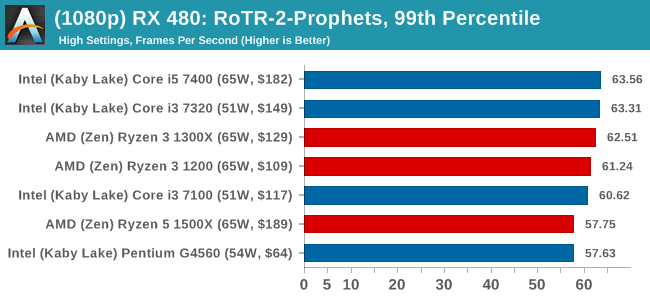
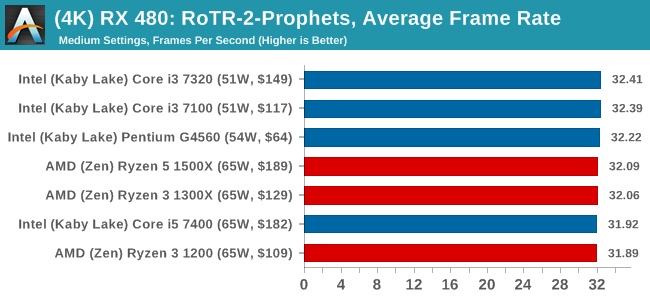
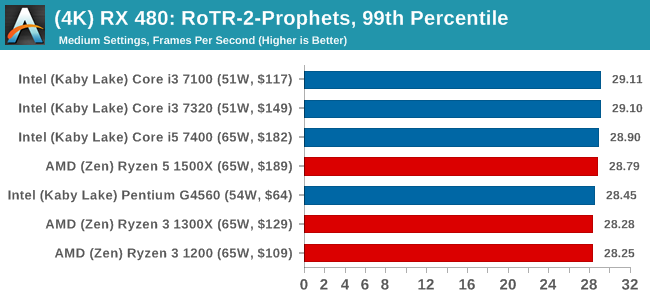
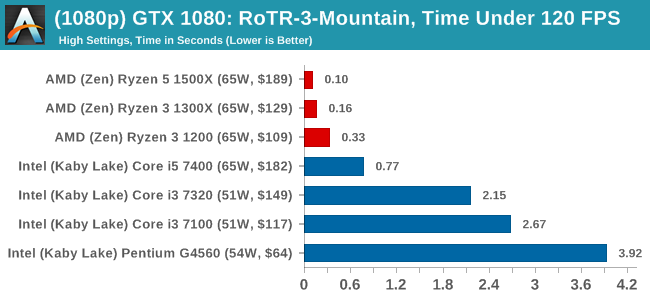
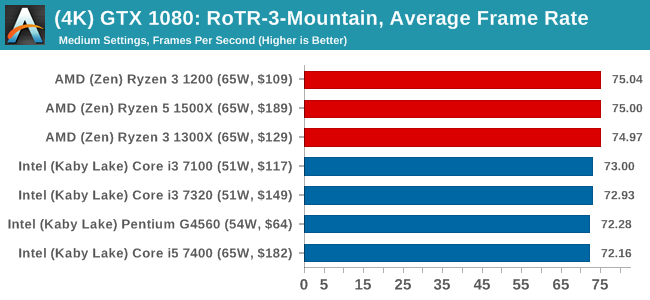
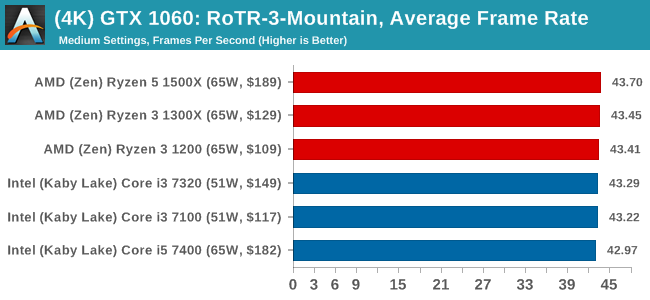
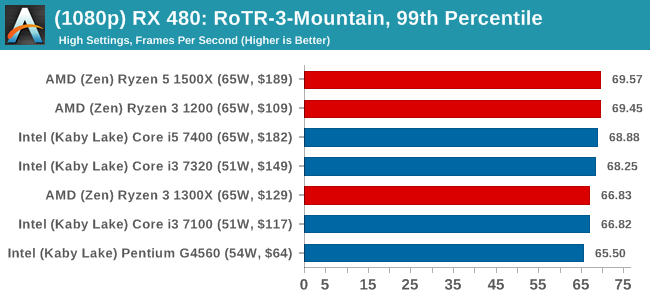
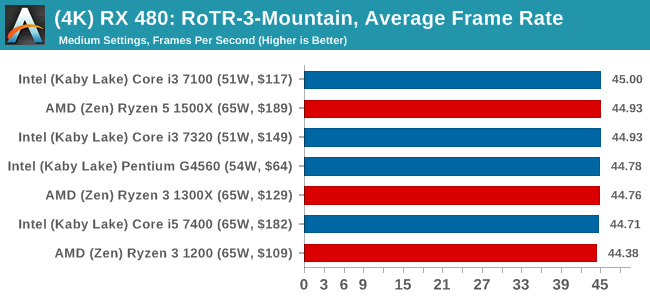
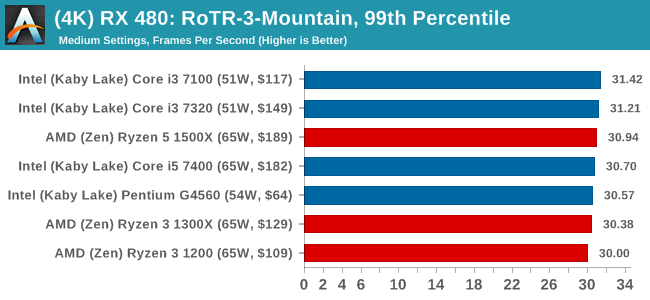
Again, we test at 1920x1080 and 4K using our native 4K displays. At 1080p we run the High preset, while at 4K we use the Medium preset which still takes a sizable hit in frame rate.
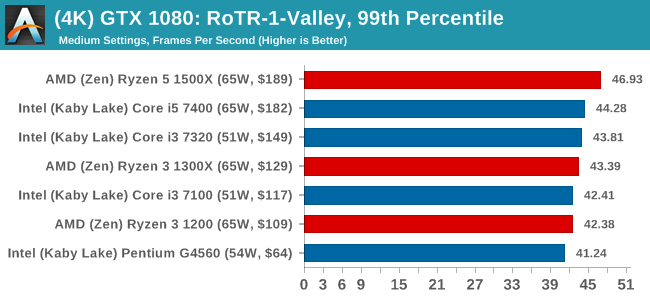
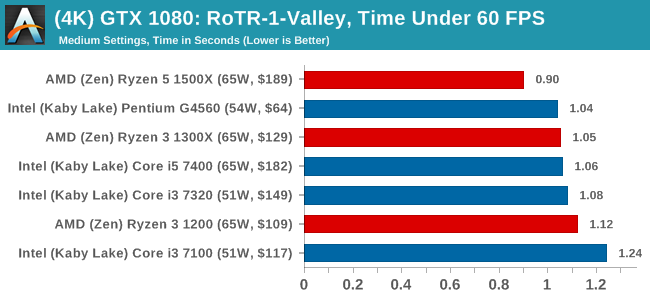
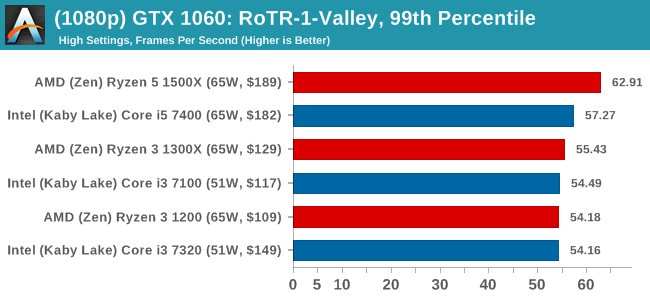
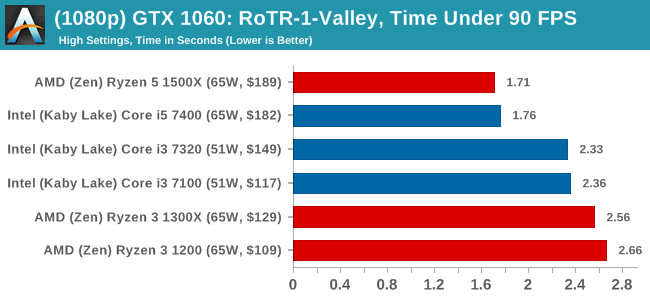
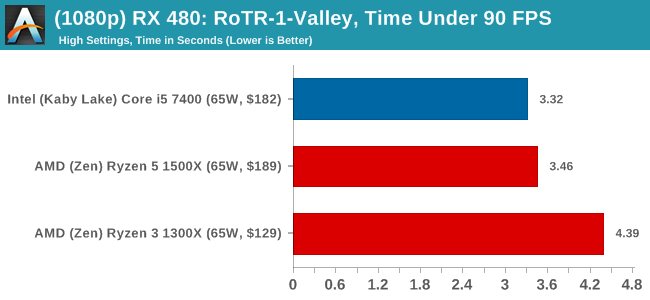
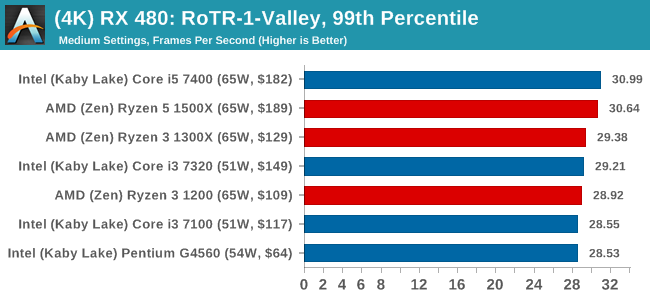
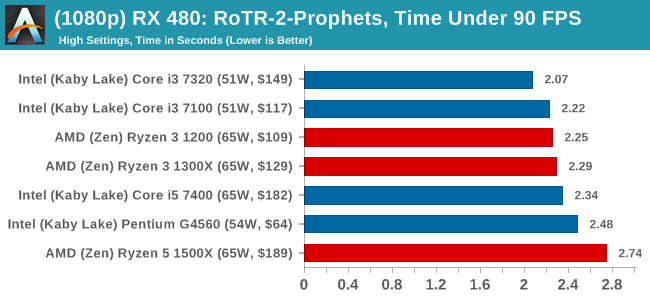
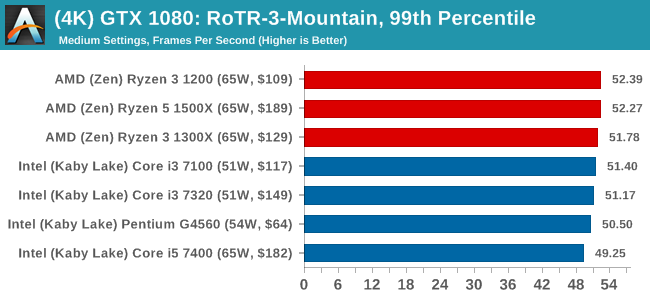
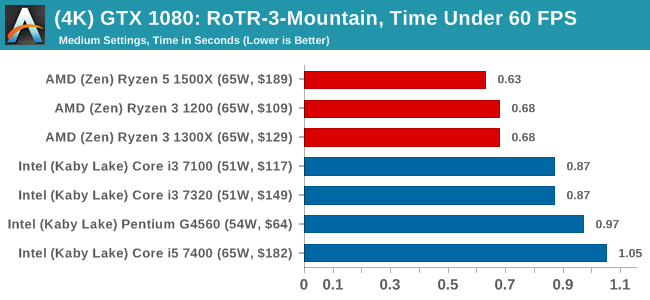
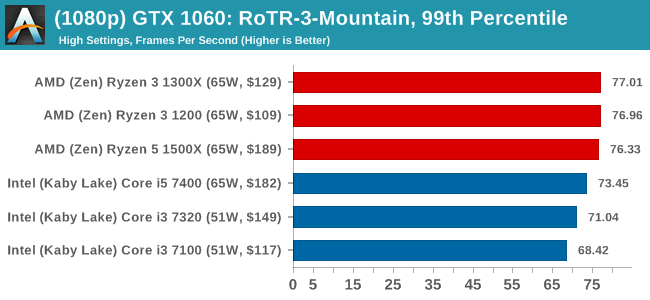
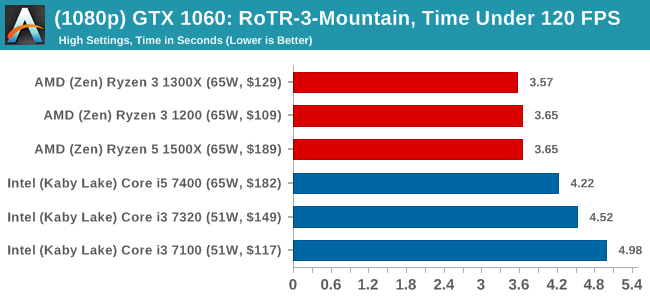
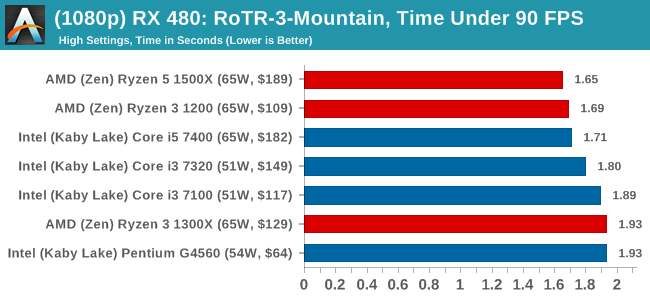
It is worth noting that RoTR is a little different to our other benchmarks in that it keeps its graphics settings in the registry rather than a standard ini file, and unlike the previous TR game the benchmark cannot be called from the command-line. Nonetheless we scripted around these issues to automate the benchmark four times and parse the results. From the frame time data, we report the averages, 99th percentiles, and our time under analysis.
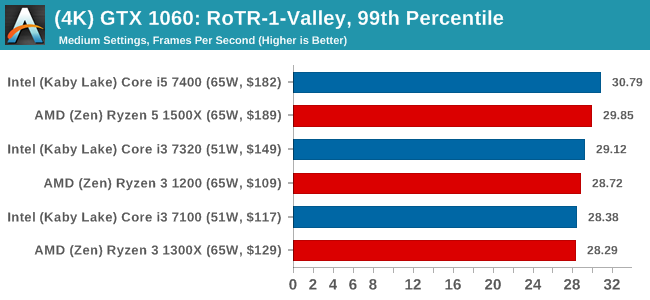
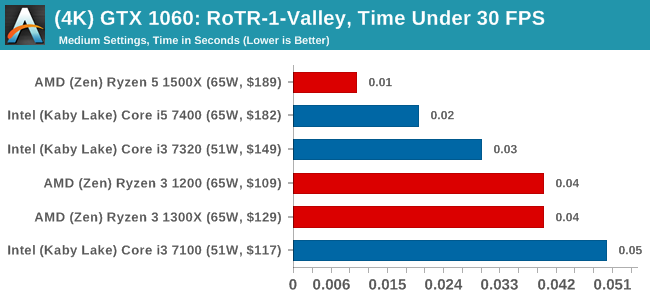
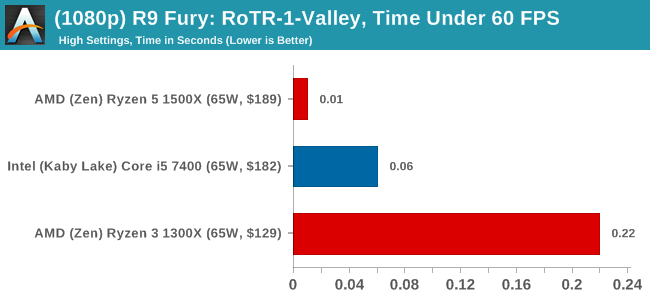
For all our results, we show the average frame rate at 1080p first. Mouse over the other graphs underneath to see 99th percentile frame rates and 'Time Under' graphs, as well as results for other resolutions. All of our benchmark results can also be found in our benchmark engine, Bench.
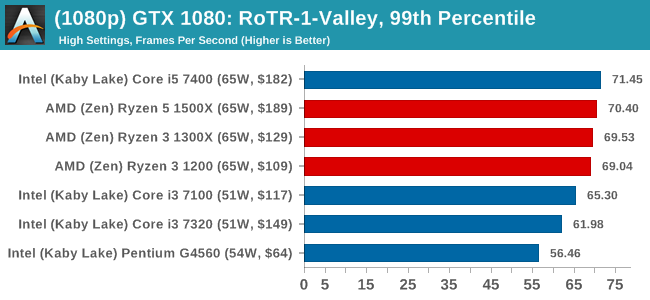
#1 Geothermal Valley
MSI GTX 1080 Gaming 8G Performance
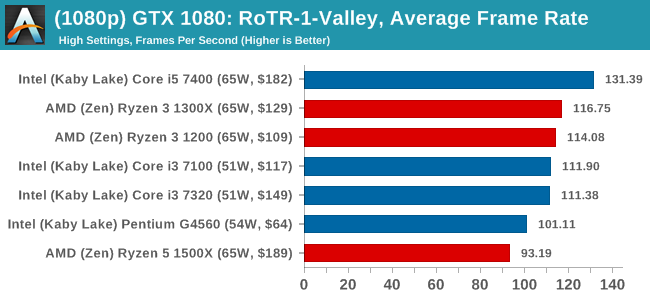
1080p
4K
ASUS GTX 1060 Strix 6GB Performance
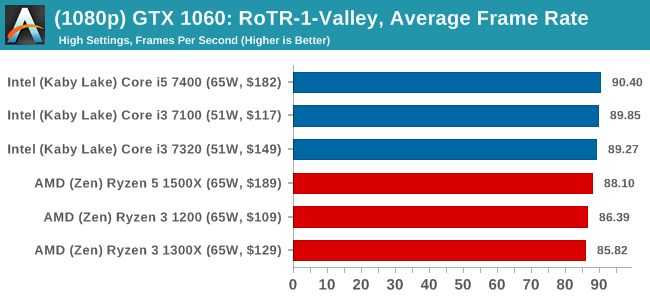
1080p
4K
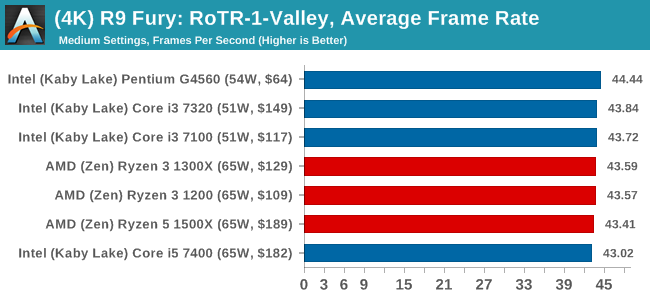
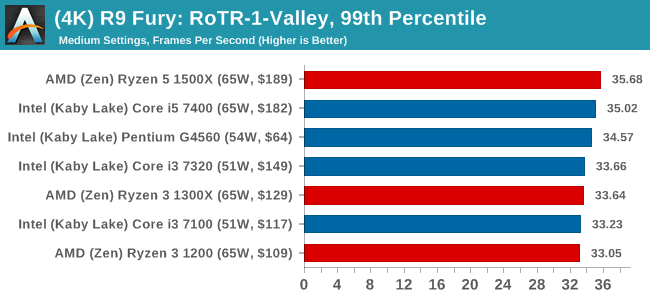
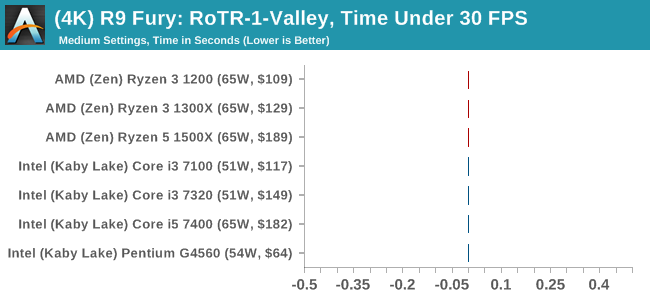
Sapphire R9 Fury 4GB Performance
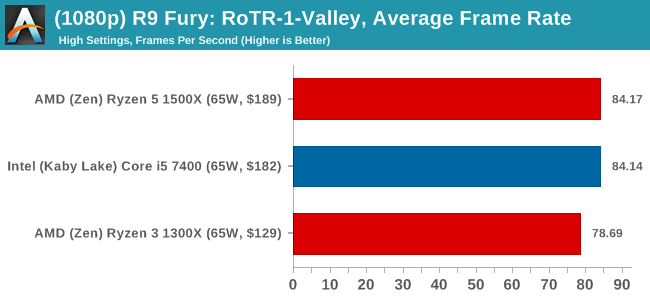
1080p

4K
Sapphire RX 480 8GB Performance
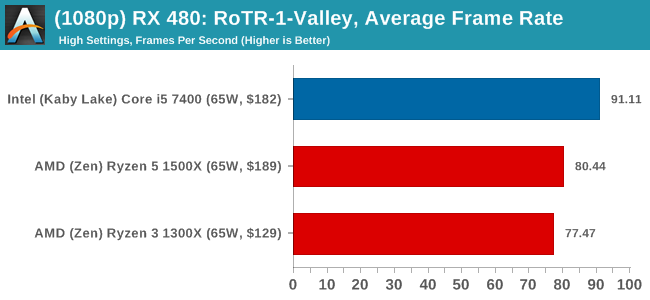
1080p
4K

Geothermal Valley had some issues in our benchmark test suite, where the 1080p benchmark wouldn't output frame time data for the first section. The issue has been debugged from our end and future reviews should contain all the data.
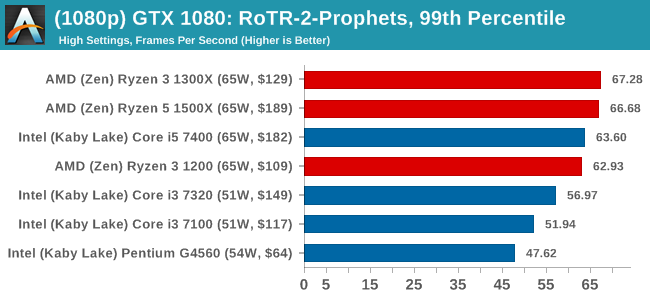
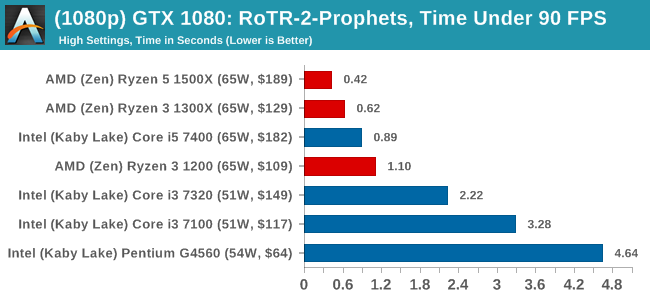
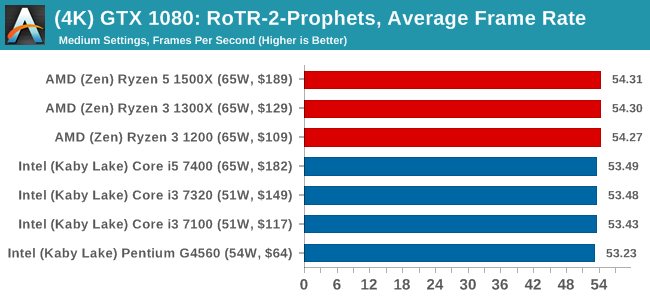
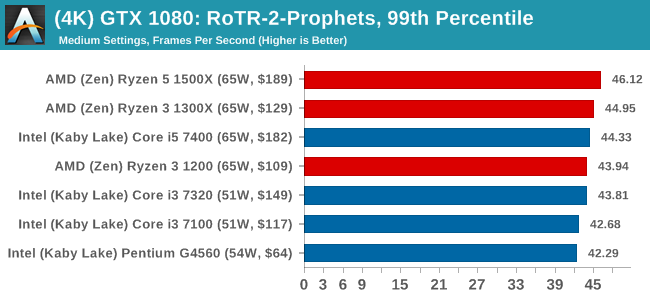
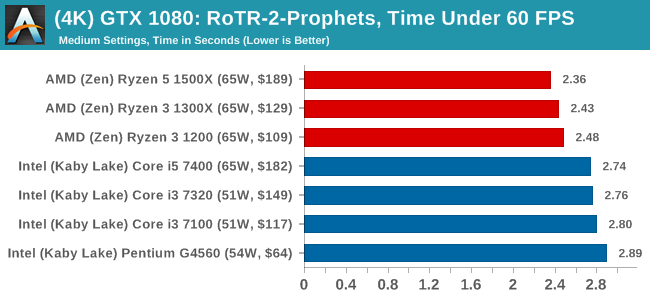
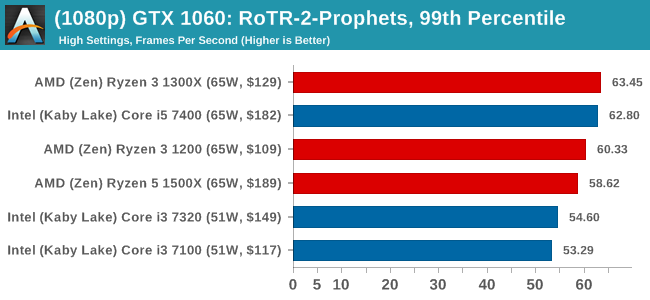
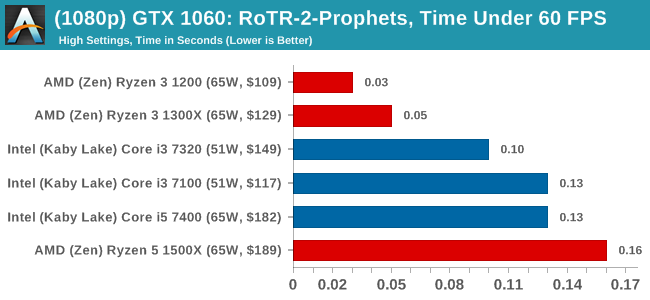
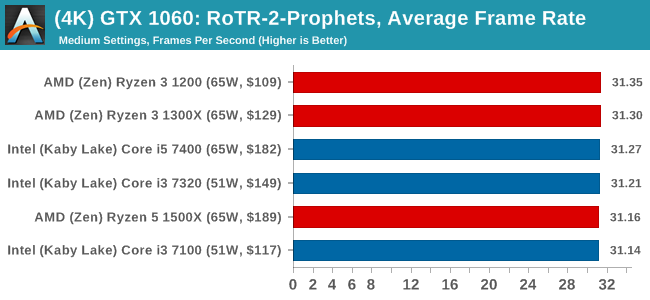
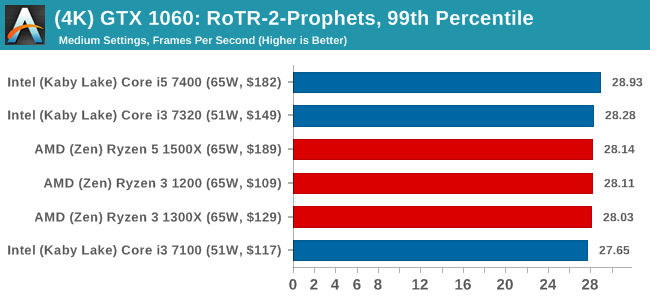
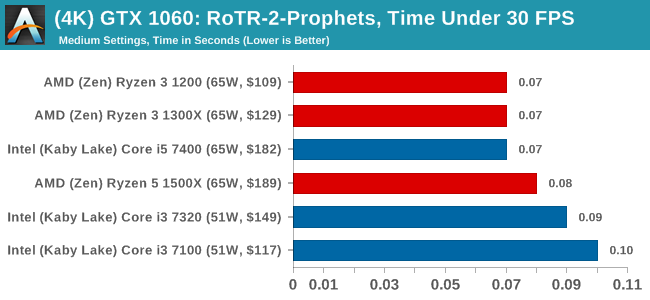
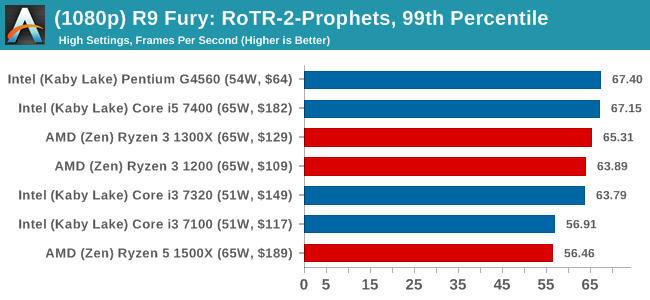
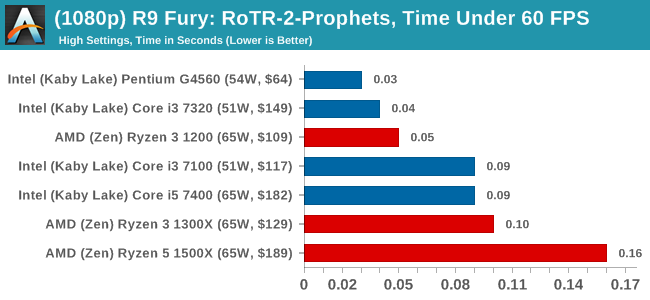
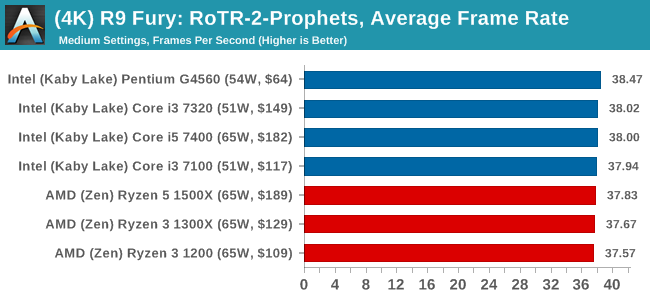
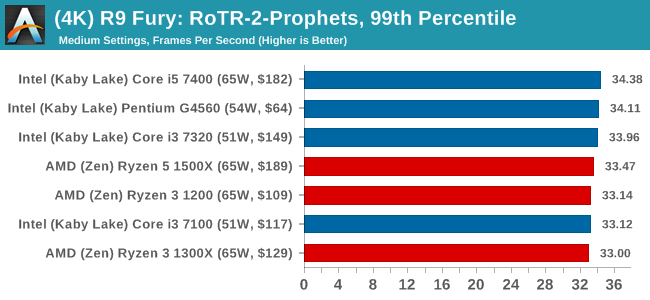
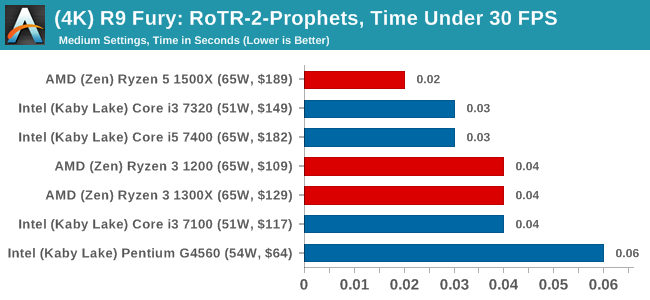
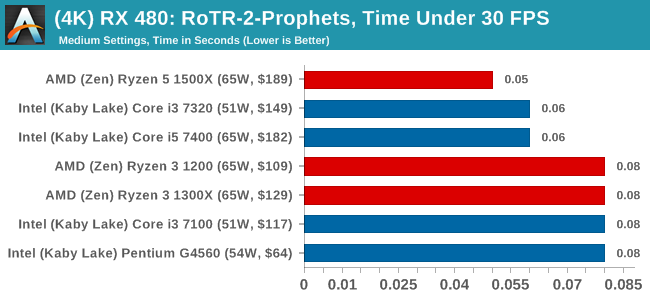
#2 Prophet's Tomb
MSI GTX 1080 Gaming 8G Performance
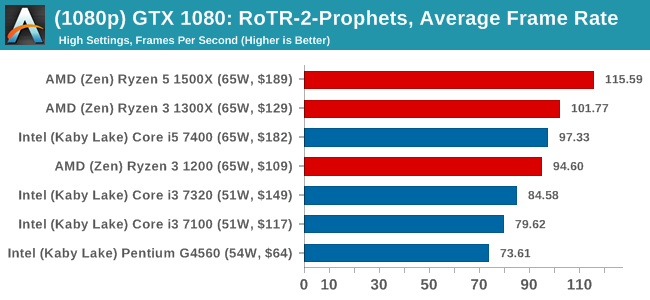
1080p
4K
ASUS GTX 1060 Strix 6GB Performance
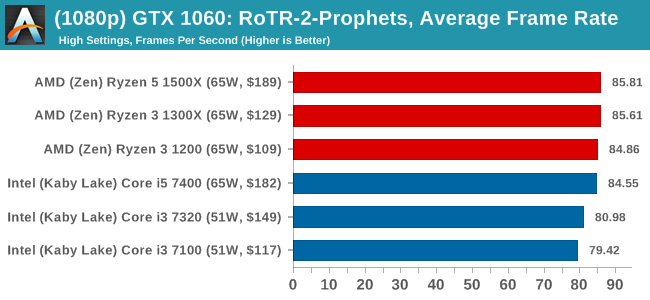
1080p
4K
Sapphire R9 Fury 4GB Performance
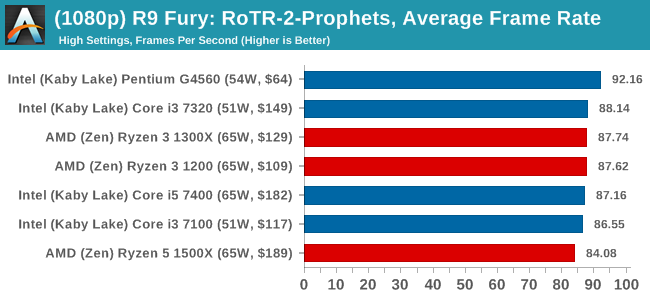
1080p
4K
Sapphire RX 480 8GB Performance
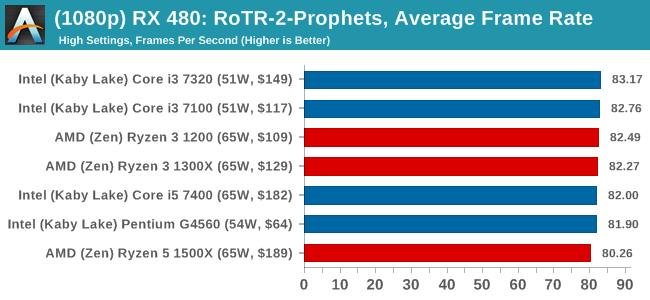
1080p
4K
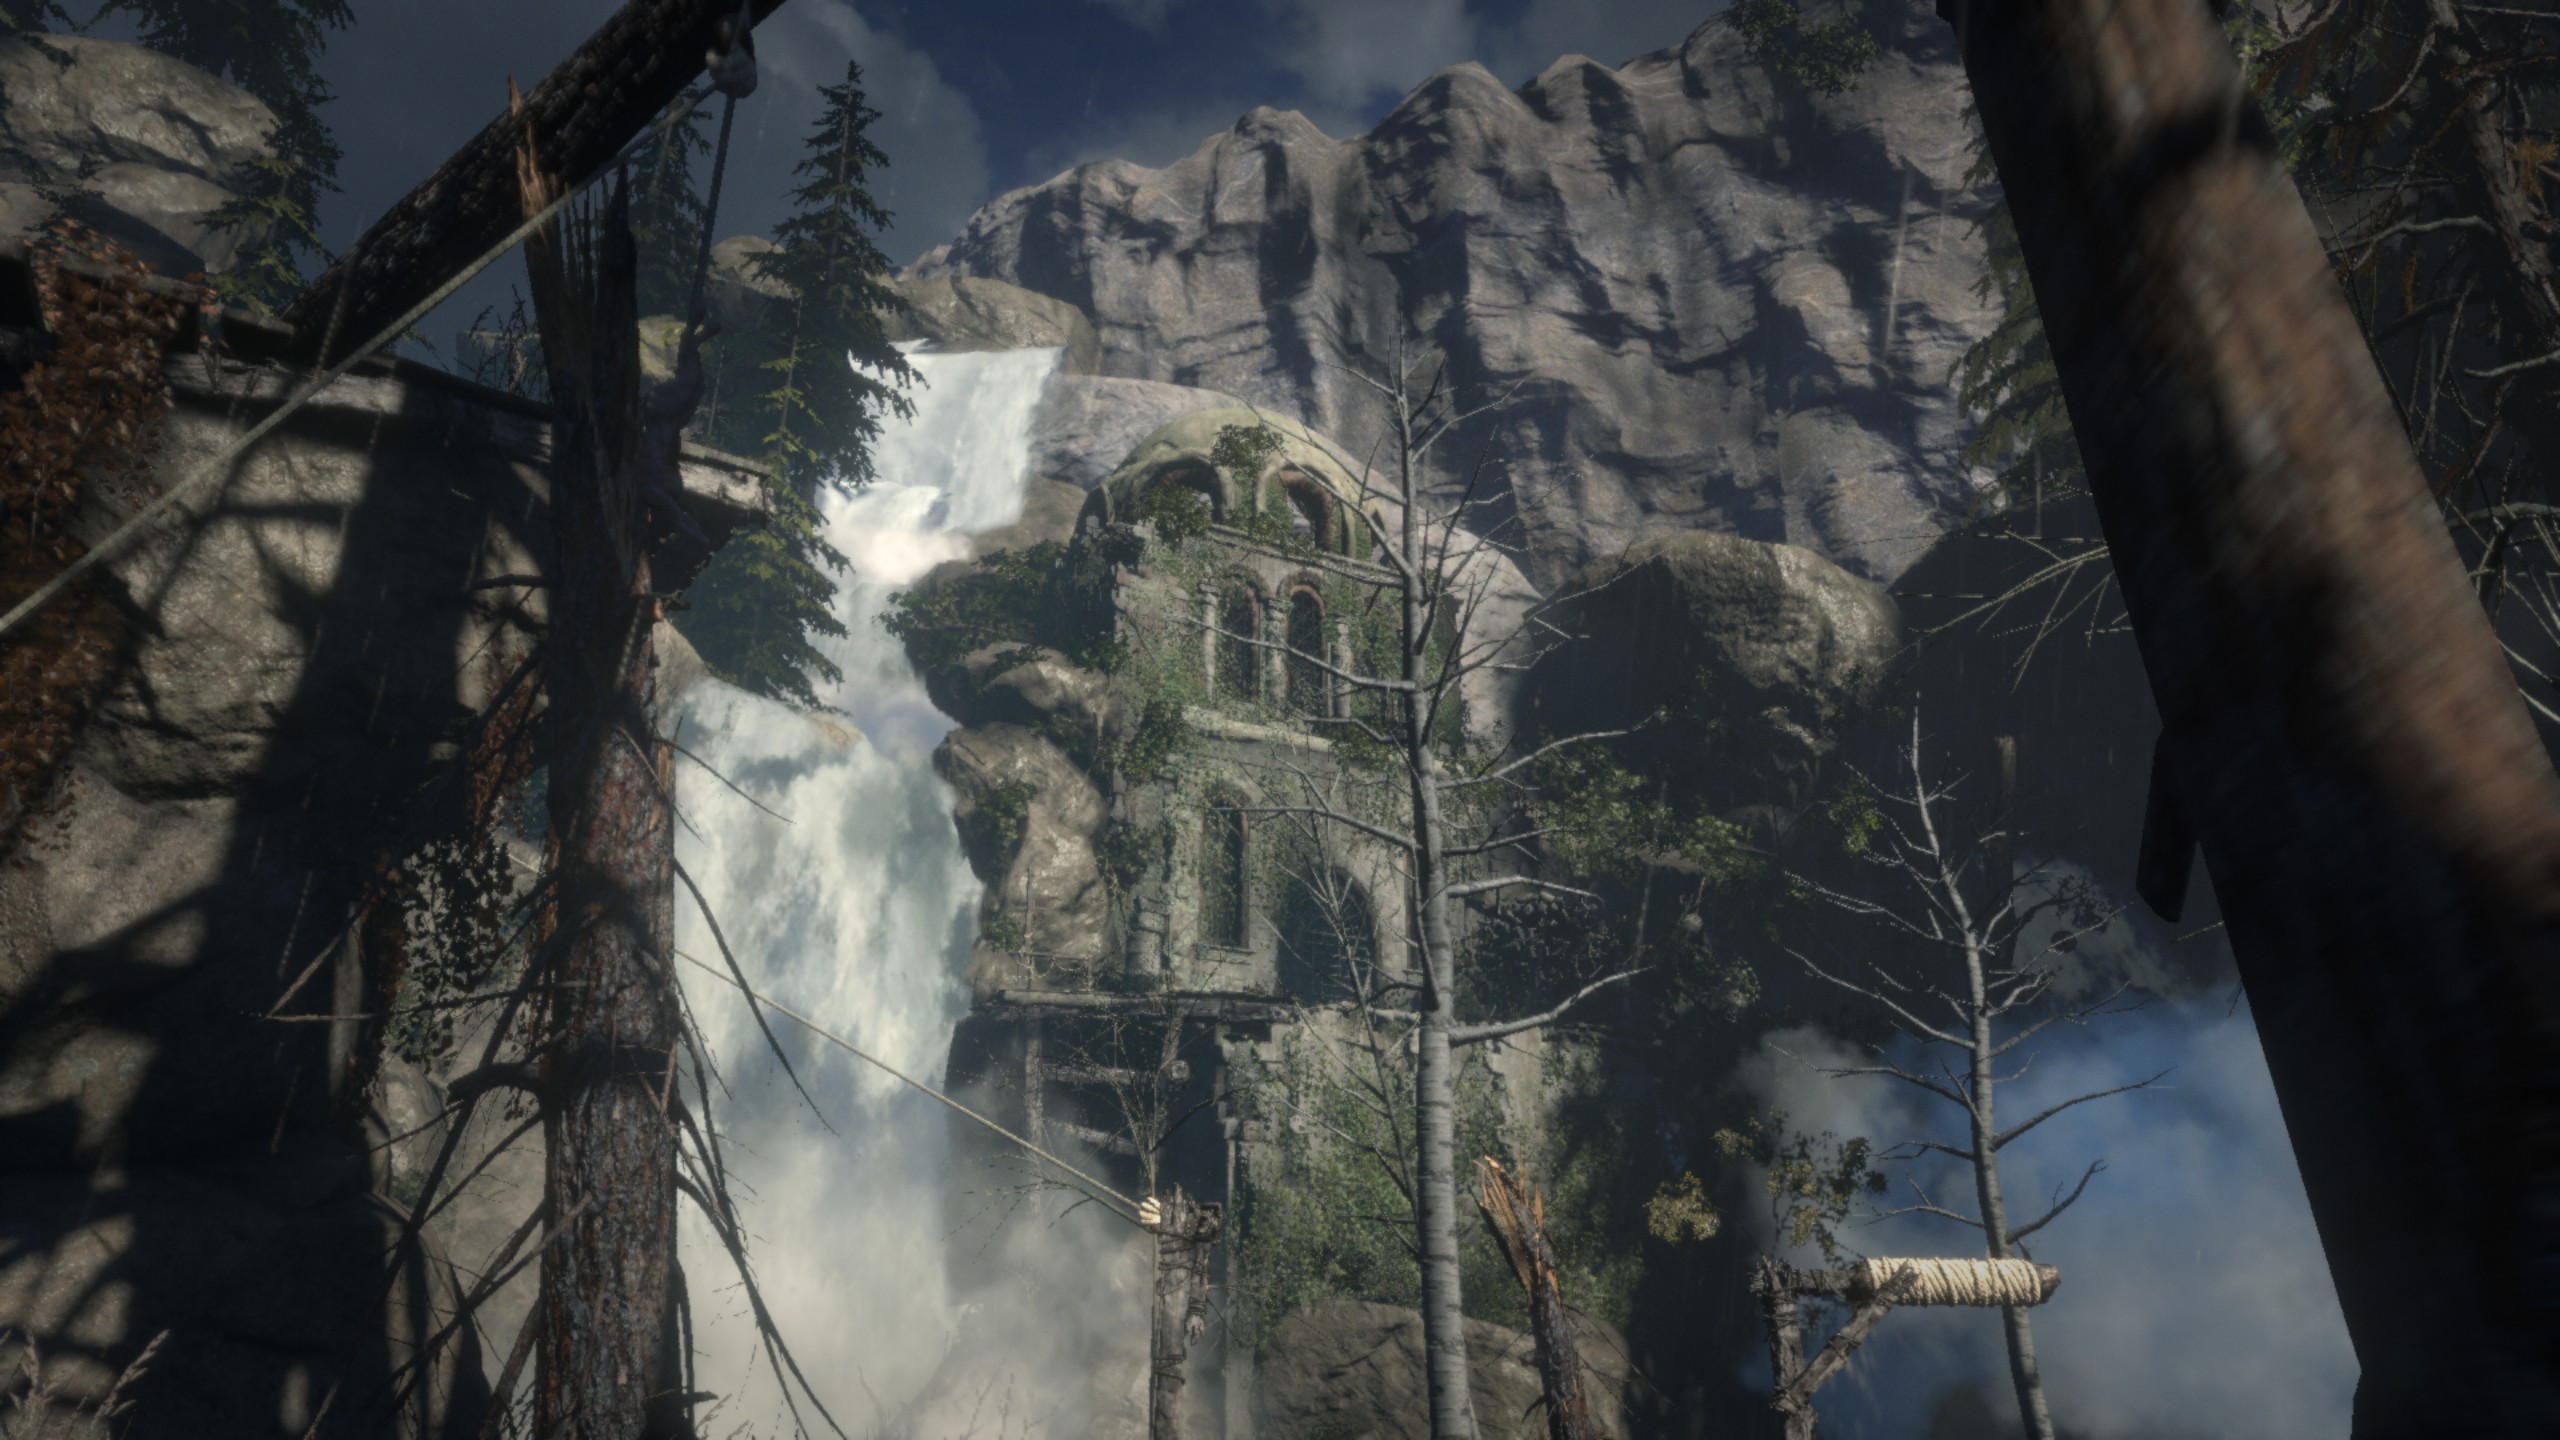
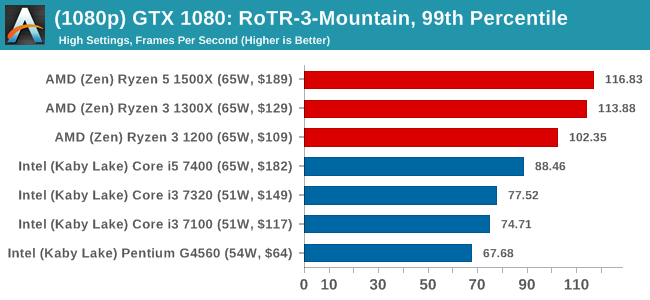
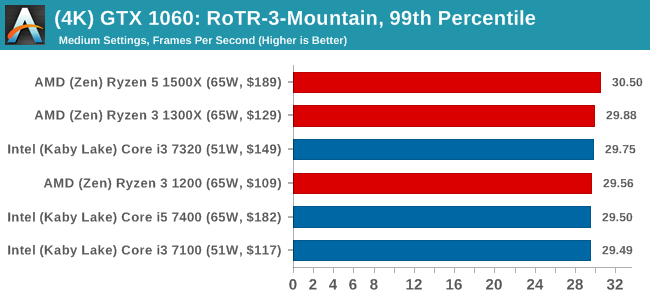
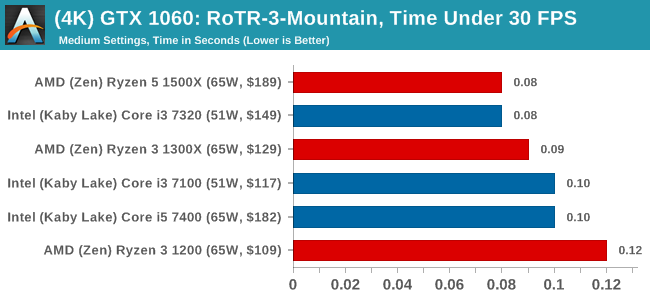
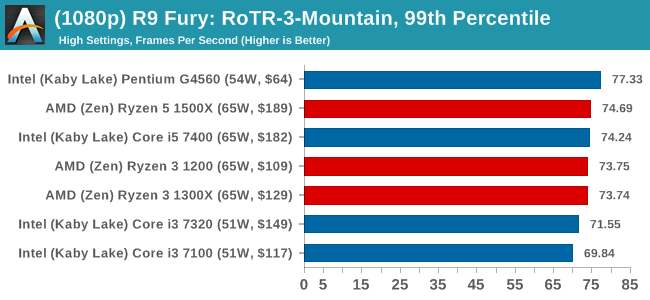
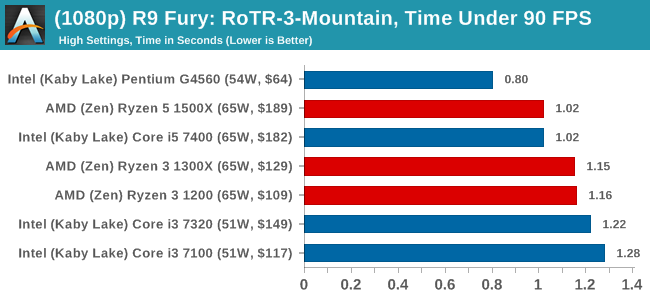
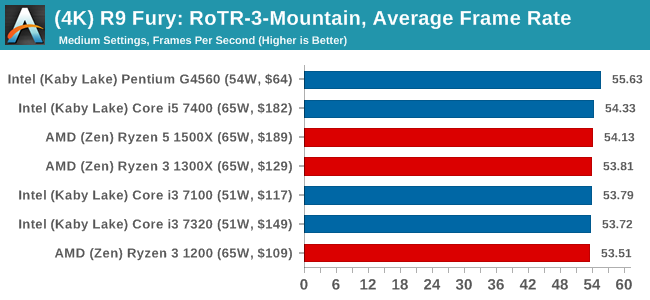
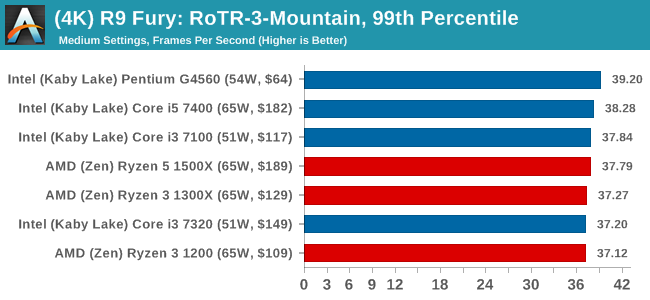
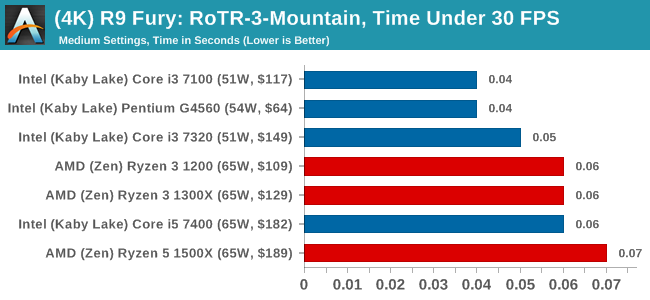
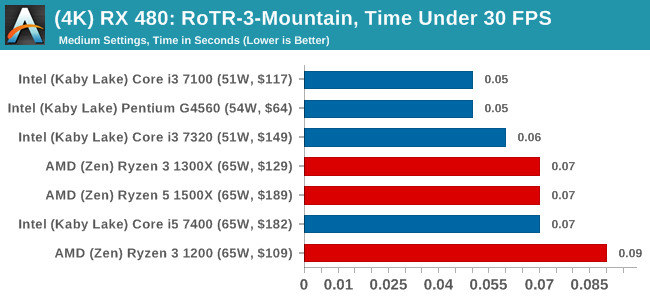
#3 Spine of the Mountain
MSI GTX 1080 Gaming 8G Performance
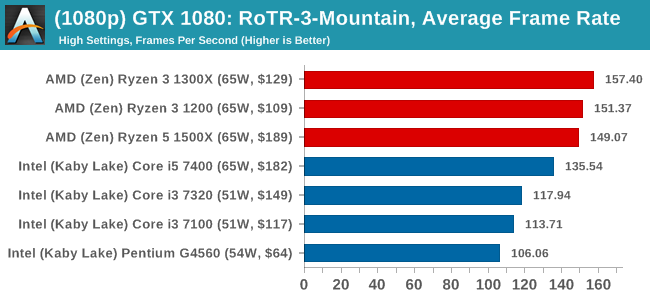
1080p
4K
ASUS GTX 1060 Strix 6GB Performance
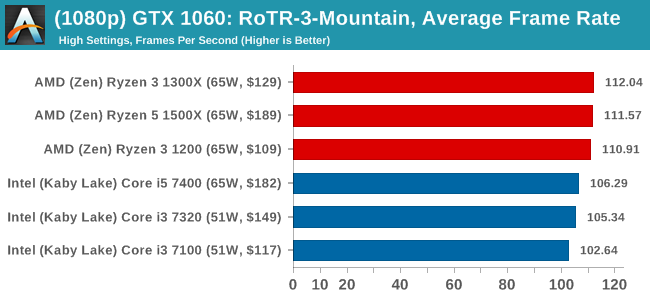
1080p
4K
Sapphire R9 Fury 4GB Performance
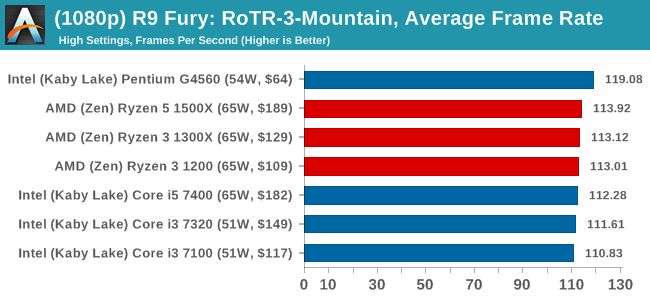
1080p
4K
Sapphire RX 480 8GB Performance

1080p
4K


140 Comments
View All Comments
Teknobug - Friday, July 28, 2017 - link
Guess the Rzyen 3 1300X isn't much of an upgrade over my other PC which is i5 3550 (OC'd to 3.9GHz) system then.jamyryals - Friday, July 28, 2017 - link
It's great to have some competition going on again!Mumrik - Friday, July 28, 2017 - link
If you run a 0% line horizontally through a graph like you do on page 17, and especially if it actually moves around a bit from graph to graph, I'd suggest making that line thicker than the others.harobikes333 - Saturday, July 29, 2017 - link
AMD pretty much has all the CPU segments covered <3Planning on a build soon!
LostPassword - Sunday, July 30, 2017 - link
i know a lot of people will say it doesn't matter. but the beauty about these ryzen 3 is that they are unlocked. i see alot of youtubers hit 3.7-3.8ghz on stock cooler.Oxford Guy - Wednesday, August 2, 2017 - link
Tom's Hardware used 3200 RAM for its review. I suggest reading that one because it paints a different picture than this one which uses slow RAM.Mugur - Thursday, August 3, 2017 - link
I think the author missed the point with this review: Ryzen 3 is obviously targeted towards gaming to a very tight budget, not B2B, not Enterprise, not Office, etc...Of course, this doesn't mean that certain cpu benchmarks shouldn't be used, but the test bed should definitely include overclocking (using the included Stealth cooler) and 3200 Mhz RAM (I wonder about AGESA 1006?). I don't care as much for "normalizing" benchmarks and Anandtech bench (a useful tool though), but just make me see how those 2 cpus are performing in the kind of environment they will be used. And add 2 entry level cards like RX 560 and GTX 1050/Ti; I know the reason about using a high end graphics card and I agree on paper, but this is not how those cpus will be used. It's an academical exercise.
Not everything should be a PhD dissertation, especially for this low level, budget components. If I have to reconmmend someone a cheap gaming machine I need to know whether a Ryzen 1200@3.9 Ghz + 8 GB 3200 DDR4 + RX 560 4 GB is a viable option (or not), better than a G4560 + 8 GB 2400 + GTX 1050 for example, especially in the long run.
Oxford Guy - Friday, August 11, 2017 - link
Worrying about RAM speed when you're using a low-grade GPU is unwise. You'll be very GPU-limited most of the time.No, what this review needed was 3200 RAM plus relevant GPUs. At the very least the 3000 speed RAM in the machine they tested with shouldn't have been heavily downclocked.
chiname - Saturday, November 18, 2017 - link
This actually depends on where you live.I did a pc a week ago.It's just an small entry level pc for kids to play some games.The price to performance was favoring AMD.I really wouldve liked to get an intel i3 7100 but the cost was higher than the 1200 amd.So hench we went with amd.Complete amd pc cost 6.5k include gfx card.intel wouldve cost us over 8k.
John_M - Sunday, April 29, 2018 - link
"We’re still working through our gaming testing as this review goes live, and we’ll add graphs for that in a bit."I've read that so often on this site but the promise is seldom fulfilled.