The AMD Ryzen 3 1300X and Ryzen 3 1200 CPU Review: Zen on a Budget
by Ian Cutress on July 27, 2017 9:30 AM EST- Posted in
- CPUs
- AMD
- Zen
- Ryzen
- Ryzen 3
- Ryzen 3 1300X
- Ryzen 3 1200
Grand Theft Auto
The highly anticipated iteration of the Grand Theft Auto franchise hit the shelves on April 14th 2015, with both AMD and NVIDIA in tow to help optimize the title. GTA doesn’t provide graphical presets, but opens up the options to users and extends the boundaries by pushing even the hardest systems to the limit using Rockstar’s Advanced Game Engine under DirectX 11. Whether the user is flying high in the mountains with long draw distances or dealing with assorted trash in the city, when cranked up to maximum it creates stunning visuals but hard work for both the CPU and the GPU.

For our test we have scripted a version of the in-game benchmark. The in-game benchmark consists of five scenarios: four short panning shots with varying lighting and weather effects, and a fifth action sequence that lasts around 90 seconds. We use only the final part of the benchmark, which combines a flight scene in a jet followed by an inner city drive-by through several intersections followed by ramming a tanker that explodes, causing other cars to explode as well. This is a mix of distance rendering followed by a detailed near-rendering action sequence, and the title thankfully spits out frame time data.
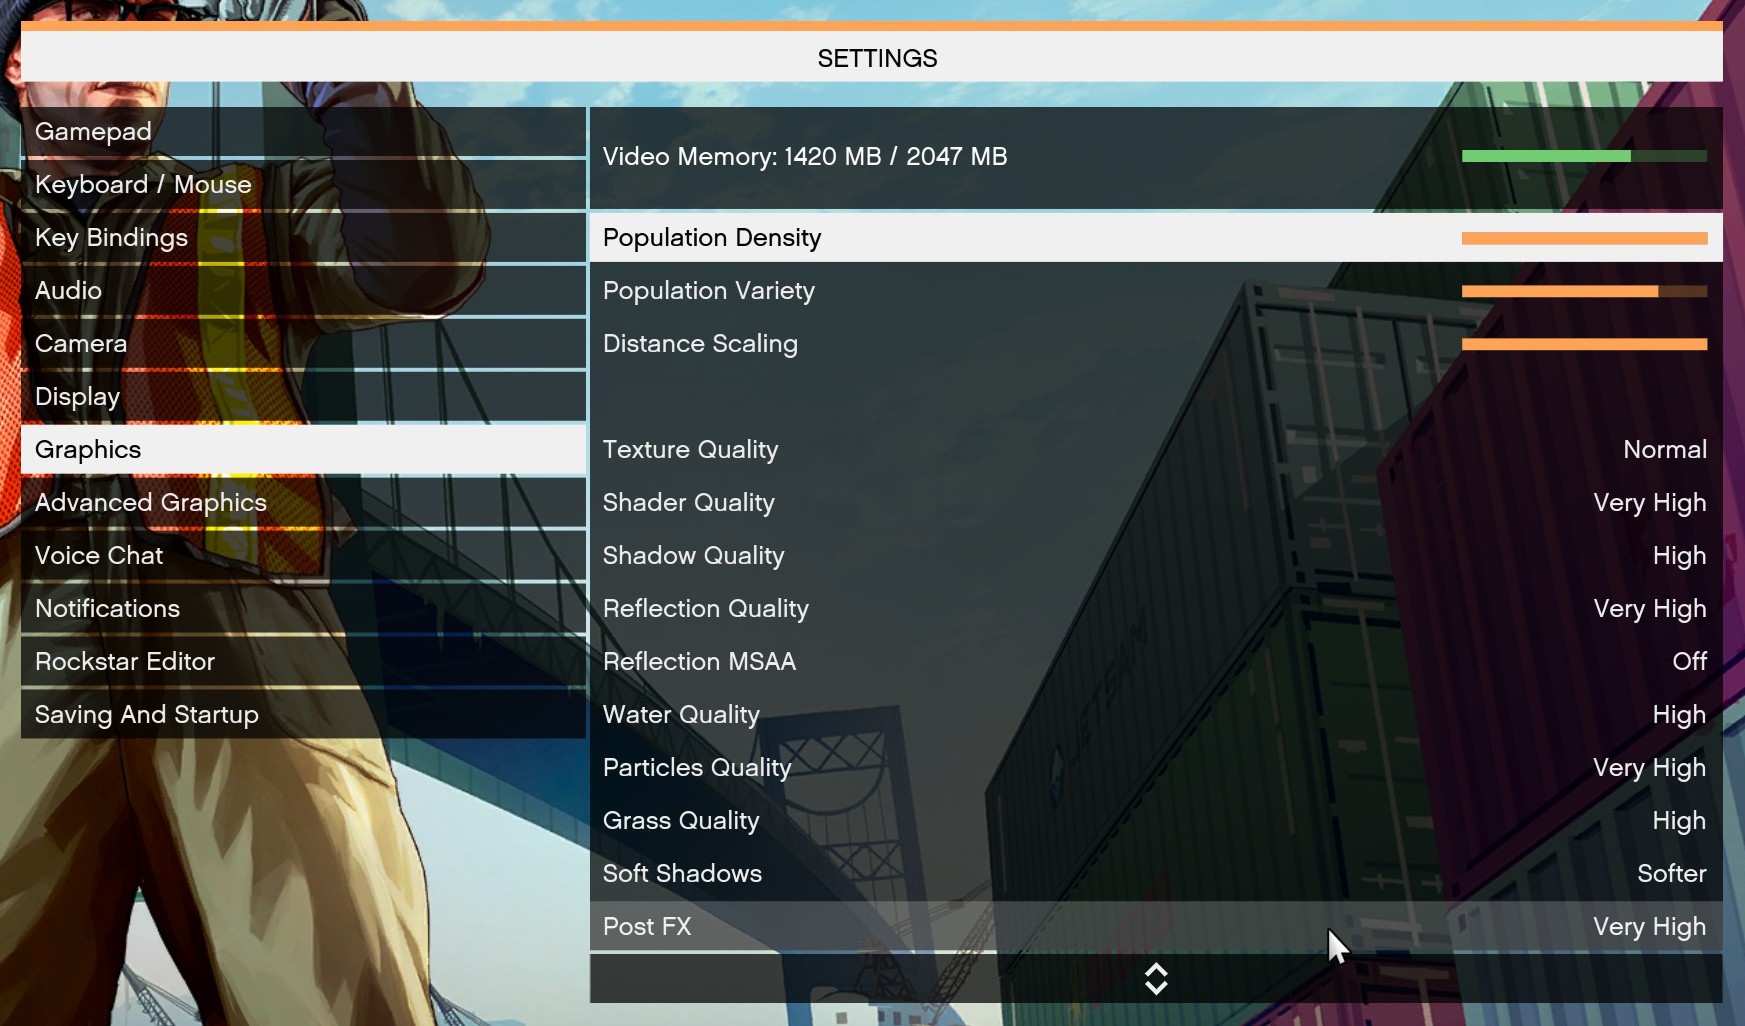
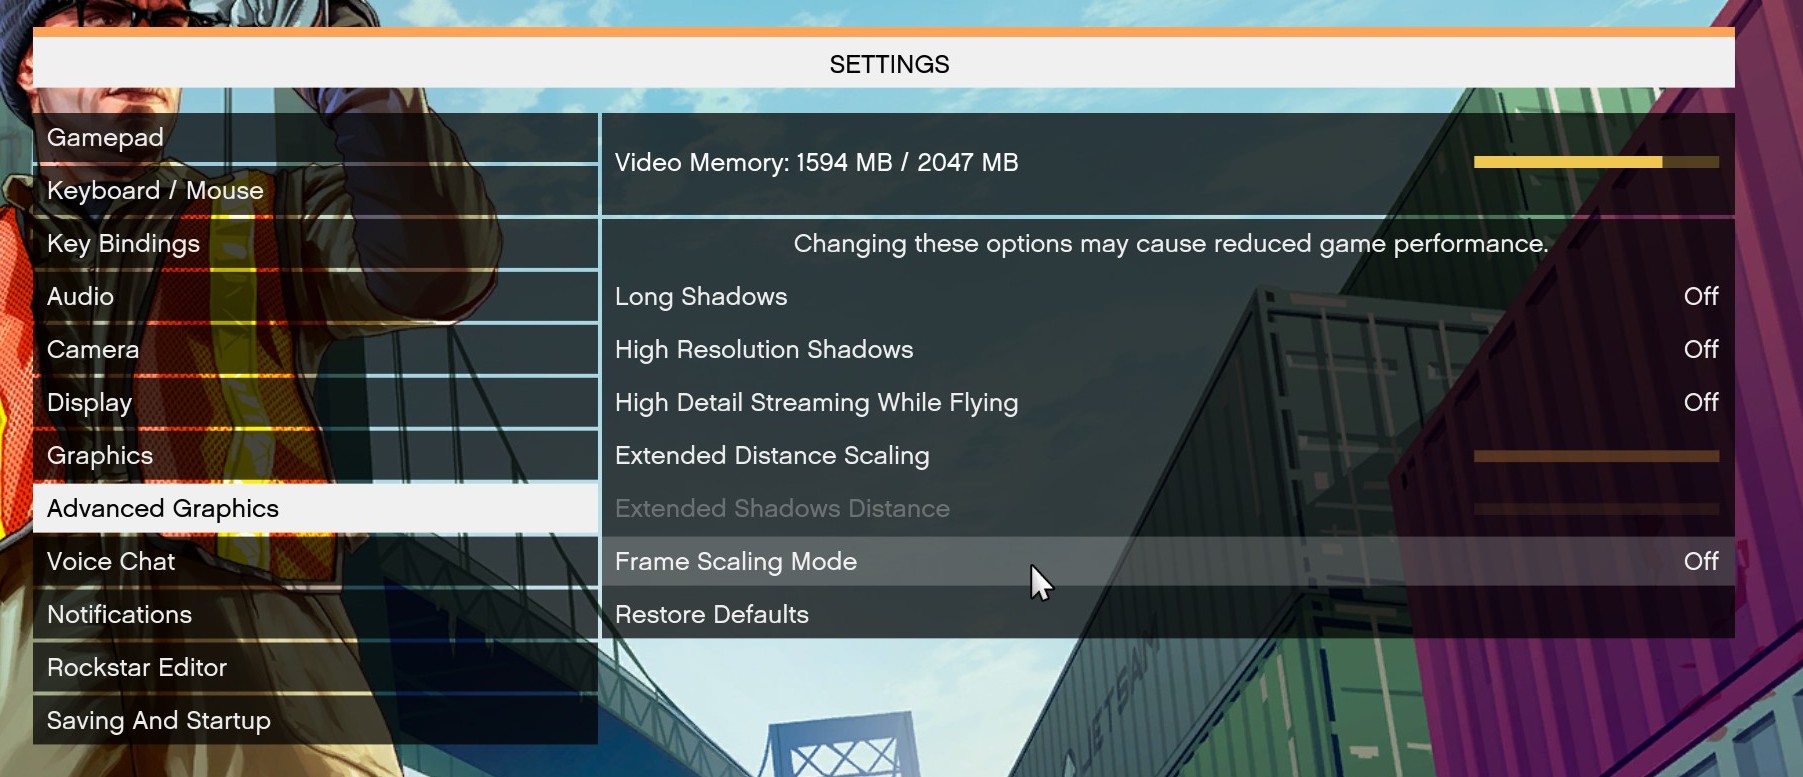
There are no presets for the graphics options on GTA, allowing the user to adjust options such as population density and distance scaling on sliders, but others such as texture/shadow/shader/water quality from Low to Very High. Other options include MSAA, soft shadows, post effects, shadow resolution and extended draw distance options. There is a handy option at the top which shows how much video memory the options are expected to consume, with obvious repercussions if a user requests more video memory than is present on the card (although there’s no obvious indication if you have a low end GPU with lots of GPU memory, like an R7 240 4GB).
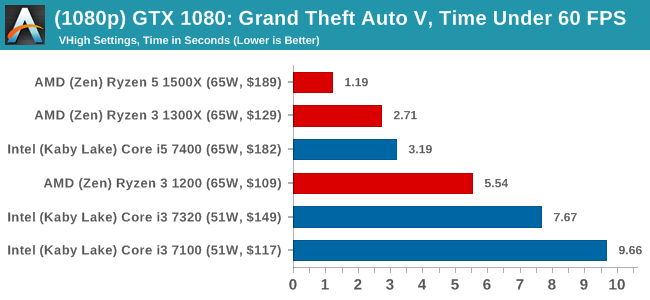
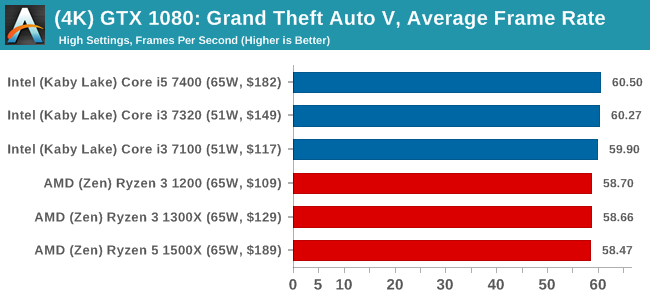
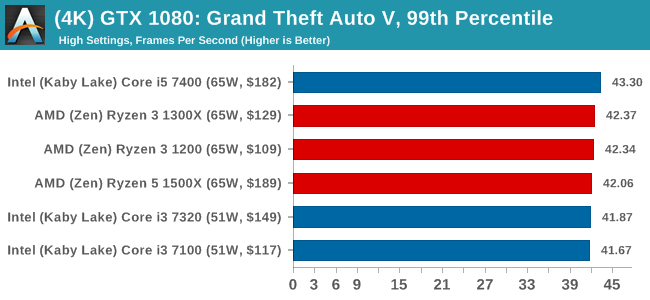
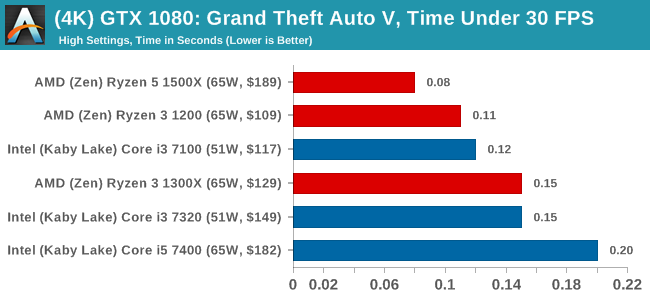
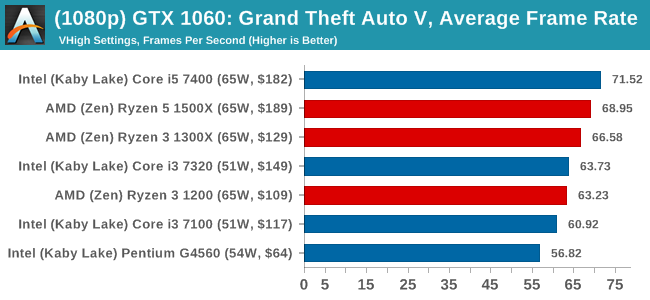
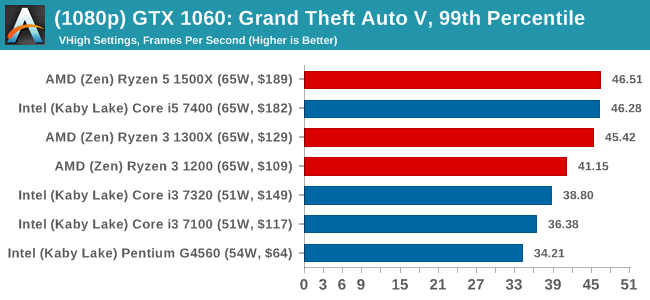
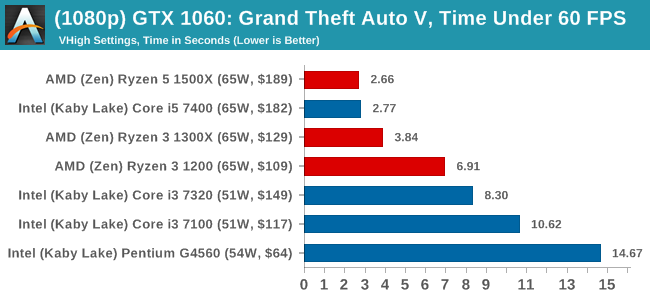
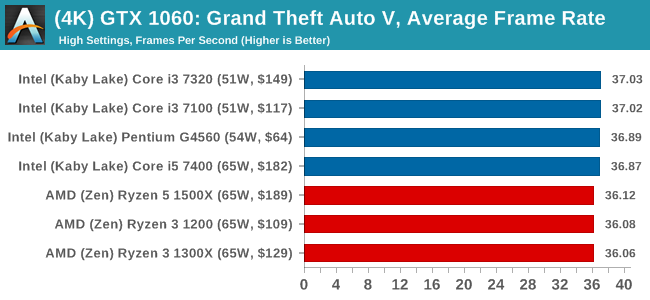
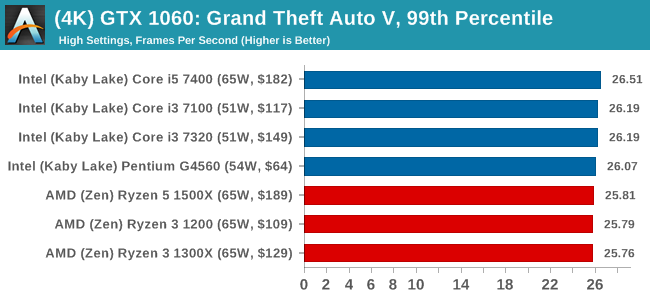
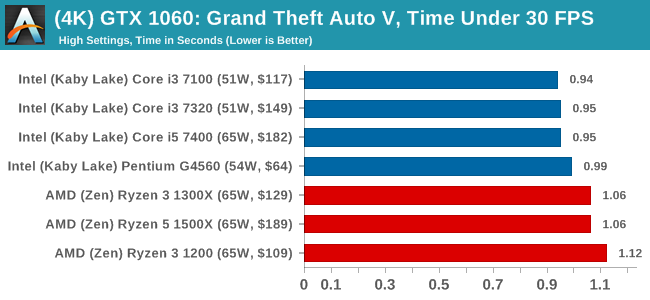
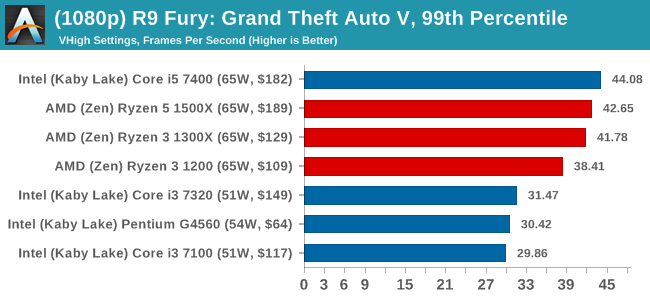
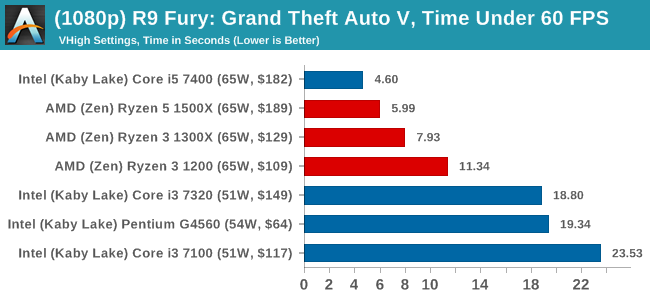
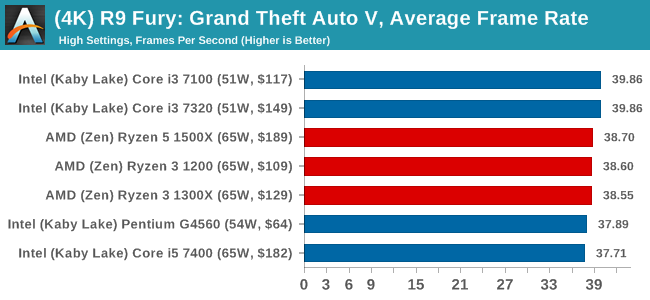
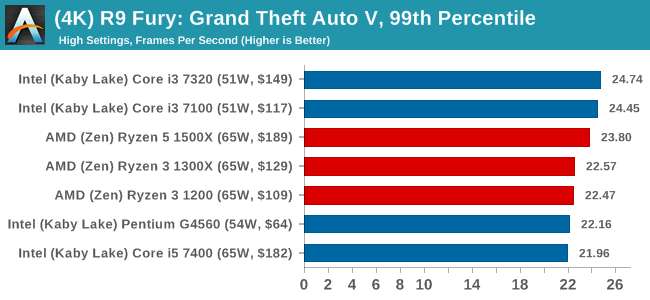
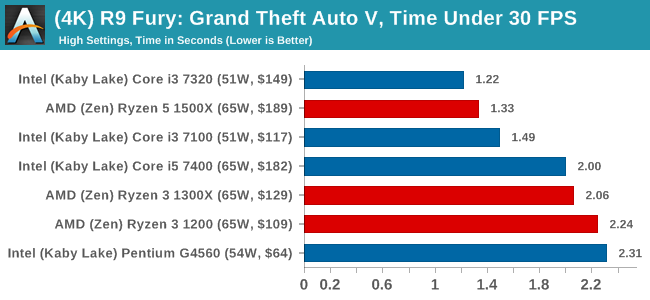
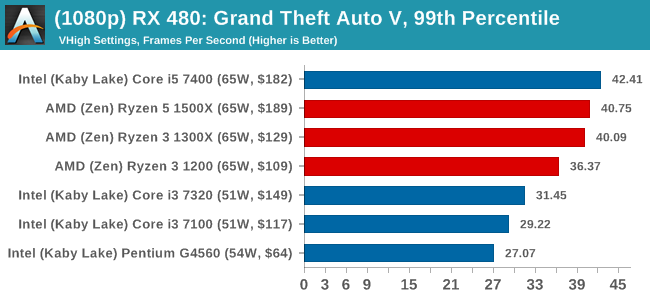
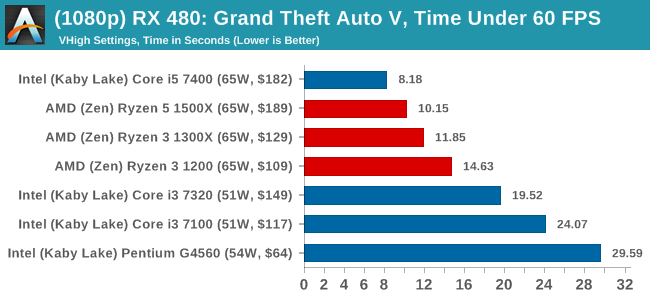
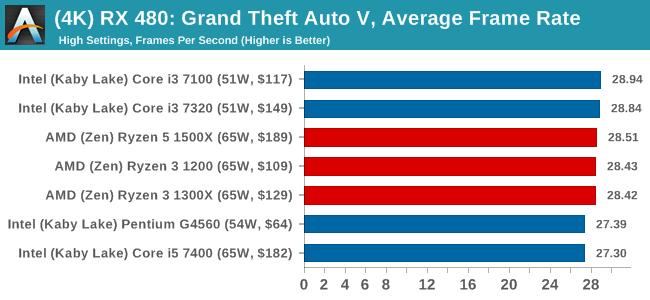
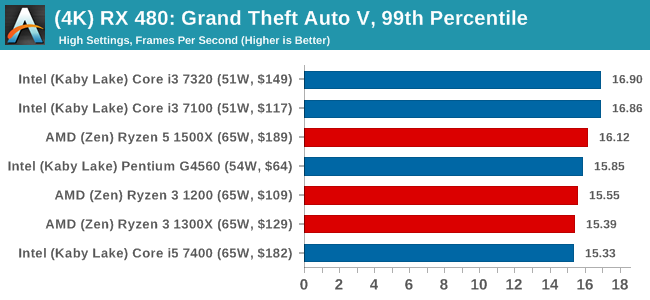
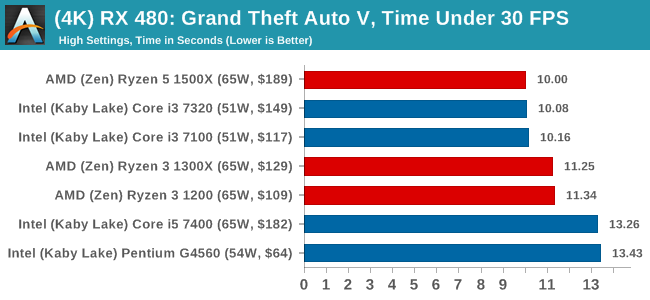
To that end, we run the benchmark at 1920x1080 using an average of Very High on the settings, and also at 4K using High on most of them. We take the average results of four runs, reporting frame rate averages, 99th percentiles, and our time under analysis.
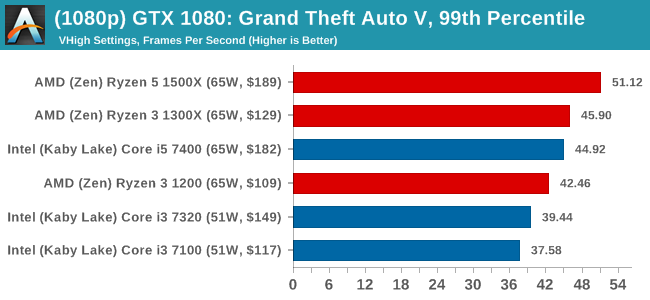
For all our results, we show the average frame rate at 1080p first. Mouse over the other graphs underneath to see 99th percentile frame rates and 'Time Under' graphs, as well as results for other resolutions. All of our benchmark results can also be found in our benchmark engine, Bench.
MSI GTX 1080 Gaming 8G Performance
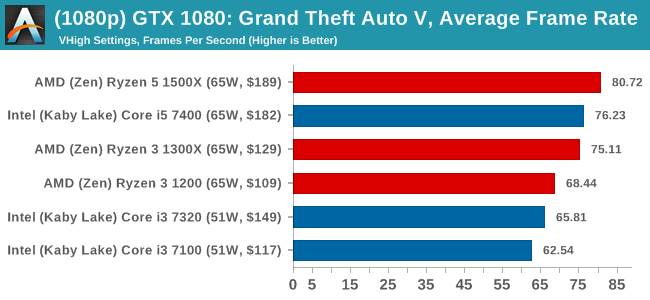
1080p
4K
ASUS GTX 1060 Strix 6GB Performance
1080p
4K
Sapphire R9 Fury 4GB Performance
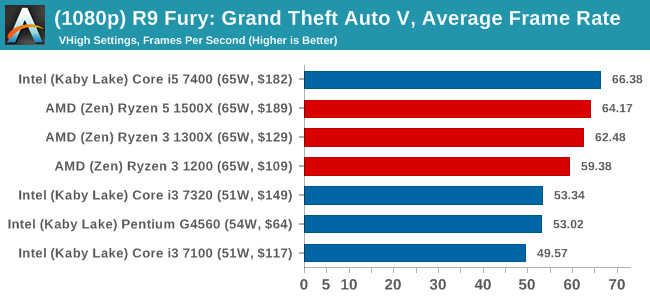
1080p
4K
Sapphire RX 480 8GB Performance
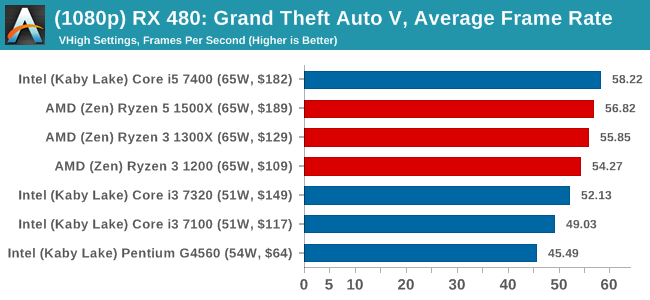
1080p
4K


140 Comments
View All Comments
Oxford Guy - Thursday, July 27, 2017 - link
"The Ryzen 3 1200 brings up the rear of the stack, being the lowest CPU in the stack, having the lowest frequency at 3.1G base, 3.4G turbo, 3.1G all-core turbo, no hyperthreading and the lowest amount of L3 cache."That bit about the L3 is incorrect unless the chart on page 1 is incorrect. It shows the same L3 size for 1400, 1300X, and 1200.
Oxford Guy - Thursday, July 27, 2017 - link
And this:"Number 3 leads to a lop-sided silicon die, and obviously wasn’t chosen."
Obviously?
Oxford Guy - Thursday, July 27, 2017 - link
"DDR4-2400 C15"2400, really — even though it is, obviously, known that Zen needs faster RAM to perform efficiently?
Joel Hruska managed to test Ryzen with 3200 speed RAM on his day 1 review. I bought 16 GB of 3200 RAM from Microcenter last Christmastime for $80. Just because RAM prices are nuts right now doesn't mean we should gut Ryzen's performance by sticking it with low-speed RAM.
Oxford Guy - Thursday, July 27, 2017 - link
"This is also typically run at JEDEC subtimings where possible. It is noted that some users are not keen on this policy"Maybe you guys should rethink your logic.
1) You have claimed, when overclocking, that it's not necessary to do full stability testing, like with Prime. Just passing some lower-grade stress testing is enough to make an overclock "stable enough".
2) Your overclocking reviews have pushed unwise levels of voltage into CPUs to go along with this "stable enough" overclock.
So... you argue against proof of true stability, both in the final overclock settings being satisfactorily tested and in safe voltages being decided upon.
And — simultaneously — kneecap Zen processors by using silly JEDEC standards, trying to look conservative?
Please.
Everyone knows the JEDEC standard applies to enterprise. Patriot is just one manufacturer of RAM that tested and certified far better RAM performance on B350 and A320 Zen boards. You had that very article on your site just a short time ago.
Your logic doesn't add up. It is not a significant enough cost savings for system builders to go with slow RAM for Zen. The only argument you can use, at all, is that OEMs are likely to kneecap Zen with slow RAM. That is not a given, though. OEMs can use faster RAM, like, at least, 2666, if they choose to. If they're marketing toward gamers they likely will.
Oxford Guy - Thursday, July 27, 2017 - link
"Truth be told I never actually played the first version, but every edition from the second to the sixth, including the fifth as voiced by the late Leonard Nimoy"You mean Civ IV.
Oxford Guy - Thursday, July 27, 2017 - link
And, yeah, we can afford to test with an Nvidia 1080 but we can't afford to use decent speed RAM.Yeah... makes sense.
Hixbot - Thursday, July 27, 2017 - link
Are you having a conversation with yourself? Try to condense your points into a single post.Oxford Guy - Friday, July 28, 2017 - link
I don't live in a static universe where all of the things I'm capable of thinking of are immediately apparent, but thanks for the whine.Manch - Friday, July 28, 2017 - link
Really snowflake? You're saying he is whining? How many rants have you posted? LOL The difference between 2400 and 3200 shows up more on the higher end processors bc bigger L3 & HT err SMT. The diff in CPU bound gaming is 5-10% at most with the Ryzen 7's. Smaller with the 5's. Even more so with the 3's. Small enough to the point that it would not change the outlook on the CPU's. Also consider that if Ian change the parameters of his test constantly it would also skew numbers more so and render bench unreliable. Test the Ryzen 7's with 2133 then the 5's with 2400 then the 3's with 3200? Obviously anandtechs test are not the definitive performance bench mark for the world. What it is, is a reliably consistent benchmark allowing you to compare diff cpus with as little changed as possible as too not skew performance. Think EPA gas mileage stickers on cars. Will you get that rating? maybe. What it does is it gives you comparative results. From there its fairly easy to extrapolate the difference. Now I'm sure they will as they have in the past update there baseline specs for testing. You're running off the rails about how much the memory effects are. Look at all the youtube vids and other reviews out there. Difference yes. A lot? meh I also believe anandtech has mentioned doing a write up on the latest agesa update since its had a significant impact(including memory) on the series.Oxford Guy - Friday, July 28, 2017 - link
"You're saying he is whining? How many rants have you posted?"Pot kettle fallacy.