The Intel Kaby Lake-X i7 7740X and i5 7640X Review: The New Single-Threaded Champion, OC to 5GHz
by Ian Cutress on July 24, 2017 8:30 AM EST- Posted in
- CPUs
- Intel
- Kaby Lake
- X299
- Basin Falls
- Kaby Lake-X
- i7-7740X
- i5-7640X
Benchmarking Performance: CPU System Tests
Our first set of tests is our general system tests. These set of tests are meant to emulate more about what people usually do on a system, like opening large files or processing small stacks of data. This is a bit different to our office testing, which uses more industry standard benchmarks, and a few of the benchmarks here are relatively new and different.
All of our benchmark results can also be found in our benchmark engine, Bench.
PDF Opening
First up is a self-penned test using a monstrous PDF we once received in advance of attending an event. While the PDF was only a single page, it had so many high-quality layers embedded it was taking north of 15 seconds to open and to gain control on the mid-range notebook I was using at the time. This put it as a great candidate for our 'let's open an obnoxious PDF' test. Here we use Adobe Reader DC, and disable all the update functionality within. The benchmark sets the screen to 1080p, opens the PDF to in fit-to-screen mode, and measures the time from sending the command to open the PDF until it is fully displayed and the user can take control of the software again. The test is repeated ten times, and the average time taken. Results are in milliseconds.
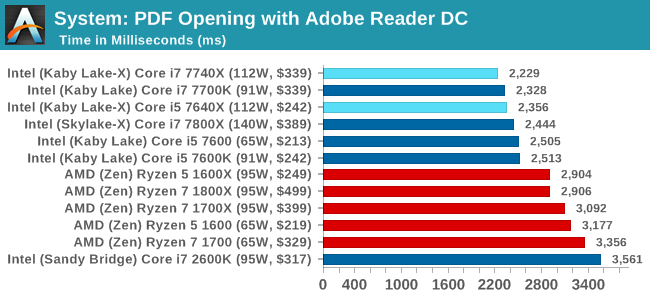
PDF opening is all about single thread frequency and IPC, giving the win to the new KBL-X chips.
FCAT Processing: link
One of the more interesting workloads that has crossed our desks in recent quarters is FCAT - the tool we use to measure stuttering in gaming due to dropped or runt frames. The FCAT process requires enabling a color-based overlay onto a game, recording the gameplay, and then parsing the video file through the analysis software. The software is mostly single-threaded, however because the video is basically in a raw format, the file size is large and requires moving a lot of data around. For our test, we take a 90-second clip of the Rise of the Tomb Raider benchmark running on a GTX 980 Ti at 1440p, which comes in around 21 GB, and measure the time it takes to process through the visual analysis tool.
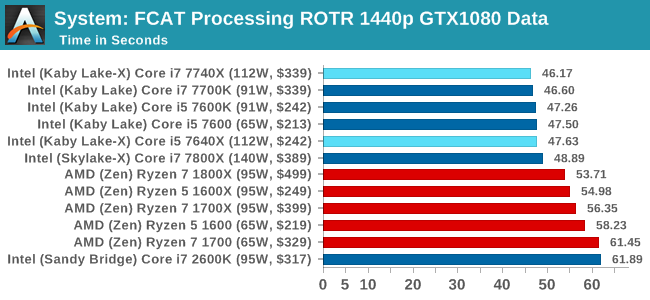
FCAT similarly favors frequency and IPC. For this sort of workload, the Core i7 is the best chip to get.
3D Movement Algorithm Test v2.1: link
This is the latest version of the self-penned 3DPM benchmark. The goal of 3DPM is to simulate semi-optimized scientific algorithms taken directly from my doctorate thesis. Version 2.1 improves over 2.0 by passing the main particle structs by reference rather than by value, and decreasing the amount of double->float->double recasts the compiler was adding in. It affords a ~25% speed-up over v2.0, which means new data.
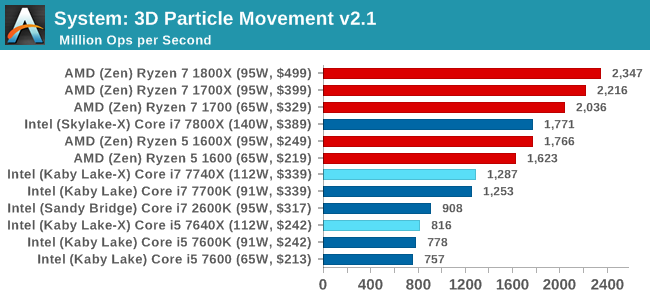
As 3DPM expands into several threads, the new quad-core parts will easily get trounced here by AMD's 8-cores for the same price. The Core i7-7800X puts on a good showing, as per core Intel's chips give a higher score.
DigiCortex v1.20: link
Despite being a couple of years old, the DigiCortex software is a pet project for the visualization of neuron and synapse activity in the brain. The software comes with a variety of benchmark modes, and we take the small benchmark which runs a 32k neuron/1.8B synapse simulation. The results on the output are given as a fraction of whether the system can simulate in real-time, so anything above a value of one is suitable for real-time work. The benchmark offers a 'no firing synapse' mode, which in essence detects DRAM and bus speed, however we take the firing mode which adds CPU work with every firing.
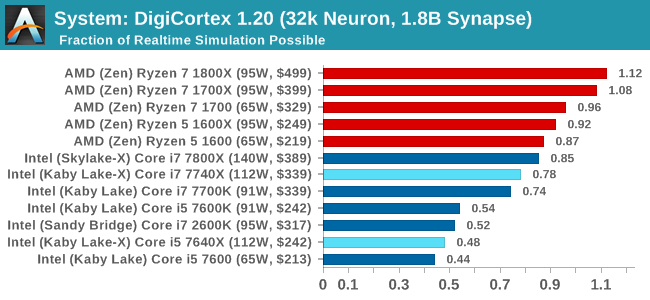
DigiCortex likes a bit of everything: cores, threads, IPC, frequency, uncore frequency, and memory frequency. The Core i7 parts roughly double the Core i5s due to the thread count, and also the AMD Ryzen parts skip ahead as well due to having double the threads to the Core i7.
Agisoft Photoscan 1.0: link
Photoscan stays in our benchmark suite from the previous version, however now we are running on Windows 10 so features such as Speed Shift on the latest processors come into play. The concept of Photoscan is translating many 2D images into a 3D model - so the more detailed the images, and the more you have, the better the model. The algorithm has four stages, some single threaded and some multi-threaded, along with some cache/memory dependency in there as well. For some of the more variable threaded workload, features such as Speed Shift and XFR will be able to take advantage of CPU stalls or downtime, giving sizeable speedups on newer microarchitectures.
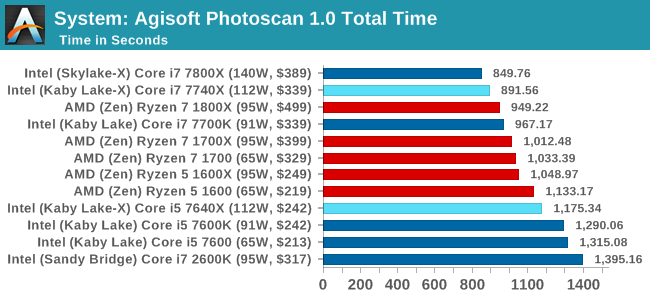
Agisoft is like a Formula 1 race circuit: the long fast straights and techical corners make it a nightmare to have the technology to be the best at both, and Photoscan has enough serial code for high single thread performance to take advantage but also massively parallel sections where having 12-18 threads makes a difference. Despite having half the threads, the single core performance of the Core i7-7740X makes it pull ahead of the Ryzen 7 chips, but when comparing the four threads of the Core i5-7640X to the twelve threads of the Ryzen 5 processors, having 12 threads wins.


176 Comments
View All Comments
Chaser - Monday, July 24, 2017 - link
Go 2600K. LMAO!YukaKun - Monday, July 24, 2017 - link
Hey, I'm still using my 4.6Ghz 2700K, so these numbers bring joy to me!Cheers! :P
mapesdhs - Monday, July 24, 2017 - link
4.6? Outrageous! I would be offended if I were a 2700K at a mere 4.6! Get that thing up to 5.0 asap. 8) Mbd-dependent I suppose, but I've built seven 2700K systems so far, 5.0 every time, low noise and good temps. Marvelous chip. And oh yeah, 2GB/sec with a 950 Pro. 8)lowlymarine - Tuesday, July 25, 2017 - link
Either you're water cooling those systems, or you should consider investing in lottery tickets. My 2600k wouldn't push past 4.4 without very worrying amounts of voltage (1.4V+) and even 4.4 ran so hot I on my 212+ I settled for 4.2 to keep the core under 1.3V.soliloquist - Monday, July 24, 2017 - link
Yeah, Sandy Bridge is holding up nicely. Its pretty ridiculous actually.colonelclaw - Monday, July 24, 2017 - link
Wait, am I reading these graphs correctly? Unless I'm going mad, they seem to say that for gaming there's no need to upgrade if you already have a 2600K. Huh?If true, and I have no reason to doubt the data, that would make the 2600K one of the greatest processors ever?
Icehawk - Monday, July 24, 2017 - link
Yup, it's been said many times - if you have an i7 processor you really don't need to upgrade it for gaming, spend the money on a new GPU every few years. I have a 3700k & GF970, other than the video card the system is 6yrs old - I used to build a new one every other year. I've been considering the 7800\7820 though as I do a lot of encoding.Gothmoth - Monday, July 24, 2017 - link
"...Intel’s official line is about giving customers options. ..."yeah like.. if you want more PCI lanes to use all oyu mainboard features just buy the 999$ CPU..... LOL.
mapesdhs - Monday, July 24, 2017 - link
Indeed, just like the "option" of a CPU like the 4820K (4-core but with 40 lanes) suddenly vanished after X79. :D Intel's current lineup is an insult.Kalelovil - Monday, July 24, 2017 - link
Some mistakes for the Ryzen entries in the comparisons on page 1.PCI-E (Ryzen die has 20 lanes non-chipset, not 16), clockspeeds (too high), TDP (1700 is 65W).
Also, I see your point of comparing non-sale prices, but the 1700X seems to be widely and consistently available at near the i7-7740x MSRP. It's all but an official price cut.