The Intel Kaby Lake-X i7 7740X and i5 7640X Review: The New Single-Threaded Champion, OC to 5GHz
by Ian Cutress on July 24, 2017 8:30 AM EST- Posted in
- CPUs
- Intel
- Kaby Lake
- X299
- Basin Falls
- Kaby Lake-X
- i7-7740X
- i5-7640X
Shadow of Mordor
The next title in our testing is a battle of system performance with the open world action-adventure title, Middle Earth: Shadow of Mordor (SoM for short). Produced by Monolith and using the LithTech Jupiter EX engine and numerous detail add-ons, SoM goes for detail and complexity. The main story itself was written by the same writer as Red Dead Redemption, and it received Zero Punctuation’s Game of The Year in 2014.

A 2014 game is fairly old to be testing now, however SoM has a stable code and player base, and can still stress a PC down to the ones and zeroes. At the time, SoM was unique, offering a dynamic screen resolution setting allowing users to render at high resolutions that are then scaled down to the monitor. This form of natural oversampling was designed to let the user experience a truer vision of what the developers wanted, assuming you had the graphics hardware to power it but had a sub-4K monitor.
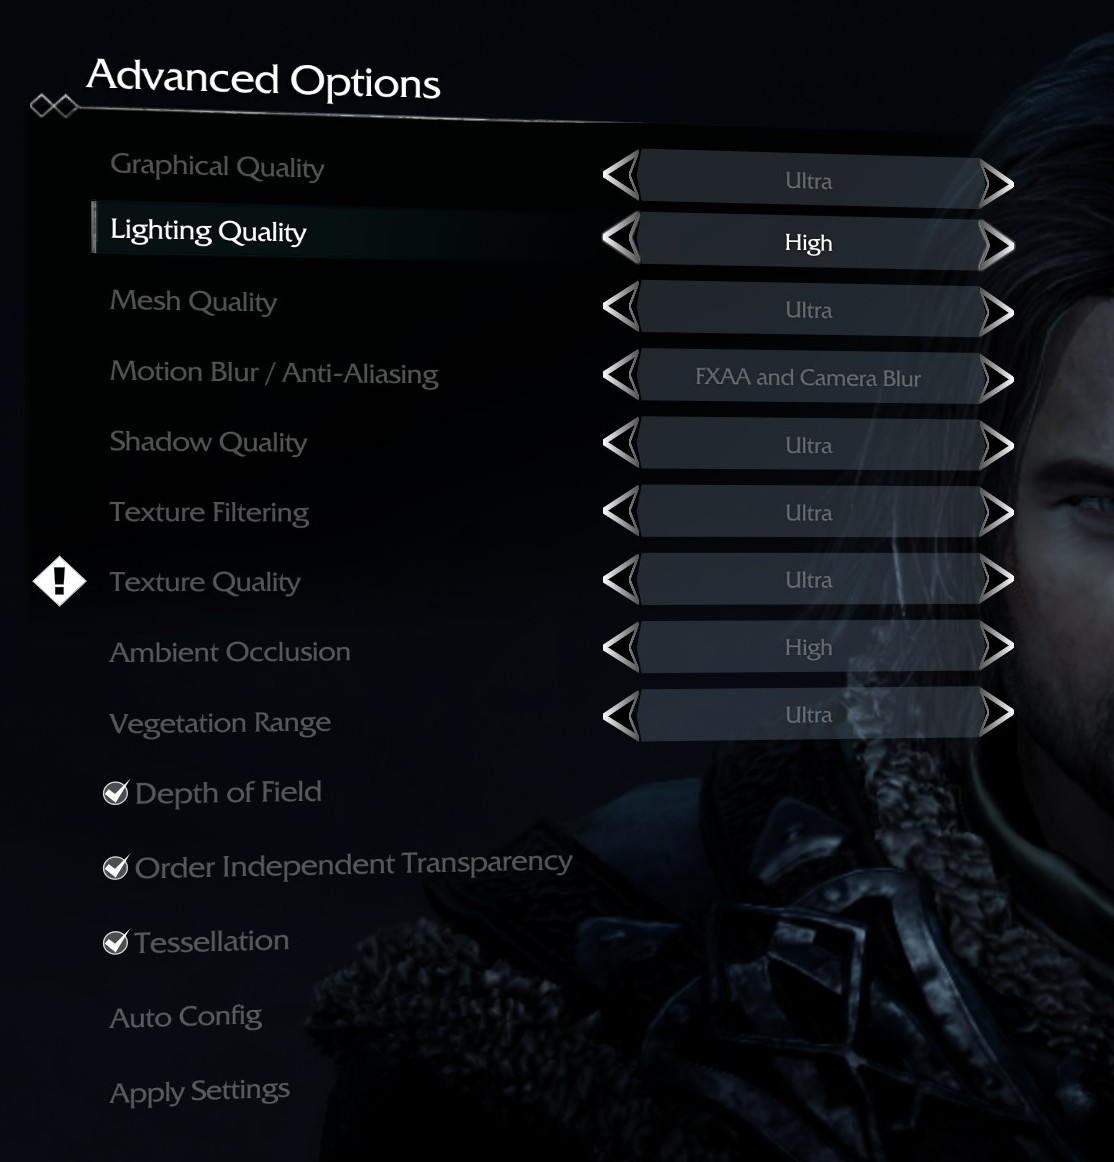
The title has an in-game benchmark, for which we run with an automated script implement the graphics settings, select the benchmark, and parse the frame-time output which is dumped on the drive. The graphics settings include standard options such as Graphical Quality, Lighting, Mesh, Motion Blur, Shadow Quality, Textures, Vegetation Range, Depth of Field, Transparency and Tessellation. There are standard presets as well.
We run the benchmark at 1080p and a native 4K, using our 4K monitors, at the Ultra preset. Results are averaged across four runs and we report the average frame rate, 99th percentile frame rate, and time under analysis.
For all our results, we show the average frame rate at 1080p first. Mouse over the other graphs underneath to see 99th percentile frame rates and 'Time Under' graphs, as well as results for other resolutions. All of our benchmark results can also be found in our benchmark engine, Bench.
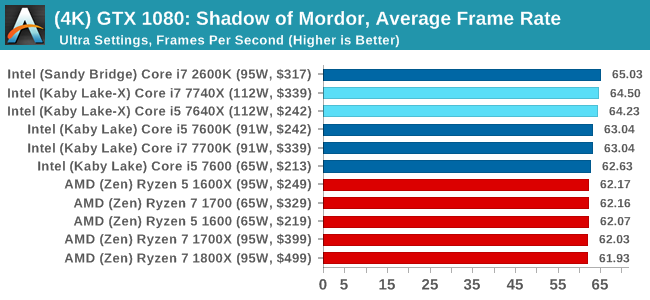
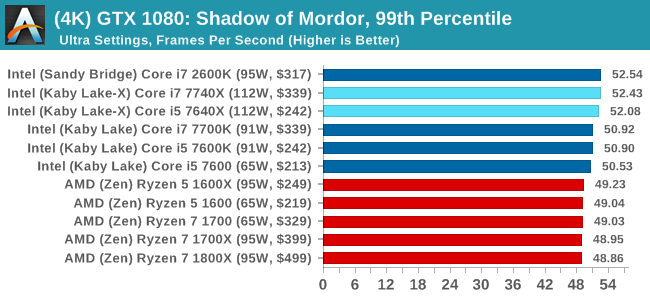
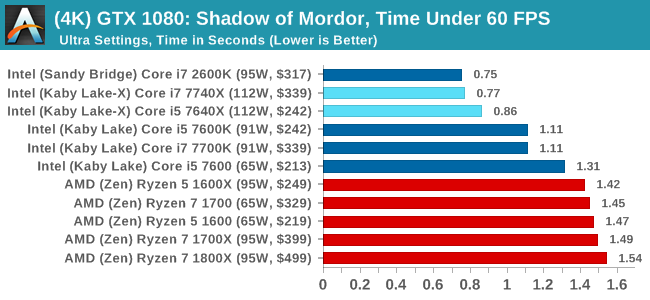
MSI GTX 1080 Gaming 8G Performance
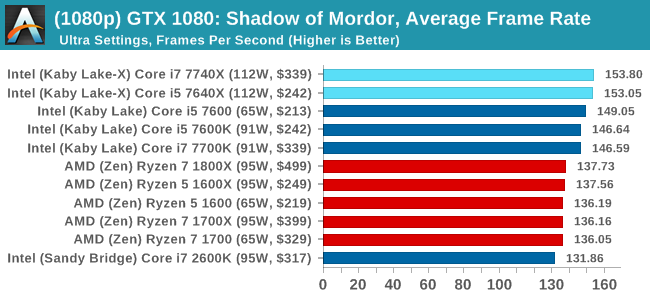
1080p
4K
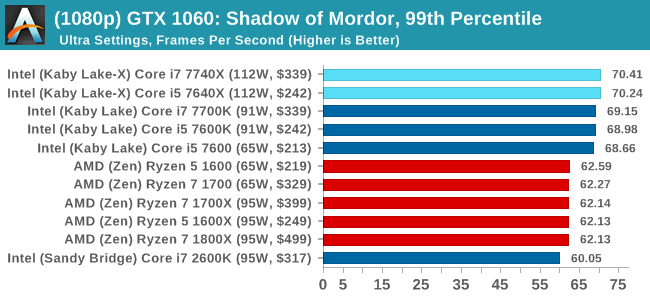
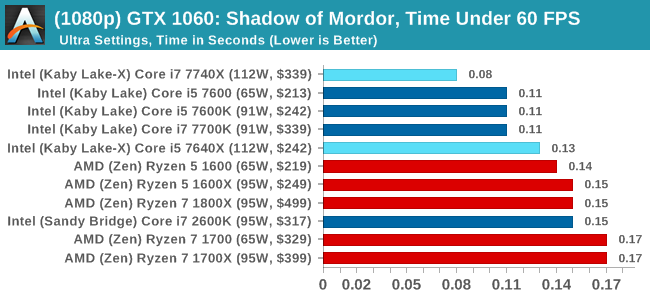
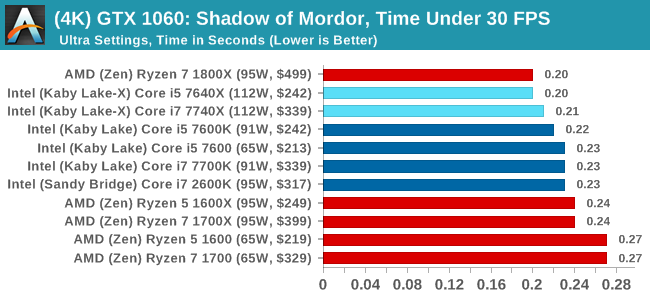
ASUS GTX 1060 Strix 6GB Performance
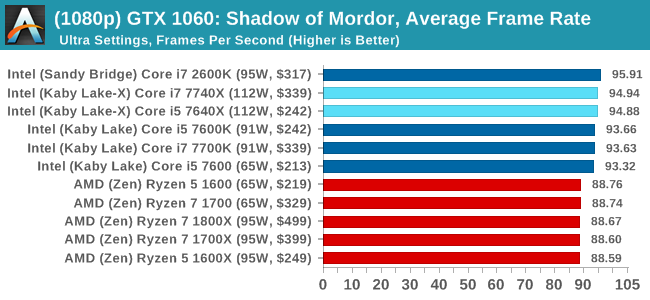
1080p
4K


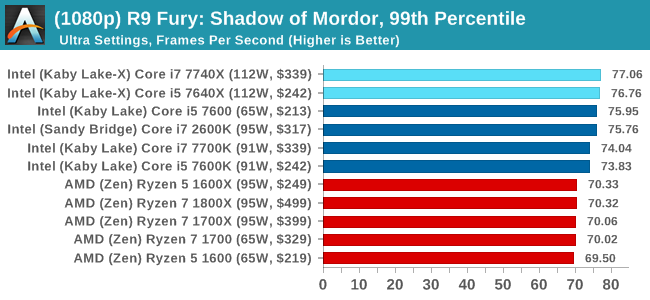
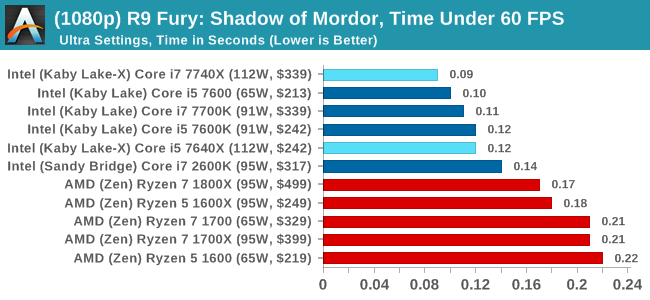
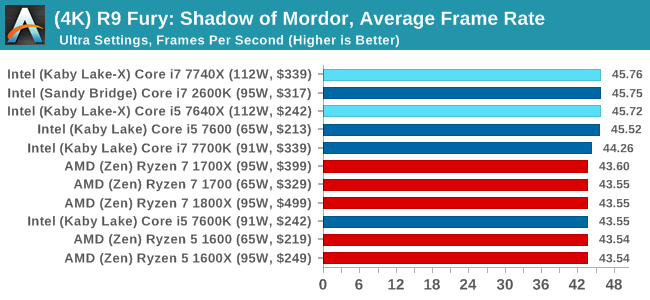
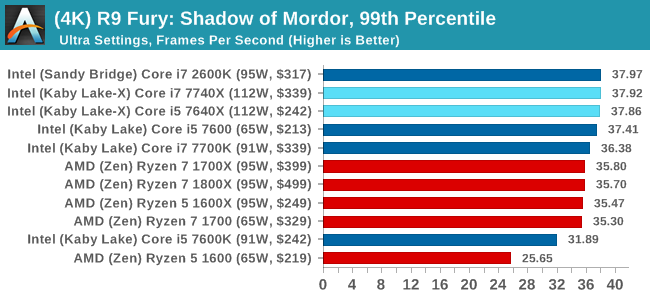
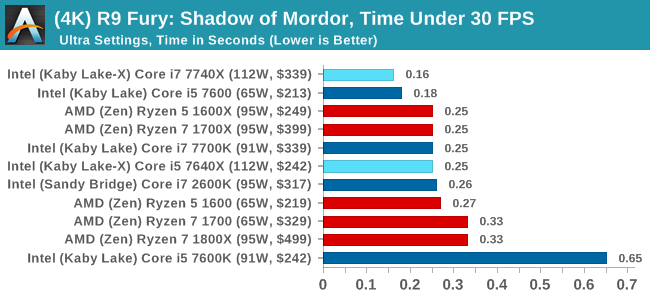
Sapphire R9 Fury 4GB Performance

1080p
4K
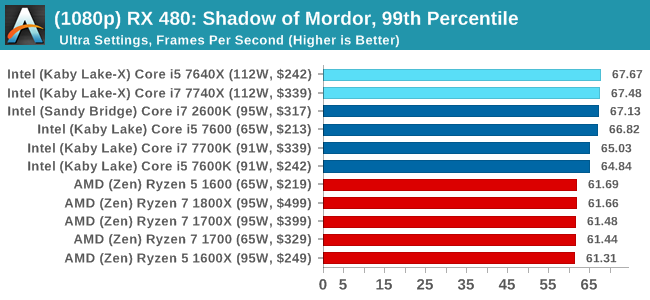
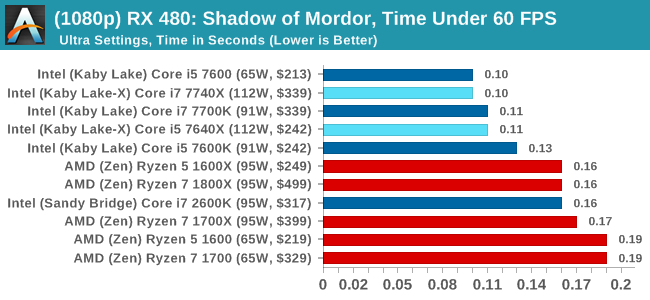
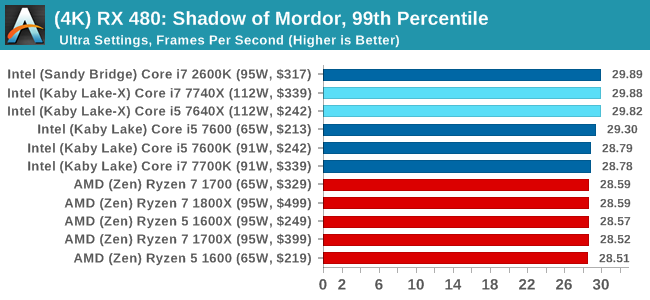
Sapphire RX 480 8GB Performance
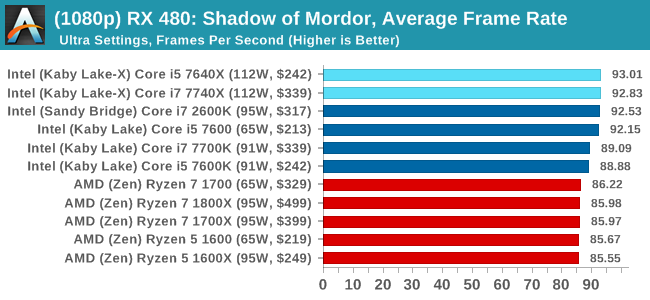
1080p
4K

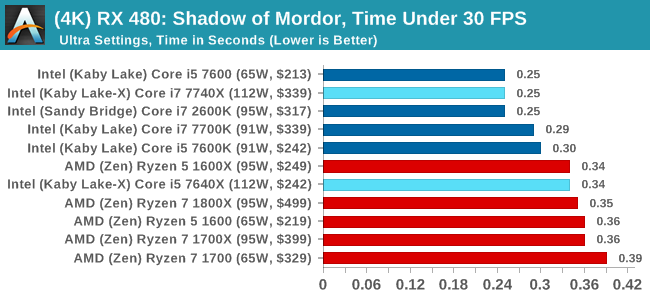
Shadow of Mordor Conclusions
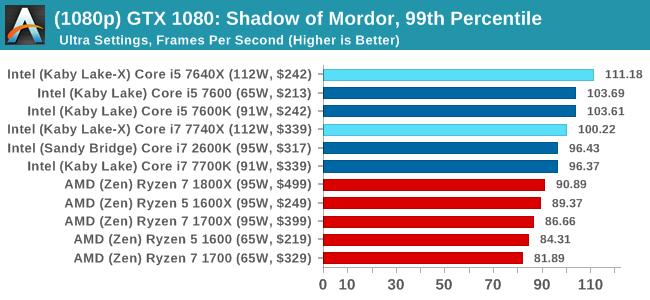
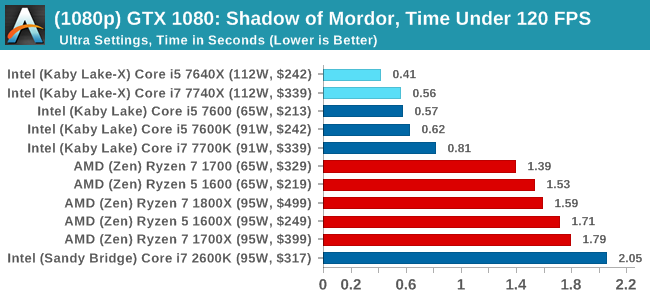
Again, a win across the board for Intel, with the Core i7 taking the top spot in pretty much every scenario. AMD isn't that far behind for the most part.


176 Comments
View All Comments
Spoelie - Monday, July 24, 2017 - link
On the first page, I assume the green highlight in the processor charts signifies an advantage for that side. Why are the cores/threads rows in the Ryzen side not highlighted? Or is 8/16 not better than 4/8?Ian Cutress - Monday, July 24, 2017 - link
Derp. Fixed.Gothmoth - Monday, July 24, 2017 - link
intel must really push money into anandtech. :) so many interesting things to report about and they spend time on a niche product.....Ian Cutress - Monday, July 24, 2017 - link
This has been in the works for a while because our CPU failed. I work on the CPU stuff - other editors work on other things ;) If you've got an idea, reach out to us. I can never guarantee anything (I've got 10+ ideas that I don't have time to do) but if it's interesting we'll see what we can do. Plus it helps us direct what other content we should be doing.halcyon - Monday, July 24, 2017 - link
This is an amazing amount of benchmarking with many options. thank you. Must have been a lot of work :-)The obvious idea is this:
Gaming (modern CPU limited and most played games) & Productive work (rendering, encoding, 4K video work, R/statistics/Matlab)
Test those under 4c/8t and 8c/16t CPUs both from AMD and Intel - all at most common non-esoteric overlock levels (+/-10%).
This is what many of your readers want:
How much does c. 5Ghz 4c/8t do vs 4.x Ghz 8c/16t when taken to it's everyday stable extreme, in modern games / productivity.
The web is already full of benchmarks at stock speed. Or overclocked Ryzen R 7 against stock Intel, or OC intel against overclocked Ryzen - and the game/app selections are not very varied.
The result is a simple graph that plots the (assumed) linear trend in performance/price and shows any deviations below/above the linear trend.
Of course, if you already have the Coffee lake 6c/12t sample, just skip the 4c/8t and go with 6c/12t vs 8c/16 comparision.
Thanks for all the hard work throughout all these years!
Ryan Smith - Monday, July 24, 2017 - link
"so many interesting things to report about and they spend time on a niche product....."What can we say? CPUs have been our favorite subject for the last 20 years.=)
user_5447 - Monday, July 24, 2017 - link
"For 2017, Intel is steering the ship in a slightly different direction, and launching the latest microarchitecture on the HEDT platform."Skylake-S, Kaby Lake-S and Kaby Lake-X share the same microarchitecture, right?
Then Skylake-X is newer microarchitecture than Kaby Lake-X (changes to L2 and L3 caches, AVX-512).
Ian Cutress - Monday, July 24, 2017 - link
Correct me if I'm wrong: SKL-SP cores are derived from SKL-S, and 14nm. KBL-S/X are 14+, and shares most of its design with SKL-S, and the main changes are power related. Underneath there's no real performance (except Speed Shift v2), but Intel classifies Kaby Lake as its latest non-AVX512 IPC microarchitecture.user_5447 - Monday, July 24, 2017 - link
Kaby Lake-S has some errata fixes compared to Skylake-S. AFAIK, this is the only change to the CPU core (besides the Speed Shift v2, if it even involved hardware changes).David Kanter says Skylake-X/EP is 14+ nm http://www.realworldtech.com/forum/?threadid=16889...
extide - Wednesday, July 26, 2017 - link
I have a buddy who works in the fabs -- SKL-X is still on plain 14nm