The Intel Kaby Lake-X i7 7740X and i5 7640X Review: The New Single-Threaded Champion, OC to 5GHz
by Ian Cutress on July 24, 2017 8:30 AM EST- Posted in
- CPUs
- Intel
- Kaby Lake
- X299
- Basin Falls
- Kaby Lake-X
- i7-7740X
- i5-7640X
Benchmarking Performance: CPU Legacy Tests
Our legacy tests represent benchmarks that were once at the height of their time. Some of these are industry standard synthetics, and we have data going back over 10 years. All of the data here has been rerun on Windows 10, and we plan to go back several generations of components to see how performance has evolved.
All of our benchmark results can also be found in our benchmark engine, Bench.
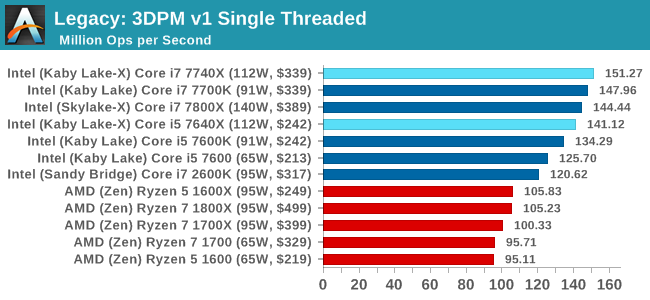
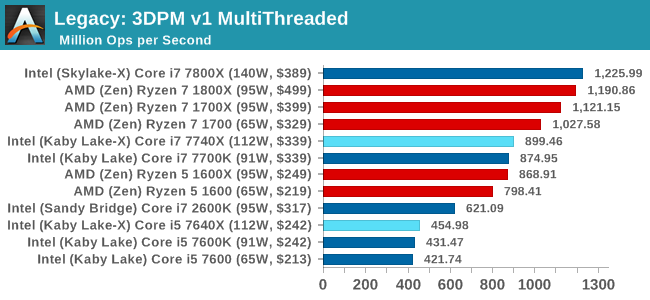
3D Particle Movement v1
3DPM is a self-penned benchmark, taking basic 3D movement algorithms used in Brownian Motion simulations and testing them for speed. High floating point performance, MHz and IPC wins in the single thread version, whereas the multithread version has to handle the threads and loves more cores. This is the original version, written in the style of a typical non-computer science student coding up an algorithm for their theoretical problem, and comes without any non-obvious optimizations not already performed by the compiler, such as false sharing.
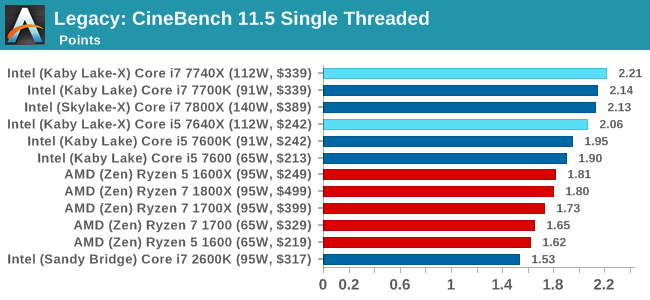
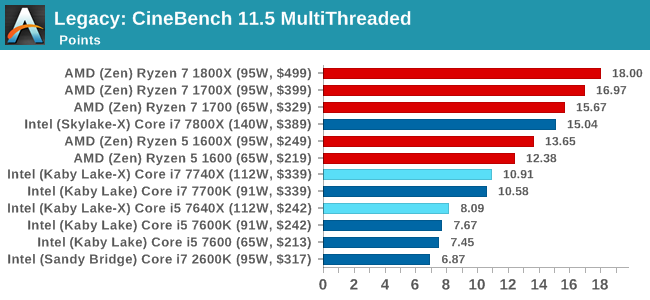
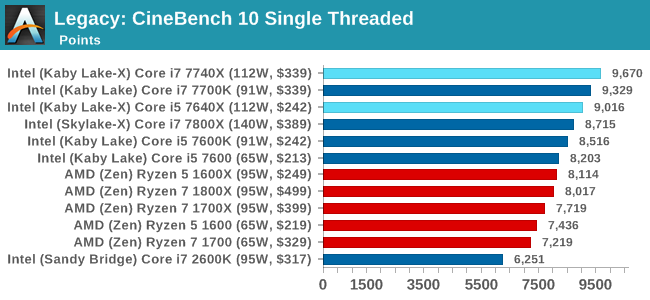
CineBench 11.5 and 10
Cinebench is a widely known benchmarking tool for measuring performance relative to MAXON's animation software Cinema 4D. Cinebench has been optimized over a decade and focuses on purely CPU horsepower, meaning if there is a discrepancy in pure throughput characteristics, Cinebench is likely to show that discrepancy. Arguably other software doesn't make use of all the tools available, so the real world relevance might purely be academic, but given our large database of data for Cinebench it seems difficult to ignore a small five-minute test. We run the modern version 15 in this test, as well as the older 11.5 and 10 due to our back data.
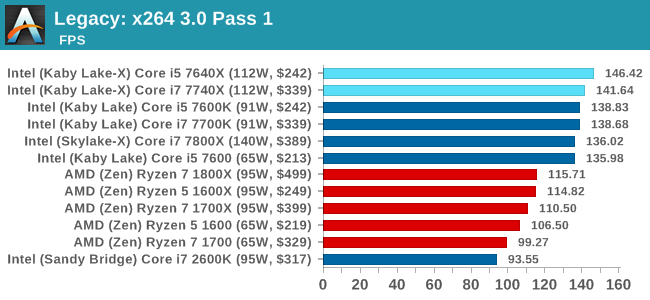
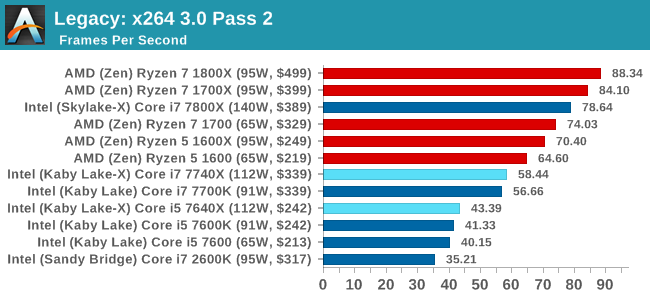
x264 HD 3.0
Similarly, the x264 HD 3.0 package we use here is also kept for historic regressional data. The latest version is 5.0.1, and encodes a 1080p video clip into a high-quality x264 file. Version 3.0 only performs the same test on a 720p file, and in most circumstances the software performance hits its limit on high-end processors, but still works well for mainstream and low-end. Also, this version only takes a few minutes, whereas the latest can take over 90 minutes to run.


176 Comments
View All Comments
Spoelie - Monday, July 24, 2017 - link
On the first page, I assume the green highlight in the processor charts signifies an advantage for that side. Why are the cores/threads rows in the Ryzen side not highlighted? Or is 8/16 not better than 4/8?Ian Cutress - Monday, July 24, 2017 - link
Derp. Fixed.Gothmoth - Monday, July 24, 2017 - link
intel must really push money into anandtech. :) so many interesting things to report about and they spend time on a niche product.....Ian Cutress - Monday, July 24, 2017 - link
This has been in the works for a while because our CPU failed. I work on the CPU stuff - other editors work on other things ;) If you've got an idea, reach out to us. I can never guarantee anything (I've got 10+ ideas that I don't have time to do) but if it's interesting we'll see what we can do. Plus it helps us direct what other content we should be doing.halcyon - Monday, July 24, 2017 - link
This is an amazing amount of benchmarking with many options. thank you. Must have been a lot of work :-)The obvious idea is this:
Gaming (modern CPU limited and most played games) & Productive work (rendering, encoding, 4K video work, R/statistics/Matlab)
Test those under 4c/8t and 8c/16t CPUs both from AMD and Intel - all at most common non-esoteric overlock levels (+/-10%).
This is what many of your readers want:
How much does c. 5Ghz 4c/8t do vs 4.x Ghz 8c/16t when taken to it's everyday stable extreme, in modern games / productivity.
The web is already full of benchmarks at stock speed. Or overclocked Ryzen R 7 against stock Intel, or OC intel against overclocked Ryzen - and the game/app selections are not very varied.
The result is a simple graph that plots the (assumed) linear trend in performance/price and shows any deviations below/above the linear trend.
Of course, if you already have the Coffee lake 6c/12t sample, just skip the 4c/8t and go with 6c/12t vs 8c/16 comparision.
Thanks for all the hard work throughout all these years!
Ryan Smith - Monday, July 24, 2017 - link
"so many interesting things to report about and they spend time on a niche product....."What can we say? CPUs have been our favorite subject for the last 20 years.=)
user_5447 - Monday, July 24, 2017 - link
"For 2017, Intel is steering the ship in a slightly different direction, and launching the latest microarchitecture on the HEDT platform."Skylake-S, Kaby Lake-S and Kaby Lake-X share the same microarchitecture, right?
Then Skylake-X is newer microarchitecture than Kaby Lake-X (changes to L2 and L3 caches, AVX-512).
Ian Cutress - Monday, July 24, 2017 - link
Correct me if I'm wrong: SKL-SP cores are derived from SKL-S, and 14nm. KBL-S/X are 14+, and shares most of its design with SKL-S, and the main changes are power related. Underneath there's no real performance (except Speed Shift v2), but Intel classifies Kaby Lake as its latest non-AVX512 IPC microarchitecture.user_5447 - Monday, July 24, 2017 - link
Kaby Lake-S has some errata fixes compared to Skylake-S. AFAIK, this is the only change to the CPU core (besides the Speed Shift v2, if it even involved hardware changes).David Kanter says Skylake-X/EP is 14+ nm http://www.realworldtech.com/forum/?threadid=16889...
extide - Wednesday, July 26, 2017 - link
I have a buddy who works in the fabs -- SKL-X is still on plain 14nm