The Intel Kaby Lake-X i7 7740X and i5 7640X Review: The New Single-Threaded Champion, OC to 5GHz
by Ian Cutress on July 24, 2017 8:30 AM EST- Posted in
- CPUs
- Intel
- Kaby Lake
- X299
- Basin Falls
- Kaby Lake-X
- i7-7740X
- i5-7640X
Rise of the Tomb Raider
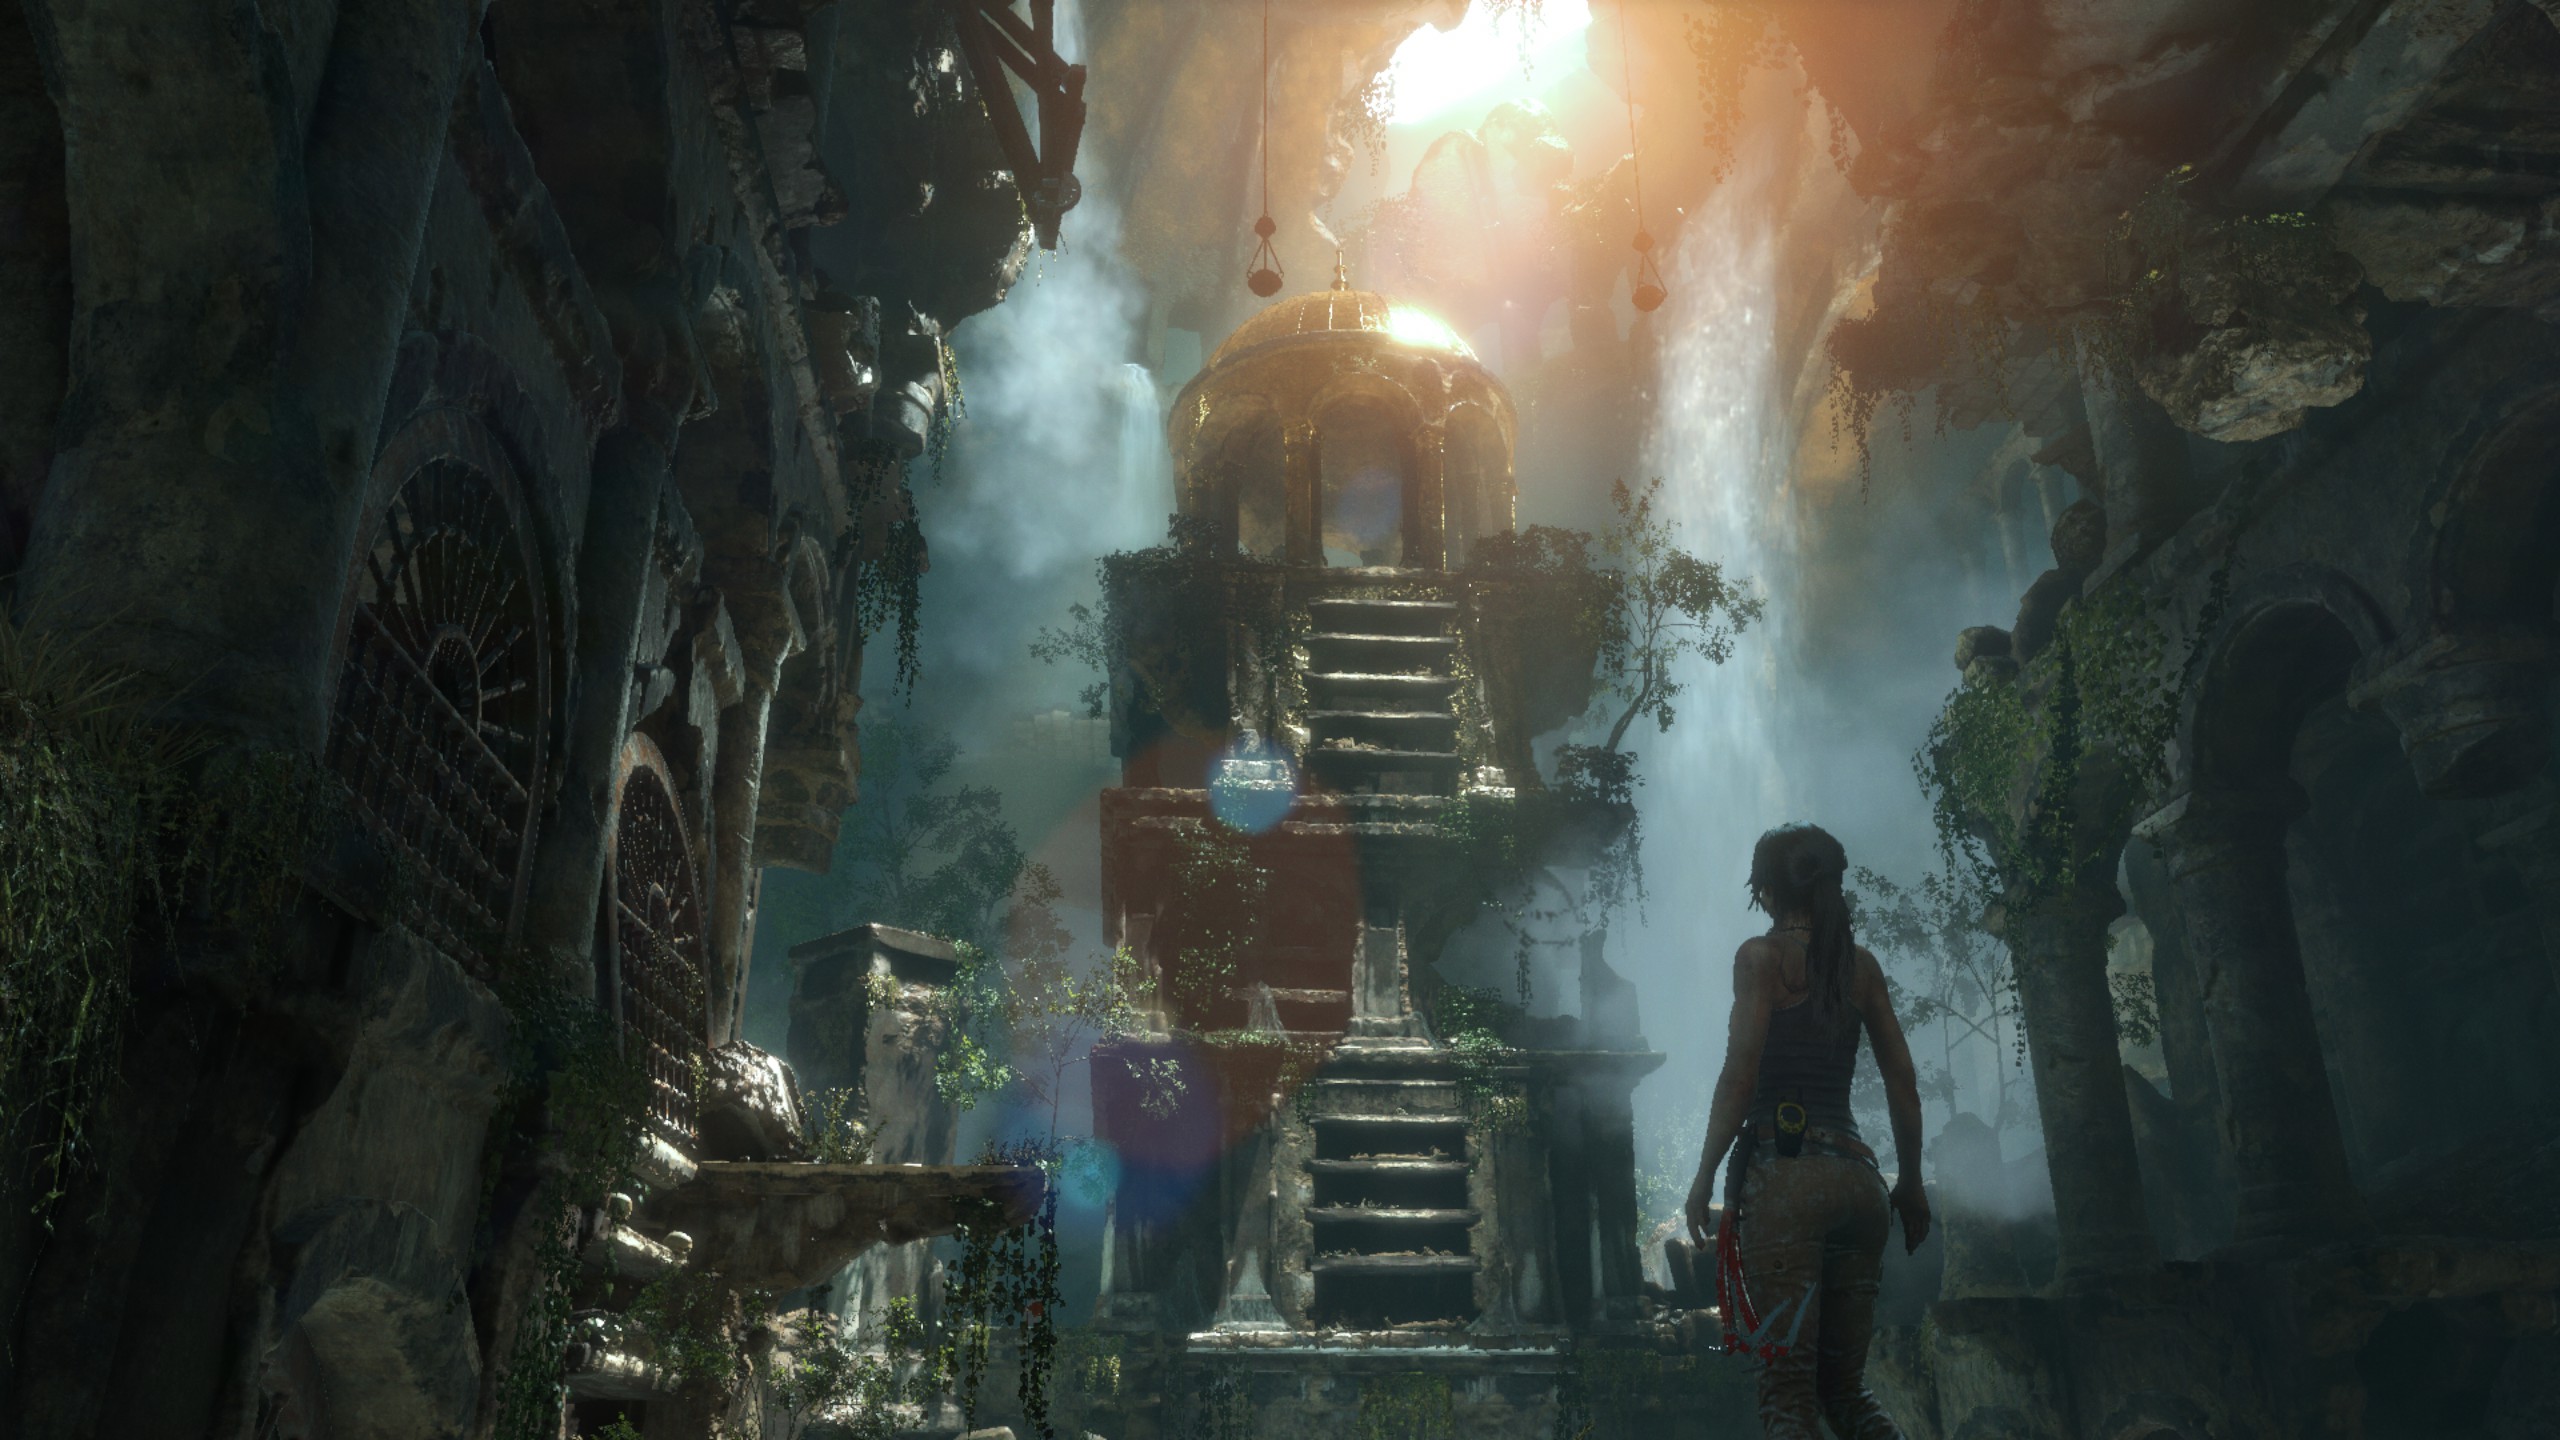
One of the newest games in the gaming benchmark suite is Rise of the Tomb Raider (RoTR), developed by Crystal Dynamics, and the sequel to the popular Tomb Raider which was loved for its automated benchmark mode. But don’t let that fool you: the benchmark mode in RoTR is very much different this time around.
Visually, the previous Tomb Raider pushed realism to the limits with features such as TressFX, and the new RoTR goes one stage further when it comes to graphics fidelity. This leads to an interesting set of requirements in hardware: some sections of the game are typically GPU limited, whereas others with a lot of long-range physics can be CPU limited, depending on how the driver can translate the DirectX 12 workload.
Where the old game had one benchmark scene, the new game has three different scenes with different requirements: Geothermal Valley (1-Valley), Prophet’s Tomb (2-Prophet) and Spine of the Mountain (3-Mountain) - and we test all three. These are three scenes designed to be taken from the game, but it has been noted that scenes like 2-Prophet shown in the benchmark can be the most CPU limited elements of that entire level, and the scene shown is only a small portion of that level. Because of this, we report the results for each scene on each graphics card separately.

Graphics options for RoTR are similar to other games in this type, offering some presets or allowing the user to configure texture quality, anisotropic filter levels, shadow quality, soft shadows, occlusion, depth of field, tessellation, reflections, foliage, bloom, and features like PureHair which updates on TressFX in the previous game.
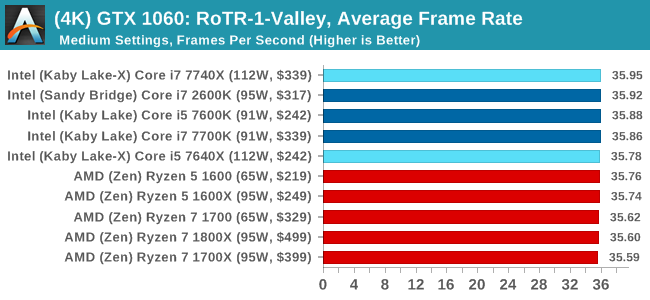
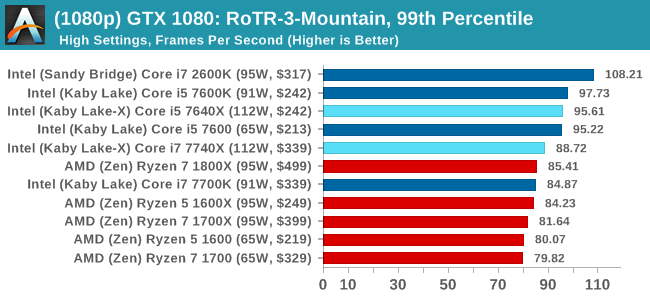
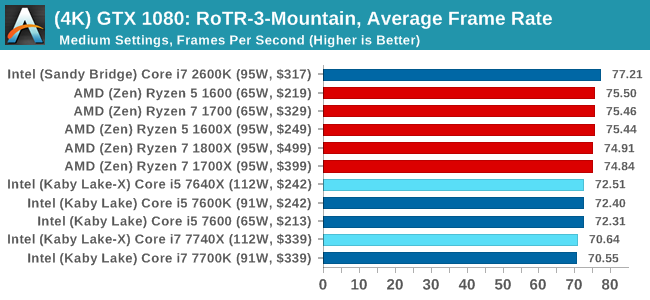
Again, we test at 1920x1080 and 4K using our native 4K displays. At 1080p we run the High preset, while at 4K we use the Medium preset which still takes a sizable hit in frame rate.
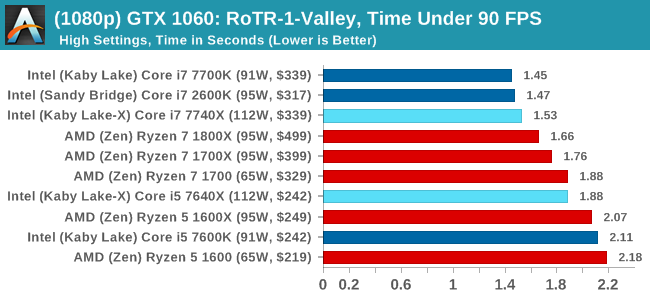
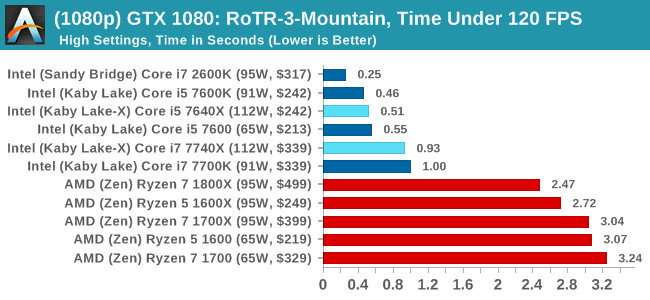
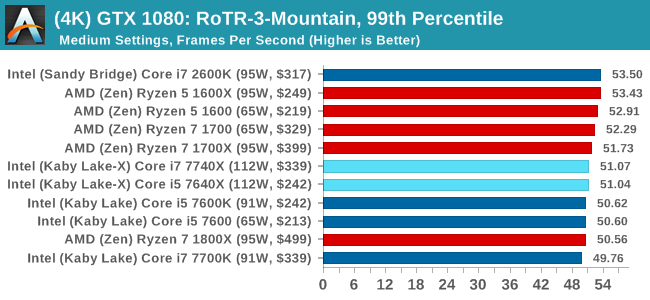
It is worth noting that RoTR is a little different to our other benchmarks in that it keeps its graphics settings in the registry rather than a standard ini file, and unlike the previous TR game the benchmark cannot be called from the command-line. Nonetheless we scripted around these issues to automate the benchmark four times and parse the results. From the frame time data, we report the averages, 99th percentiles, and our time under analysis.
For all our results, we show the average frame rate at 1080p first. Mouse over the other graphs underneath to see 99th percentile frame rates and 'Time Under' graphs, as well as results for other resolutions. All of our benchmark results can also be found in our benchmark engine, Bench.
#1 Geothermal Valley

MSI GTX 1080 Gaming 8G Performance
1080p
4K
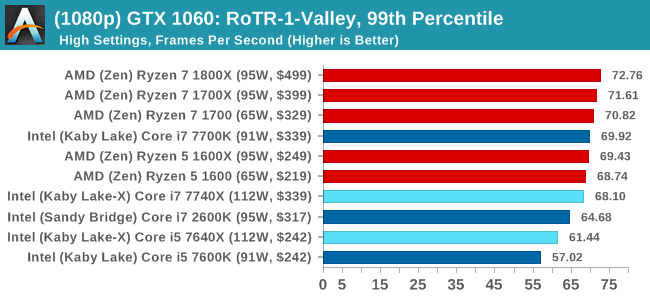
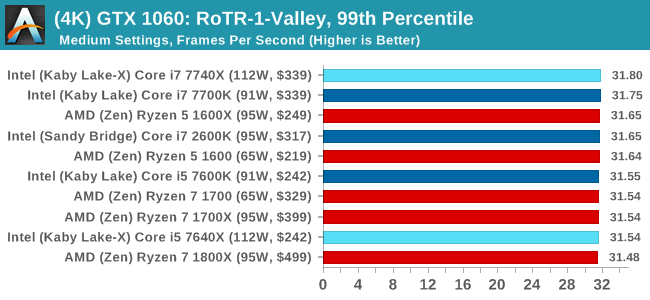
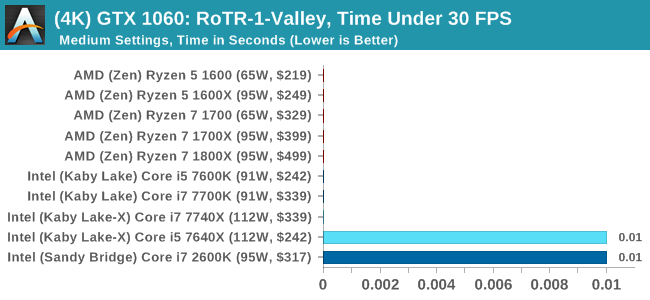
ASUS GTX 1060 Strix 6GB Performance
1080p
4K
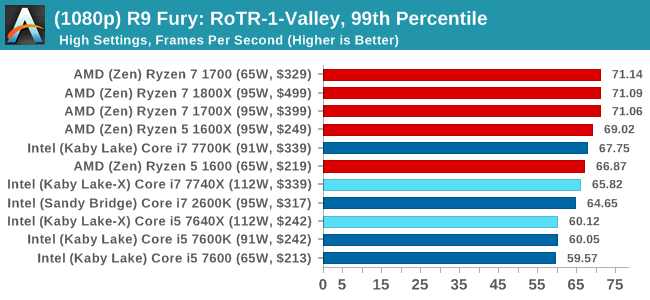
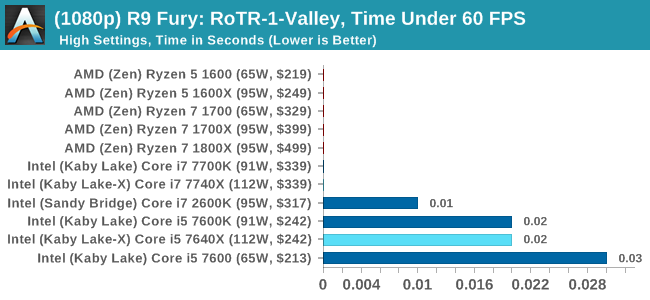
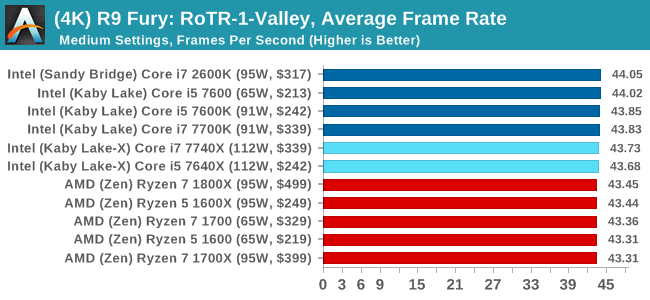
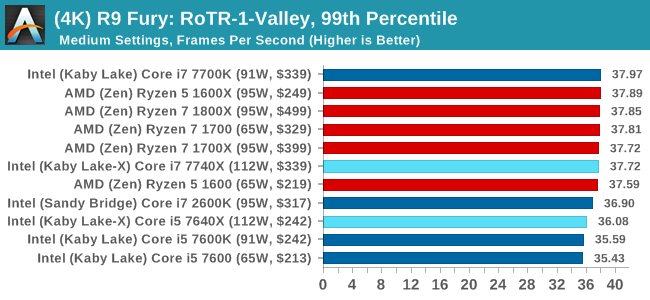
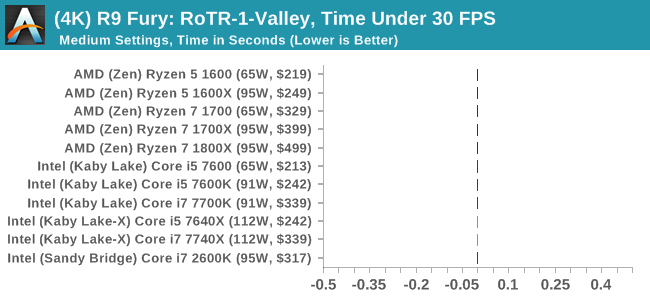
Sapphire R9 Fury 4GB Performance
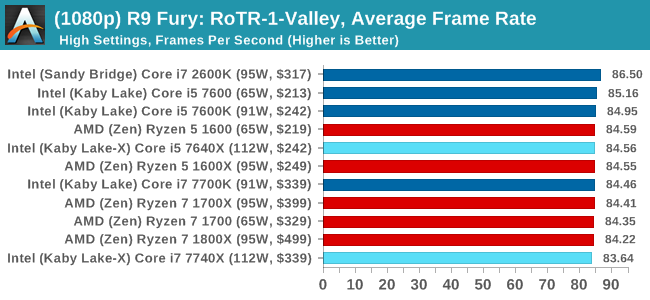
1080p
4K
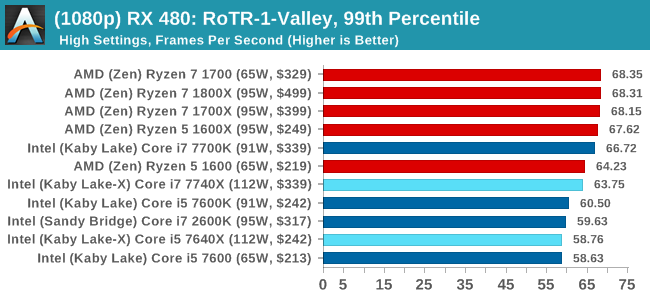
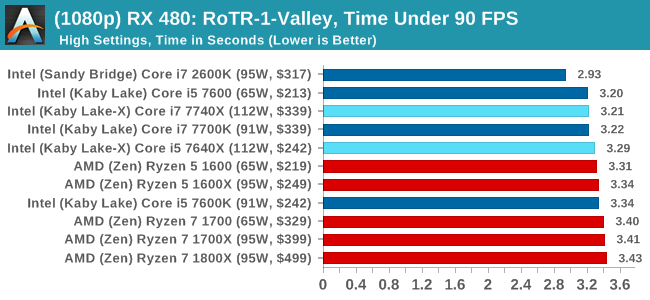
Sapphire RX 480 8GB Performance
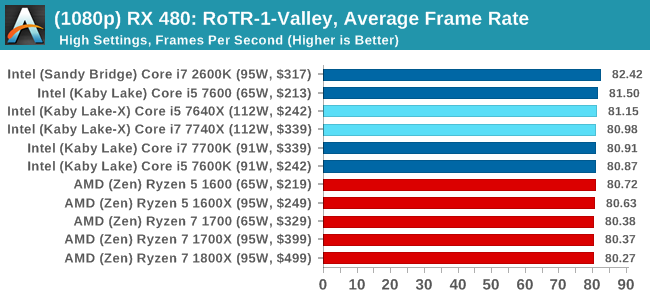
1080p
4K
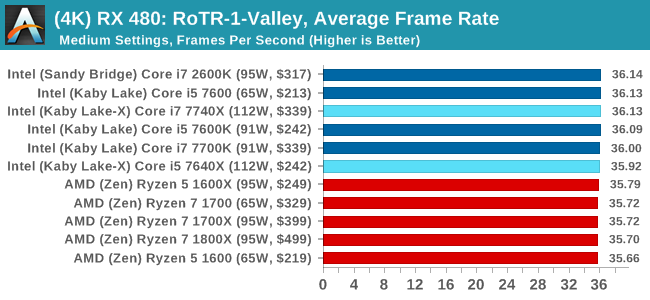
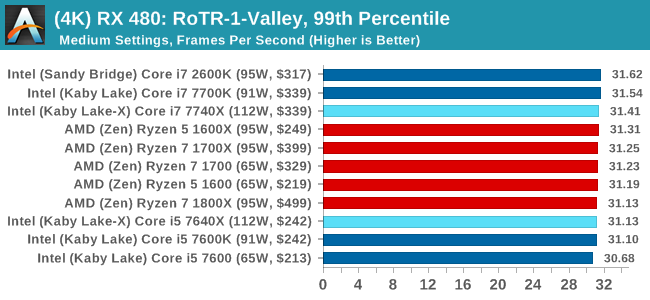
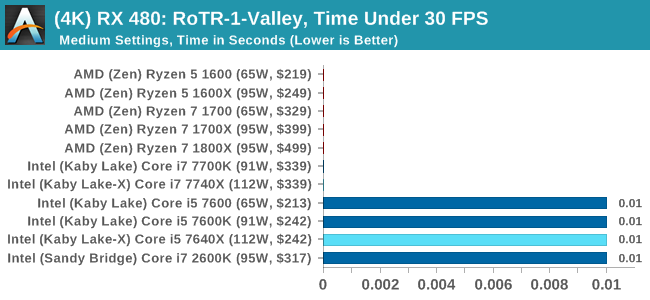
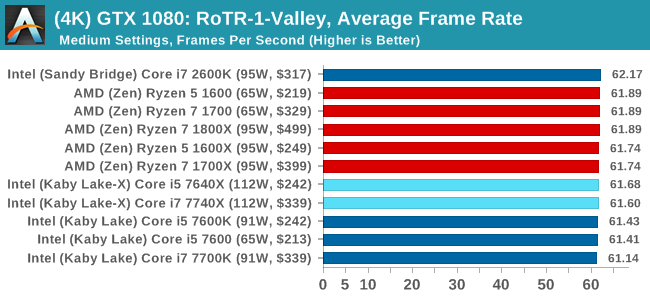
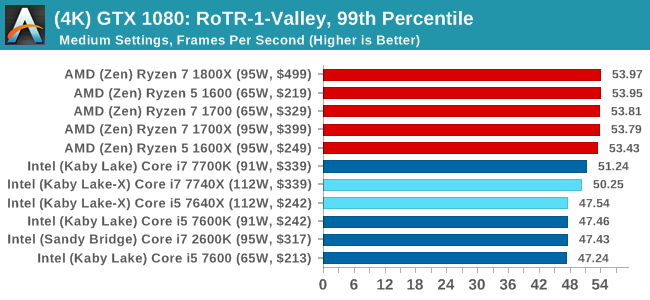
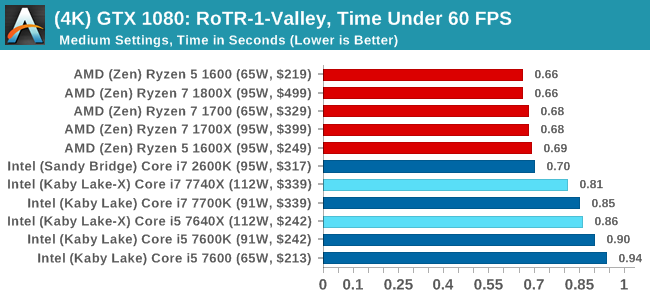
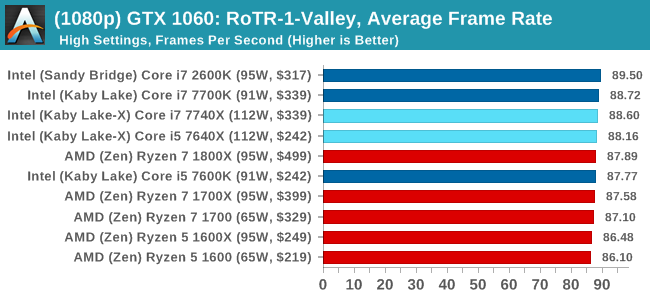
RoTR: Geothermal Valley Conclusions
If we were testing a single GTX 1080 at 1080p, you might think that the graph looks a little odd. All the quad-core, non HT processors (so, the Core i5s) get the best frame rates and percentiles on this specific test on this specific hardware by a good margin. The rest of the tests do not mirror that result though, with the results ping-ponging between Intel and AMD depending on the resolution and the graphics card.
#2 Prophet's Tomb
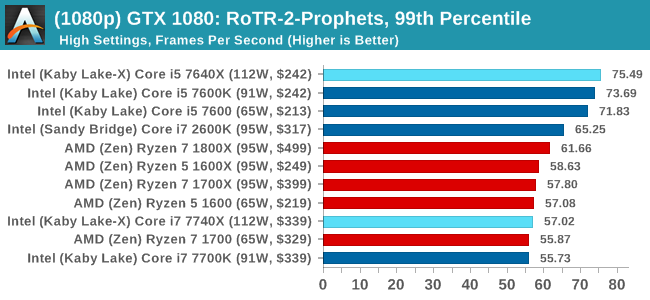
MSI GTX 1080 Gaming 8G Performance
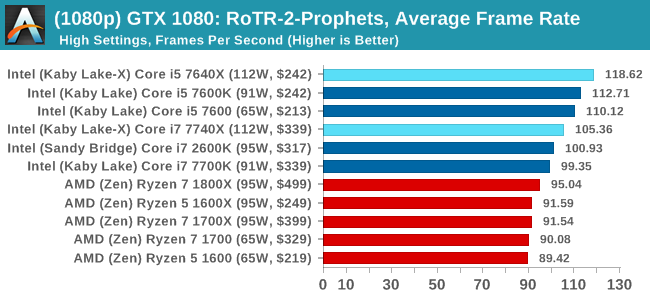
1080p
4K
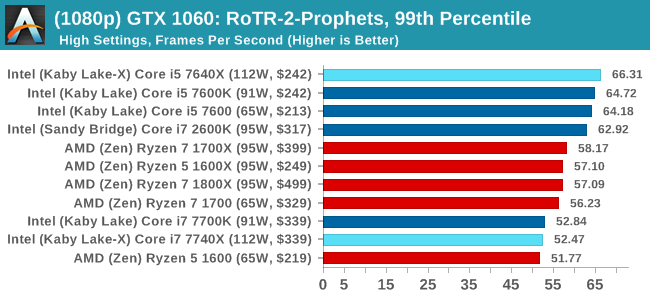
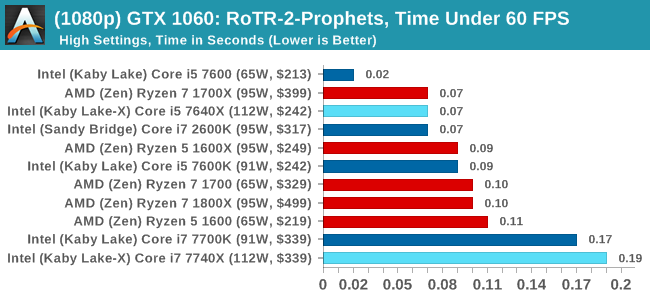
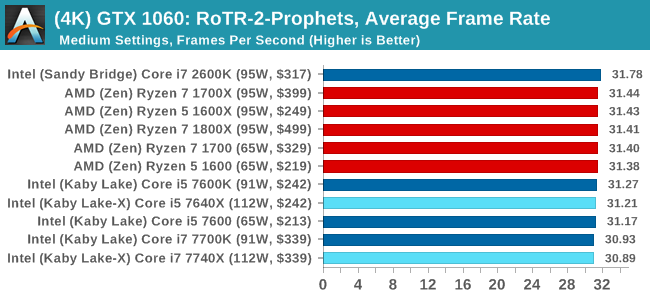
ASUS GTX 1060 Strix 6GB Performance
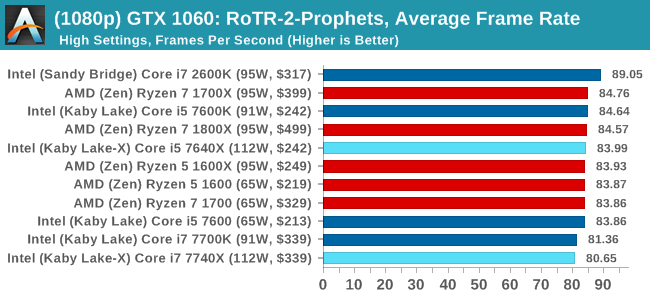
1080p
4K
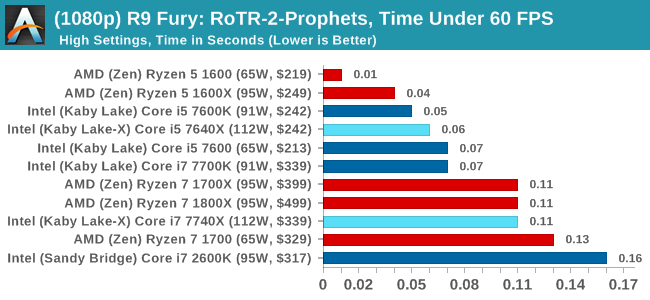
Sapphire R9 Fury 4GB Performance
1080p
4K
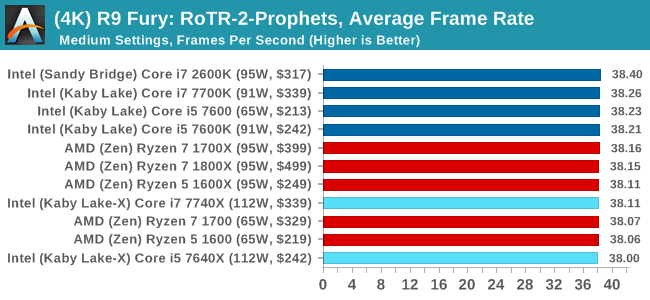
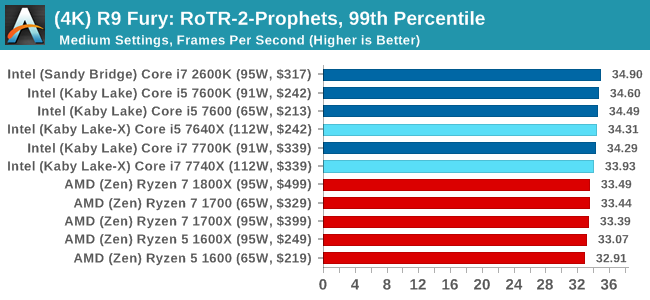
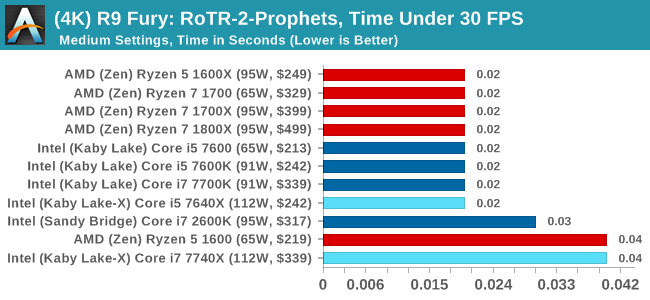
Sapphire RX 480 8GB Performance
1080p
4K
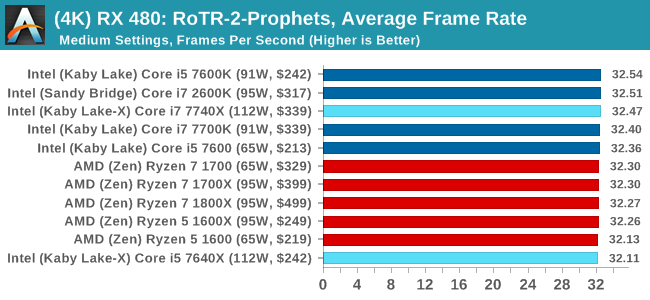
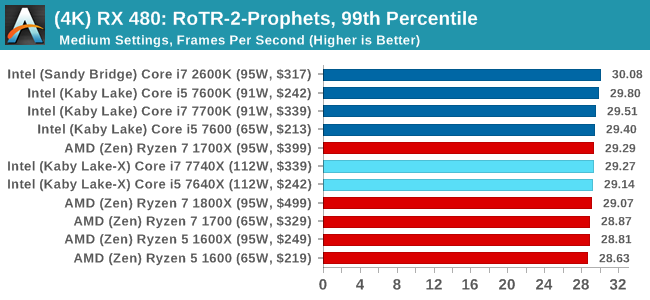
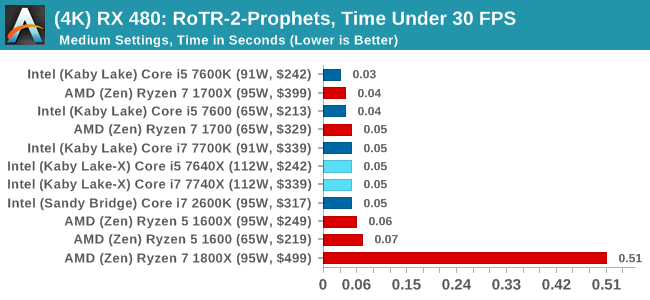
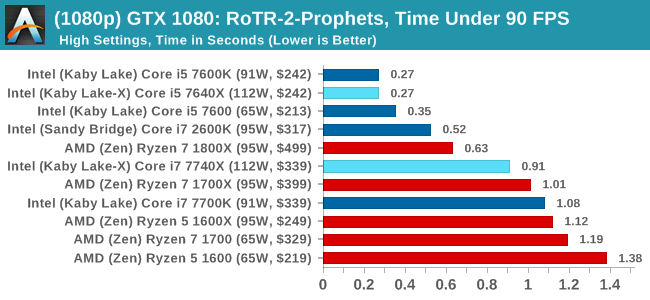
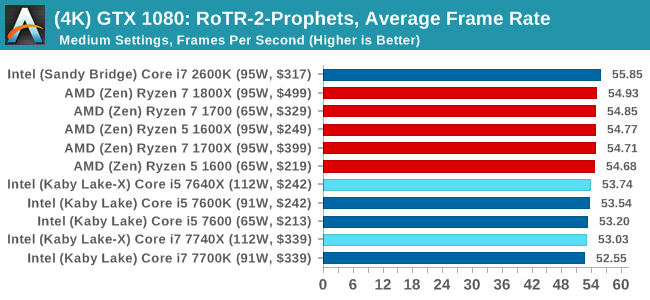
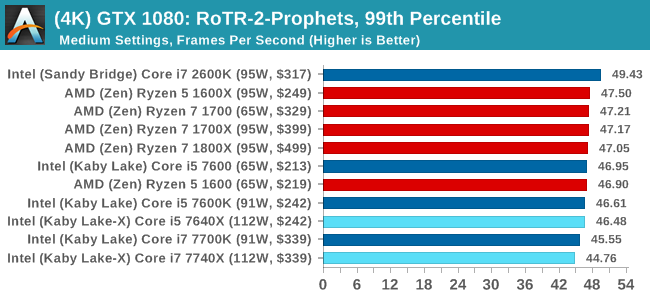
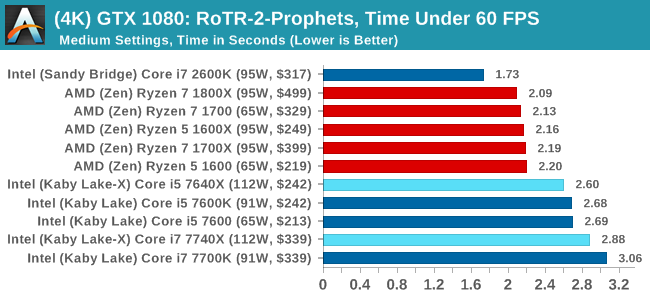
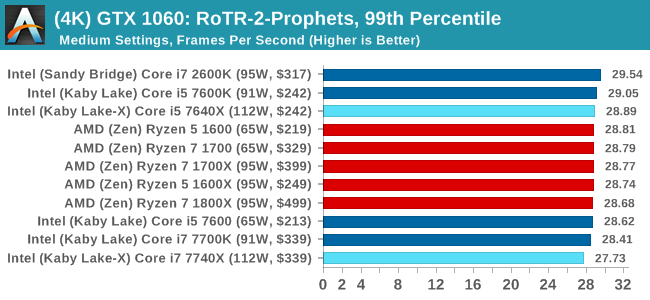
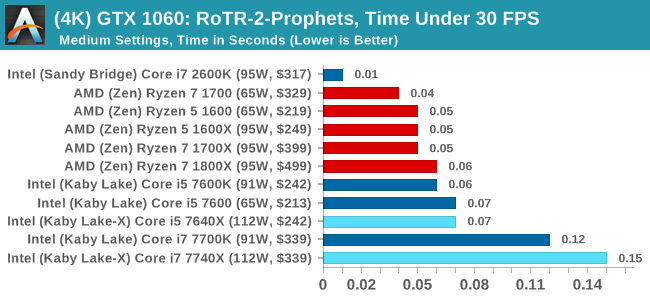
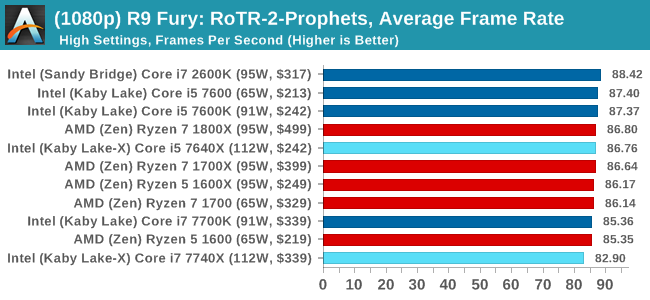
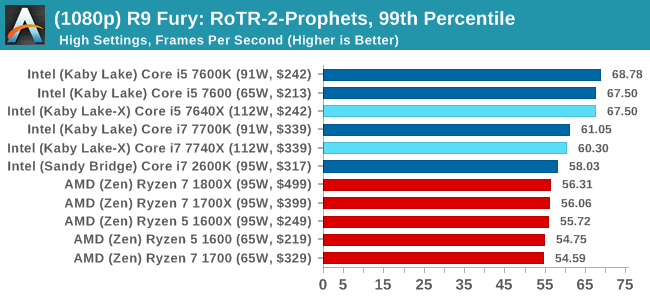
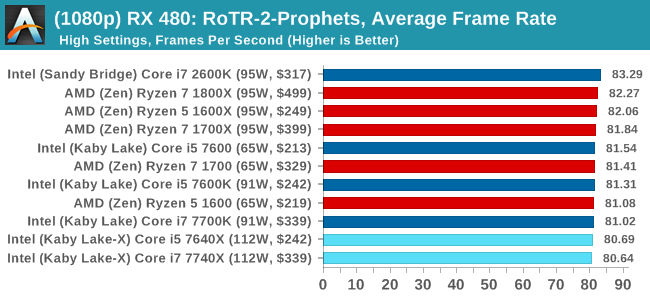
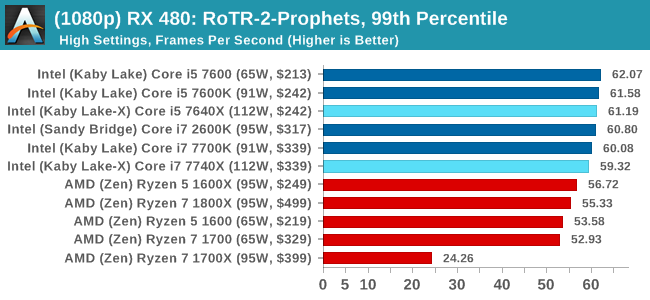
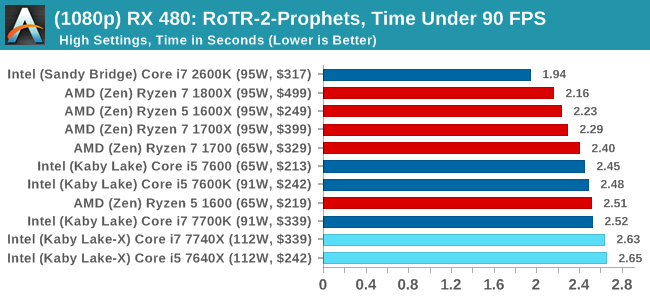
RoTR: Prophet's Tomb Conclusions
For Prophet's Tomb, we again see the Core i5s pull a win at 1080p using the GTX 1080, but the rest of the tests are a mix of results, some siding with AMD and others for Intel. There is the odd outlier in the Time Under analysis, which may warrant further inspection.
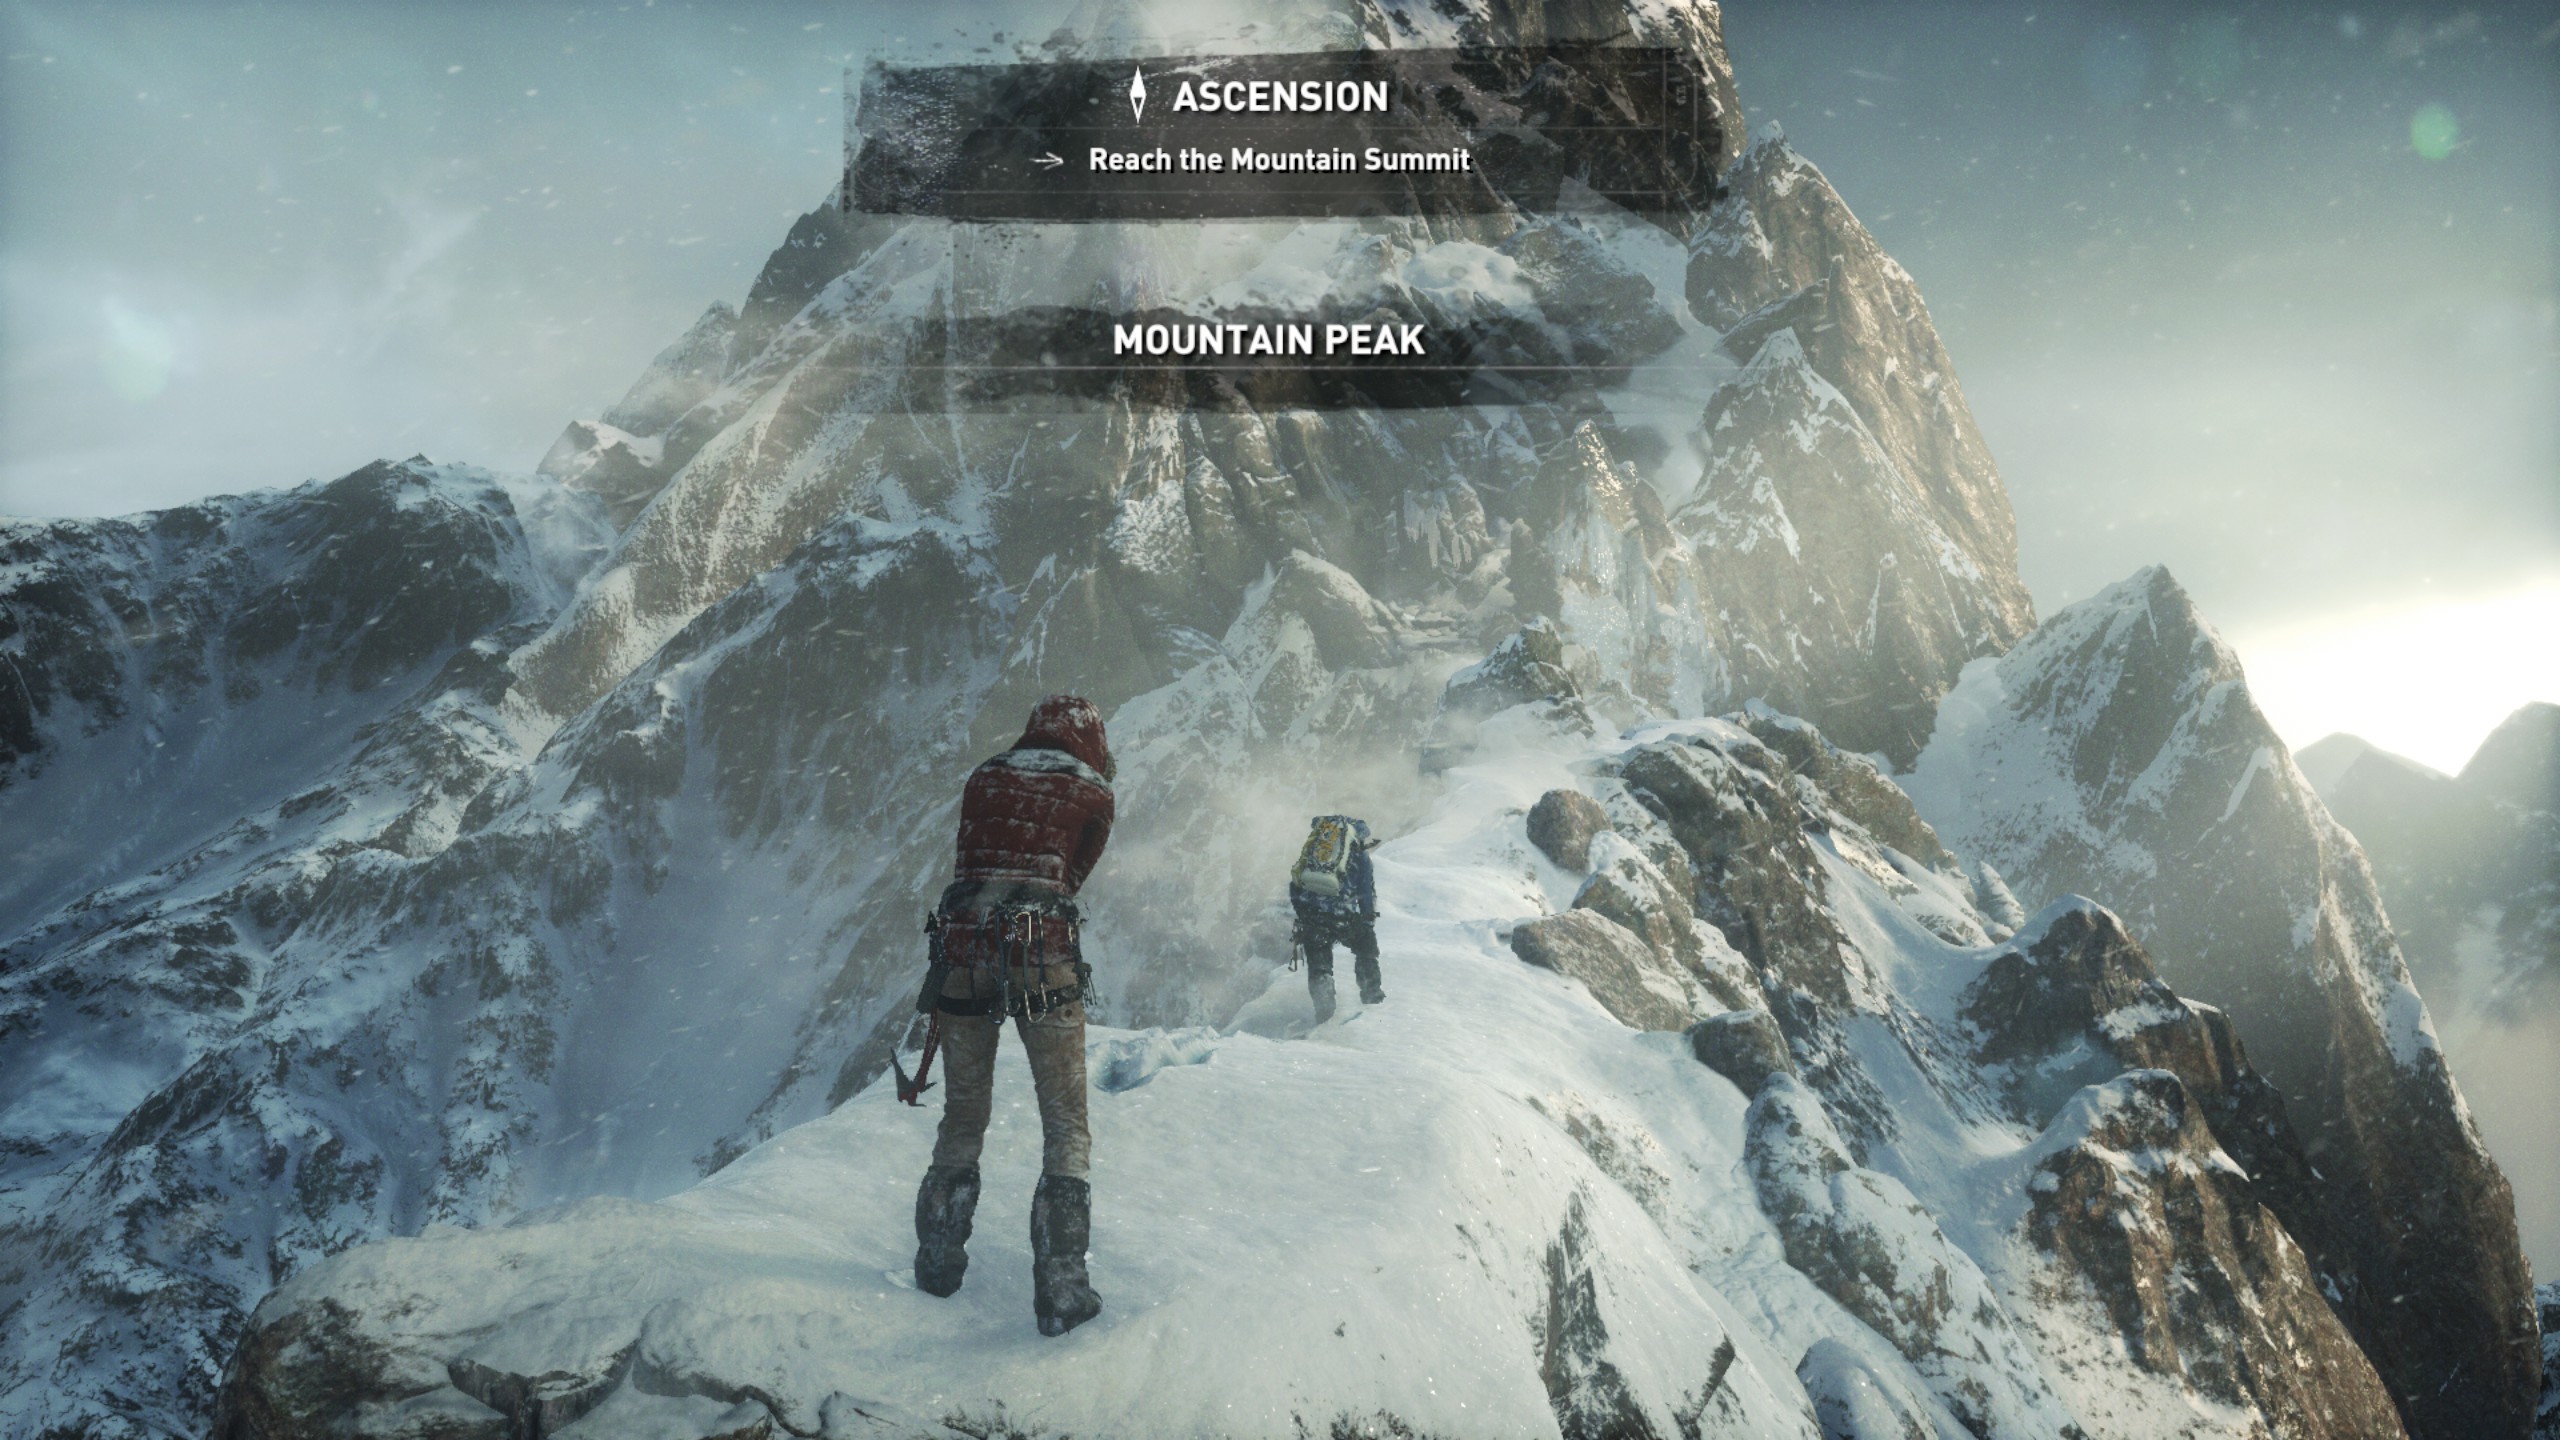
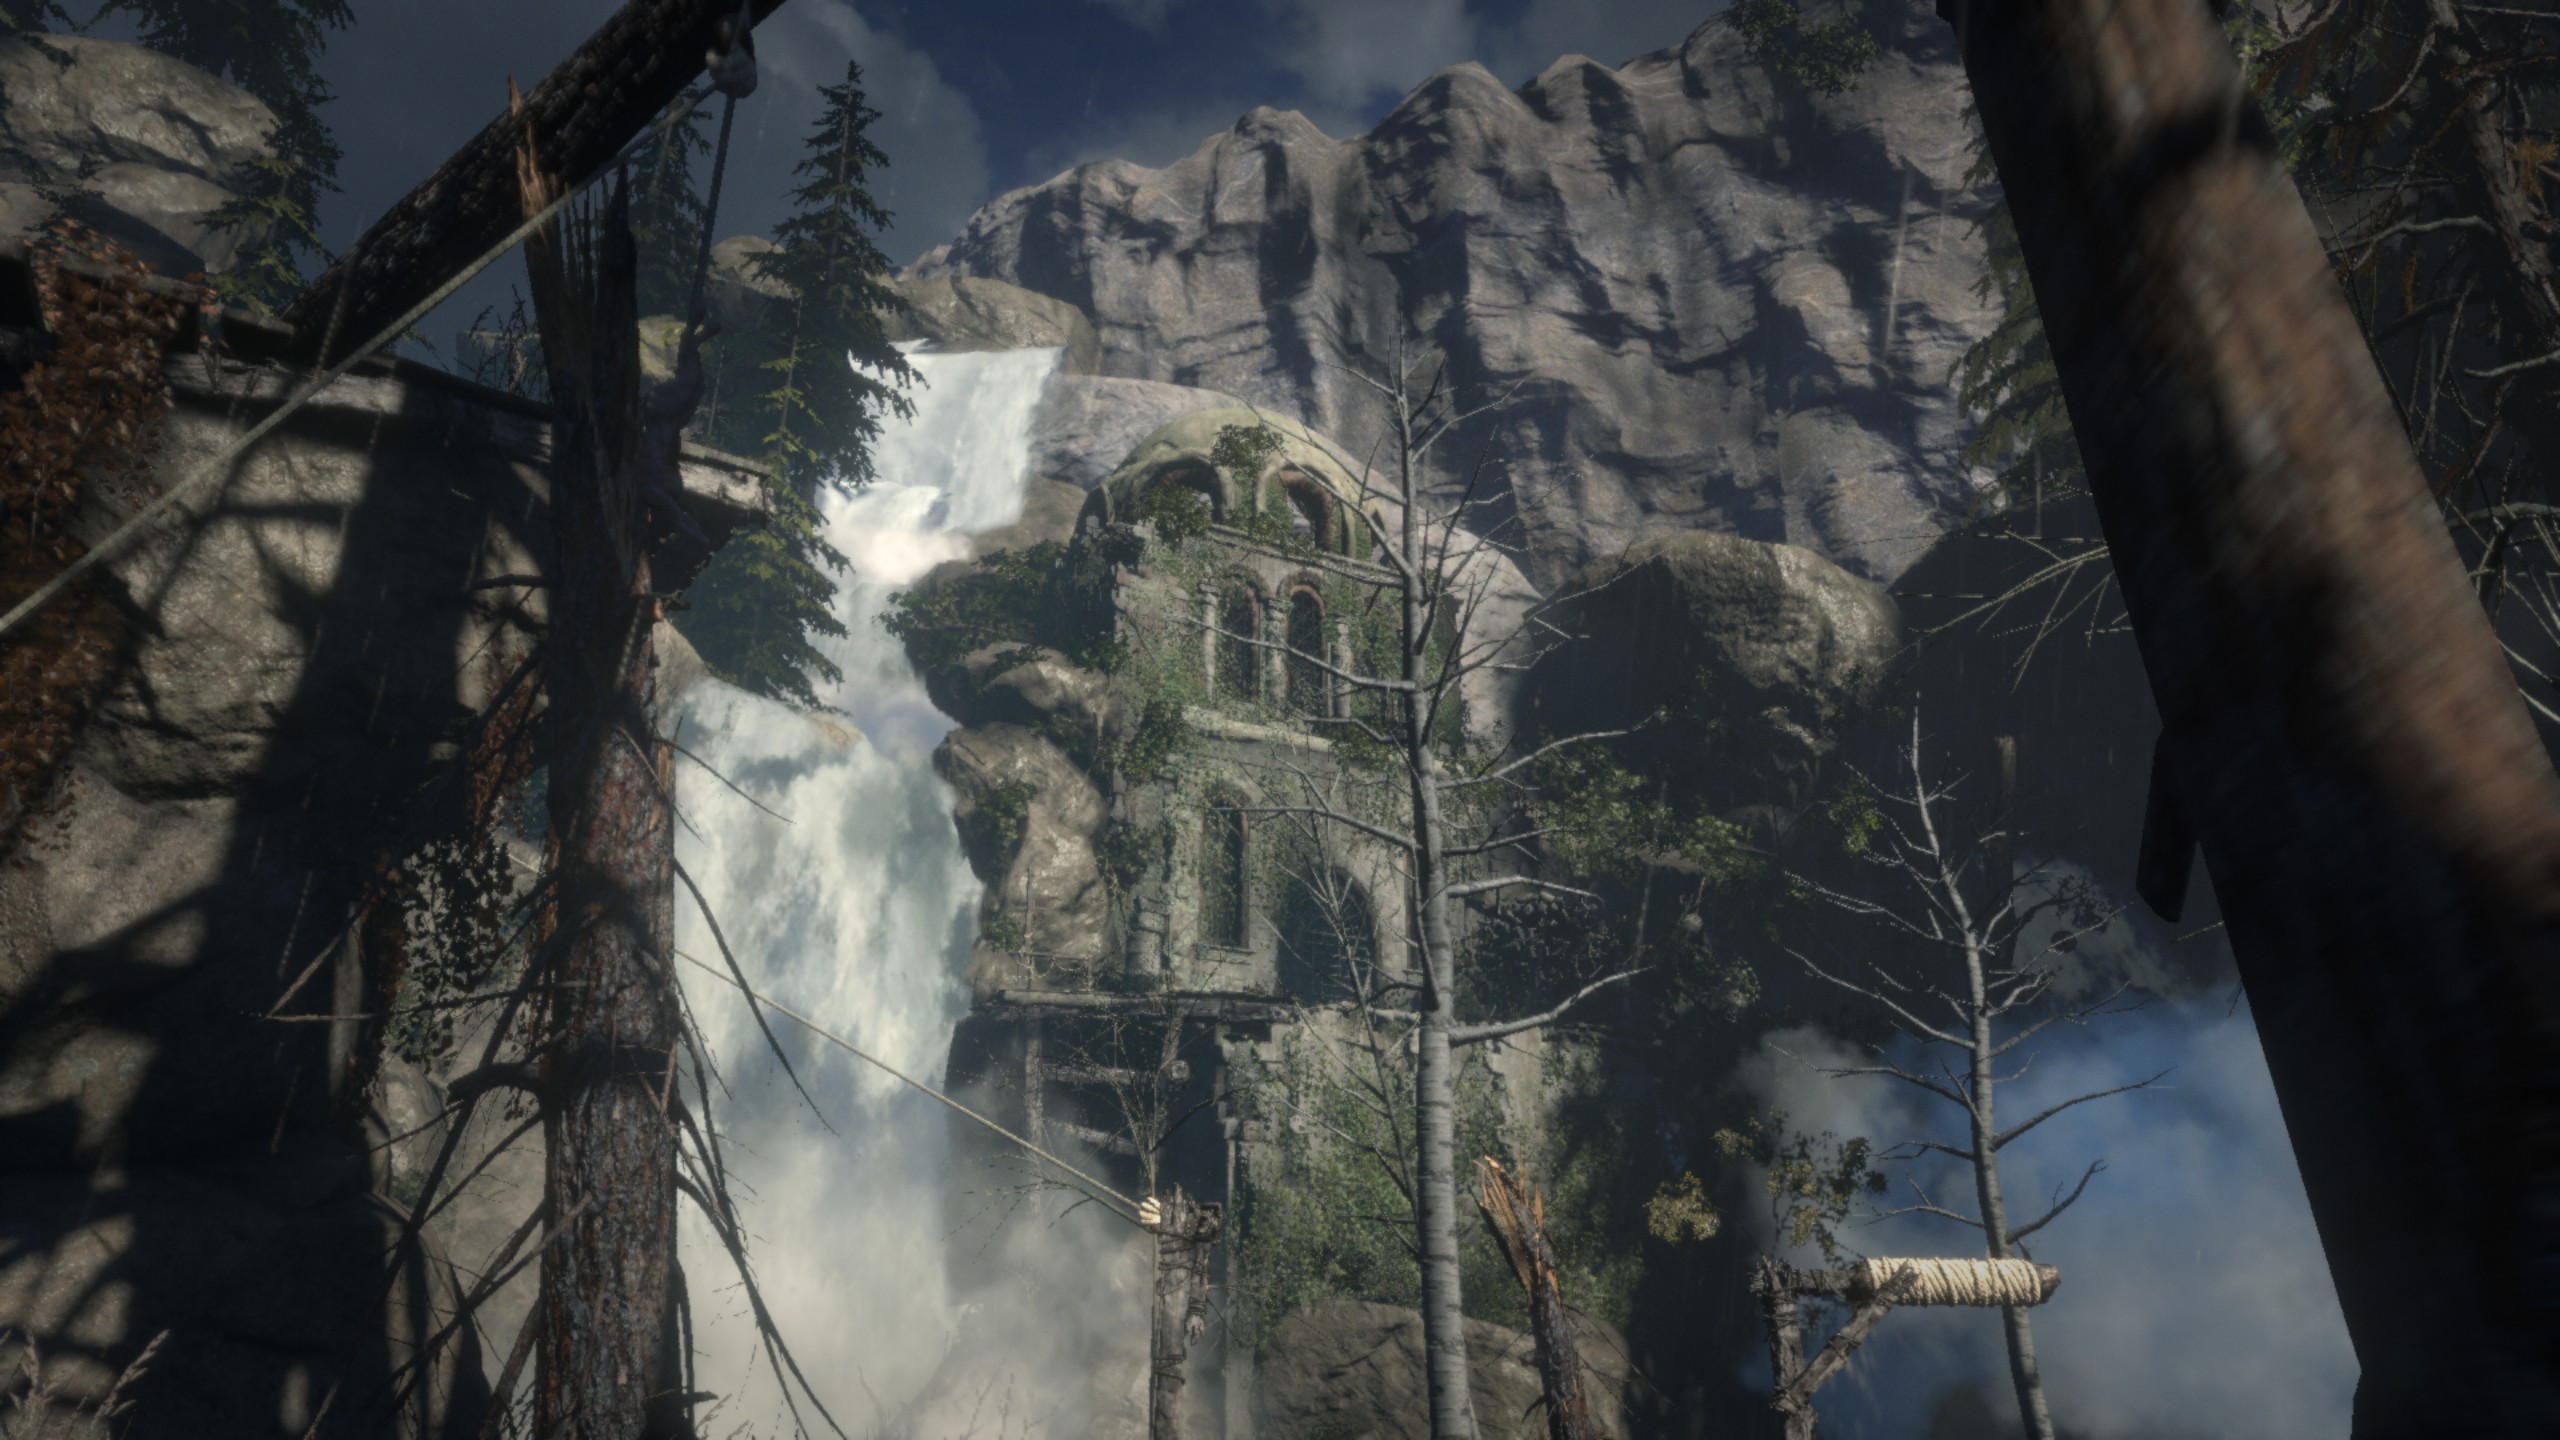
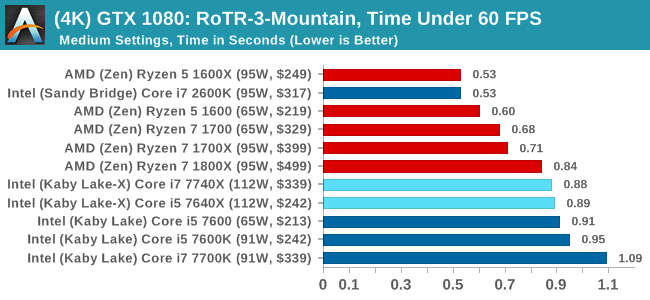
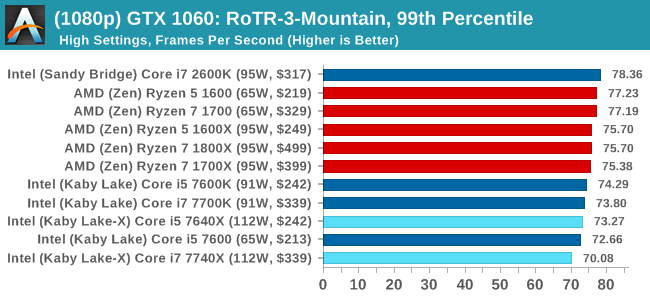
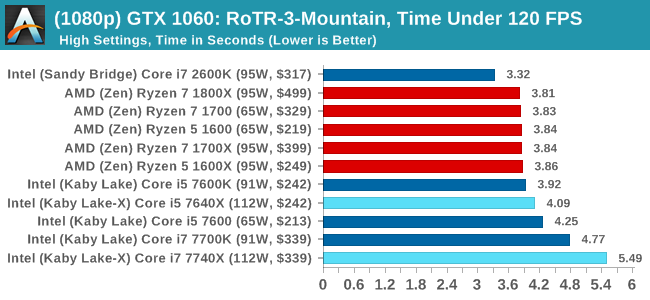
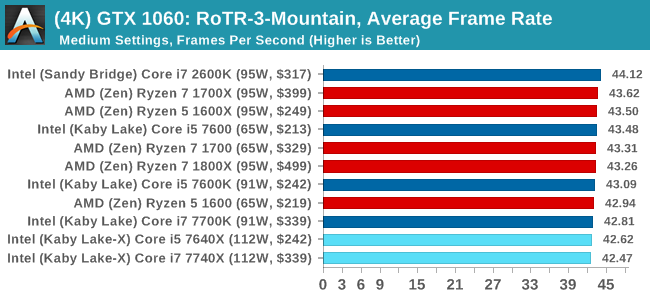
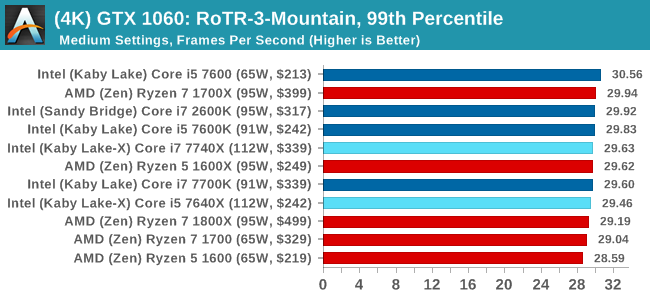
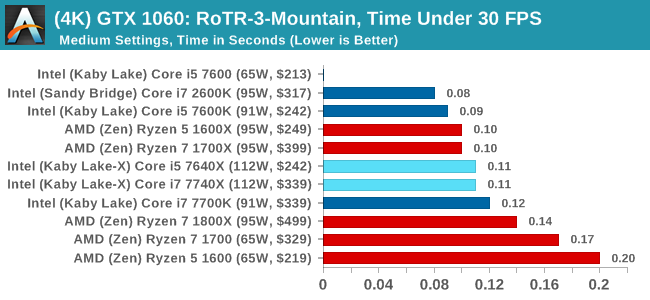
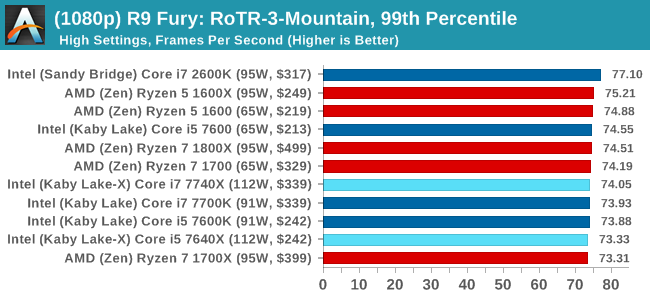
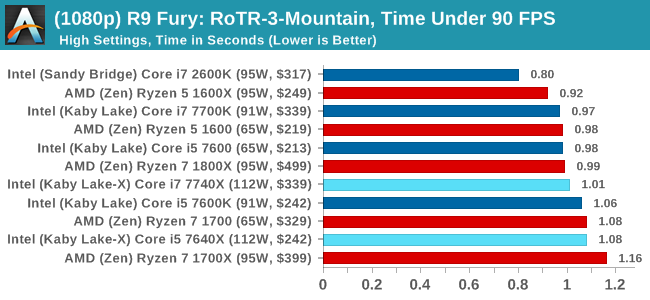
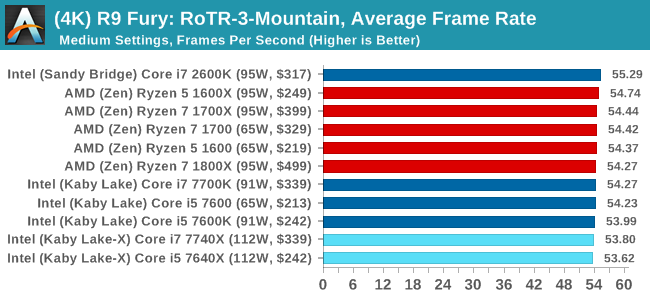
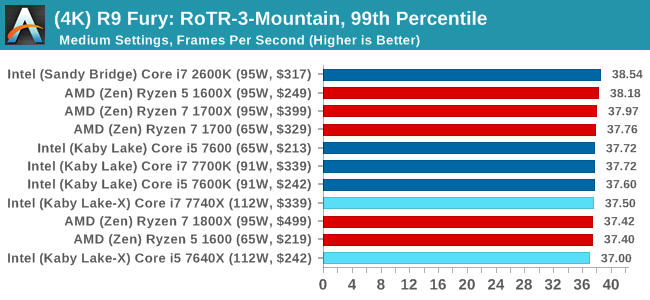
#3 Spine of the Mountain
MSI GTX 1080 Gaming 8G Performance
1080p
4K
ASUS GTX 1060 Strix 6GB Performance
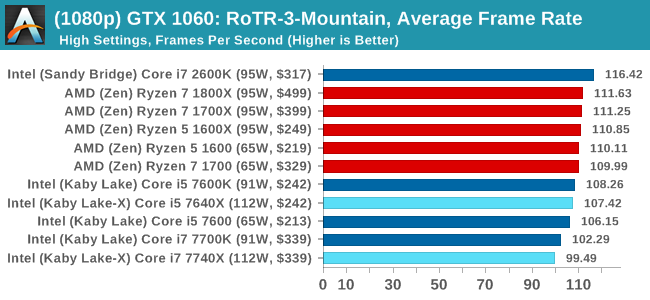
1080p
4K
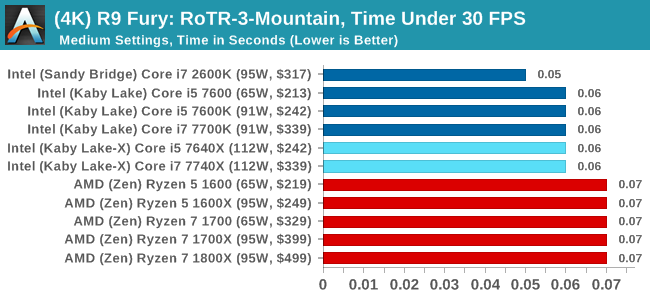
Sapphire R9 Fury 4GB Performance
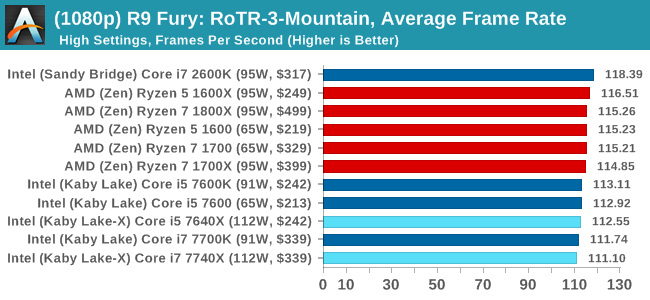
1080p
4K
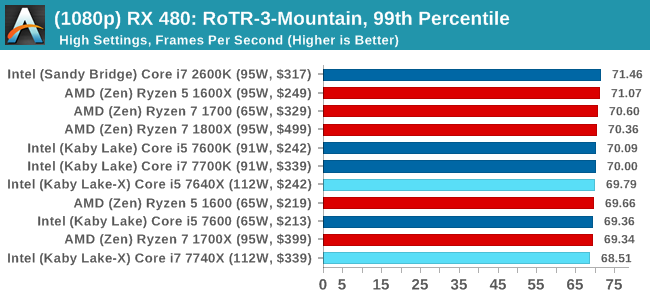
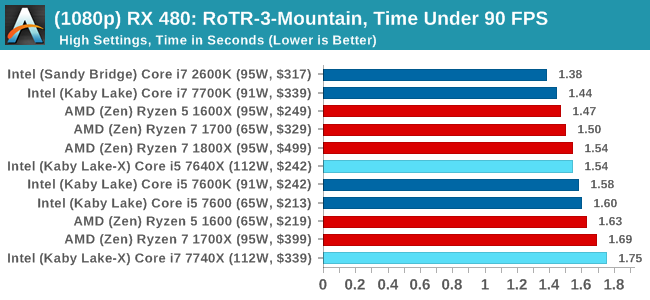
Sapphire RX 480 8GB Performance
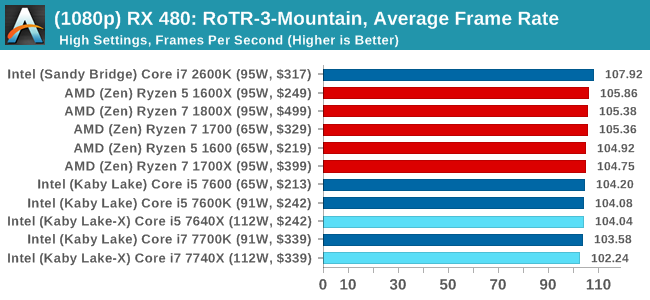
1080p
4K
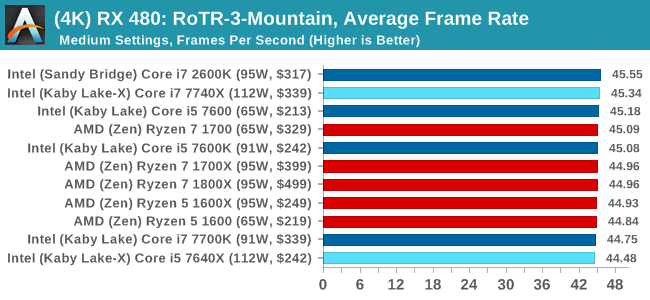
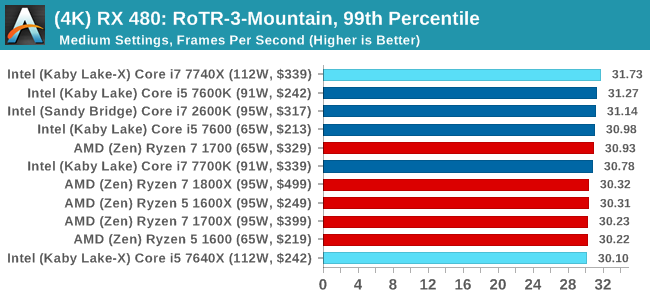
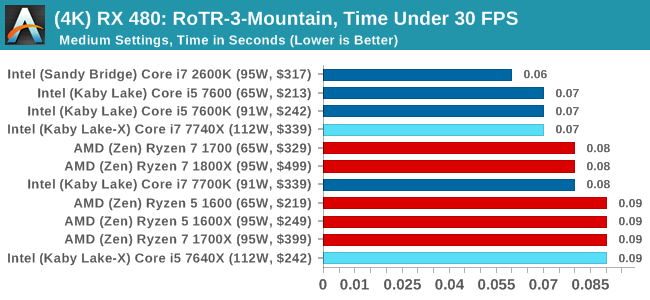
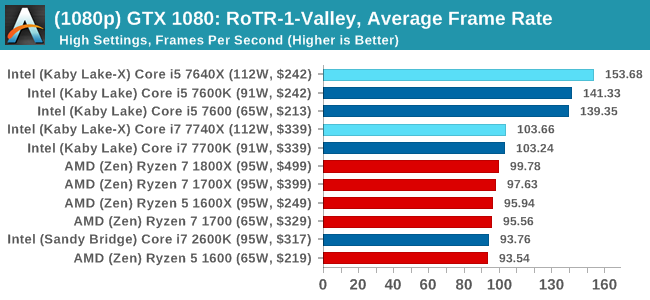
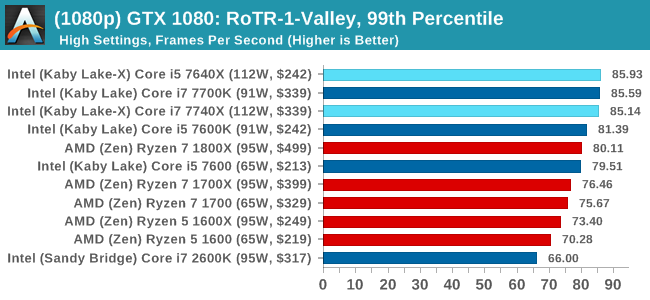
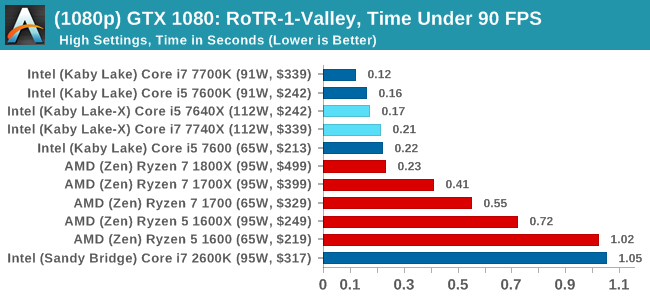
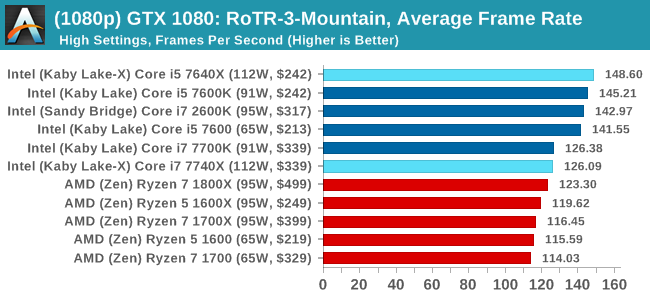
RoTR: Spine of the Mountain Conclusions
Core i5, we're assigning you to run at 1080p with a GTX 1080. That's an order. The rest of you, stand easy.


176 Comments
View All Comments
Santoval - Tuesday, July 25, 2017 - link
That is not how IPC works, since it explicitly refers to single core - single thread performance. As the number of cores rises the performance of a *single* task never scales linearly because there is always some single thread code involved (Amdahl's law). For example if your task has 90% parallel and 10% serial code its performance will max out at x10 that of a single core at ~512 cores. From then on even if you had a CPU with infinite cores you couldn't extract half an ounce of additional performance. If your code was 95% parallel the performance of your task would plateau at x20. For that though you would need ~2048 cores. And so on.Of course Amdahl's law does not provide a complete picture. It assumes, for example, that your task and its code will remain fixed no matter how many cores you add on them. And it disregards the possibility of computing distinct tasks in parallel on separate cores. That's where Gustafson's Law comes in. This "law" is not concerned with speeding up the performance of tasks but computing larger and more complex tasks at the same amount of time.
An example given in Wikipedia involves boot times : Amdahl's law states that you can speed up the boot process, assuming it can be made largely parallel, up to a certain number of cores. Beyond that -when you become limited by the serial code of your bootloader- adding more cores does not help. Gustafson's law, on the contrary, states that instead of speeding up the boot process by adding more cores and computing resources, you could add colorful GUIs, increase the resolution etc, while keeping the boot time largely the same. This idea could be applied to many -but not all- computing tasks, for example ray tracing (for more photorealistic renderings) and video encoding (for smaller files or videos with better quality), and many other heavily multi-threaded tasks.
Rickyxds - Monday, July 24, 2017 - link
I just agree XD.Diji1 - Wednesday, July 26, 2017 - link
"Overall speed increase 240%."LMAO. Ridiculous.
Alistair - Wednesday, July 26, 2017 - link
No reason to laugh. I compared the 6600k vs the Ryzen 1700. 1 year speed increase of 144 percent (2.44 times the speed). Same as this: 1135 vs 466 points.http://cpu.userbenchmark.com/Compare/Intel-Core-i5...
Dr. Swag - Tuesday, July 25, 2017 - link
I disagree, best value is 1600 as it oces as well as 1600x, comes with a decent stock cooler, and is cheaper.vext - Monday, July 24, 2017 - link
Interesting article but it seems intended to play down the extremely bad press x299 has received which is all over the internet and Youtube.Once you get past Mr. Cuttress' glowing review, it's clear that the I5-7640x is not worth the money because of lackluster performance, the I7-7740X is marginally faster than the older 7700k, and the I7-7800x is regularly beaten by the 7740X in many benchmarks that actually count and is a monstrously inefficient energy pig. Therefore the only Intel CPUs of this batch worth buying are the 7700k/7740x, and there is no real advantage to x299. In summary, it doesn't actually change anything.
It's very telling that Mr. Cutress doesn't comment on the absolutely egregious energy consumption of the 7800x. The Test Bed setup section doesn't list the 7800x at all. The 7840x and 7740x are using a Thermalright True Copper (great choice!) but no info on the 7800x cooler. Essentially, the 7800x cameo appearance is only to challenge the extremely strong Ryzen multi-threaded results, but its negative aspects are not discussed, perhaps because it might frighten people from x299. Tsk, tsk. As my 11 year old daughter would say "No Fair." By the way, the 7800x is selling for ~ $1060 right now on Newegg, not $389.
Proudly typed on my Ryzen 1800x/Gigabyte AB350 Gaming 3. # ;-)
Ian Cutress - Monday, July 24, 2017 - link
You may not have realised but this is the Kaby Lake-X review, so it focuses on the KBL-X parts. We already have a Skylake-X review for you to mull over. There are links on the first page.mapesdhs - Monday, July 24, 2017 - link
Nevertheless, the wider picture is relevant here. The X299 platform is a mess. Intel is aiming KL-X at a market which doesn't exist, they've locked out features that actually make it useful, it's more power hungry, and a consumer needs a lot of patience and plenty of coffee to work out what the heck works and what doesn't on a mbd with a KL-X fitted.This is *exactly* the sort of criticism of Intel which should have been much stronger in the tech journalism space when Intel started pulling these sorts of stunts back with the core-crippled 3930K, heat-crazy IB and PCIe-crippled 5820K. Instead, except for a few exceptions, the tech world has been way too forgiving of Intel's treading-on-water attitude ever since SB, and now they've panicked in response to Ryzen and released a total hodgebodge of a chipset and CPU lineup which makes no sense at all. And if you get any disagreement about what I've said by anyone at Intel, just wave a 4820K in their face and say well explain this then (quad-core chip with 40 PCIe lanes, da daa!).
I've been a big fan of Z68 and X79, but nothing about Intel's current lineup appeals in the slightest.
serendip - Tuesday, July 25, 2017 - link
There's also the funny bit about motherboards potentially killing KBL-X CPUs if a Skylake-X was used previously.What's with Intel's insane product segmentation strategy with all the crippling and inconsistent motherboard choices? It's like they want to make it hard to choose, so buyers either get the cheapest or most expensive chip.
Haawser - Tuesday, July 25, 2017 - link
'EmergencyLake-X' is just generally embarrassing. Intel should just find a nearby landfill site and quietly bury it.