The Intel Kaby Lake-X i7 7740X and i5 7640X Review: The New Single-Threaded Champion, OC to 5GHz
by Ian Cutress on July 24, 2017 8:30 AM EST- Posted in
- CPUs
- Intel
- Kaby Lake
- X299
- Basin Falls
- Kaby Lake-X
- i7-7740X
- i5-7640X
Benchmarking Performance: CPU Office Tests
The office programs we use for benchmarking aren't specific programs per-se, but industry standard tests that hold weight with professionals. The goal of these tests is to use an array of software and techniques that a typical office user might encounter, such as video conferencing, document editing, architectural modeling, and so on and so forth.
All of our benchmark results can also be found in our benchmark engine, Bench.
Chromium Compile (v56)
Our new compilation test uses Windows 10 Pro, VS Community 2015.3 with the Win10 SDK to compile a nightly build of Chromium. We've fixed the test for a build in late March 2017, and we run a fresh full compile in our test. Compilation is the typical example given of a variable threaded workload - some of the compile and linking is linear, whereas other parts are multithreaded.
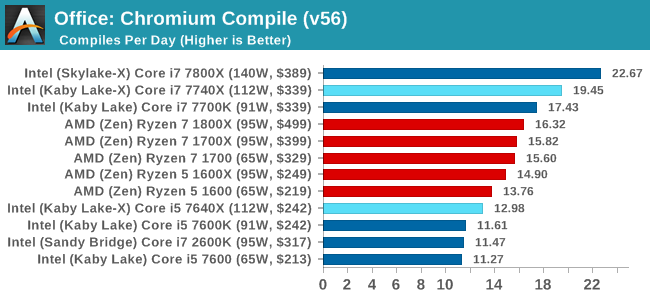
Our Chrome Compile test is a mix of load, but also loves L3 cache. We've seen before that the L3 victim cache on AMD can be a defecit here, but even then the Core i5 cannot overcome the 3:1 thread deficit to the Ryzen 5 CPUs. The Core i7-7740X hits the nail on the head for threads and single thread performance, although users that play in this space would look straight to the Core i7-7800X, and likely decide that +16.5% better performance is worth the +18.2% extra cost.
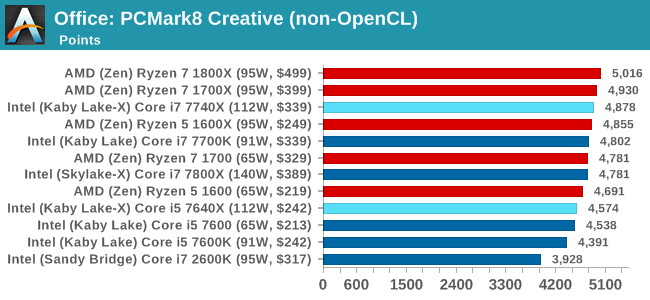
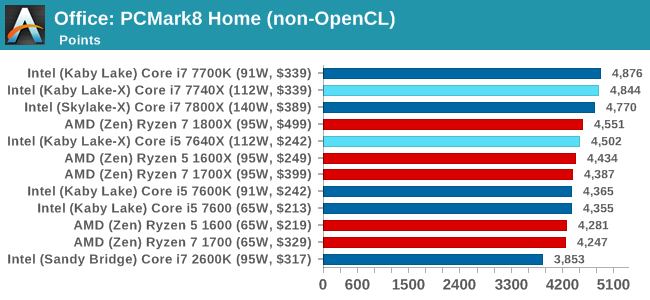
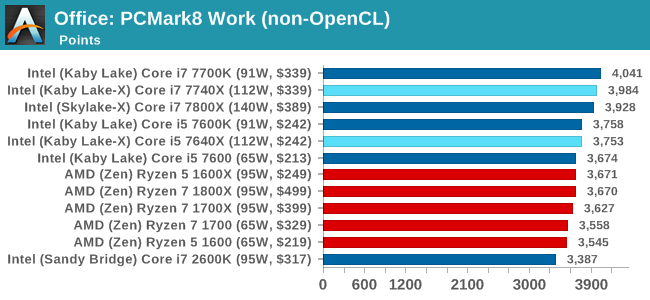
PCMark8: link
Despite originally coming out in 2008/2009, Futuremark has maintained PCMark8 to remain relevant in 2017. On the scale of complicated tasks, PCMark focuses more on the low-to-mid range of professional workloads, making it a good indicator for what people consider 'office' work. We run the benchmark from the commandline in 'conventional' mode, meaning C++ over OpenCL, to remove the graphics card from the equation and focus purely on the CPU. PCMark8 offers Home, Work and Creative workloads, with some software tests shared and others unique to each benchmark set.
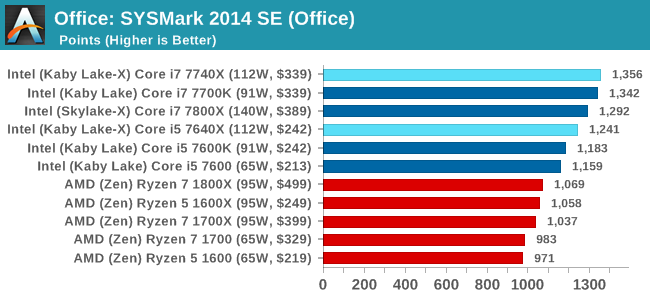
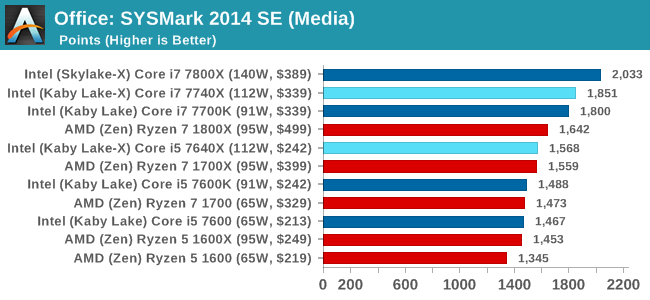
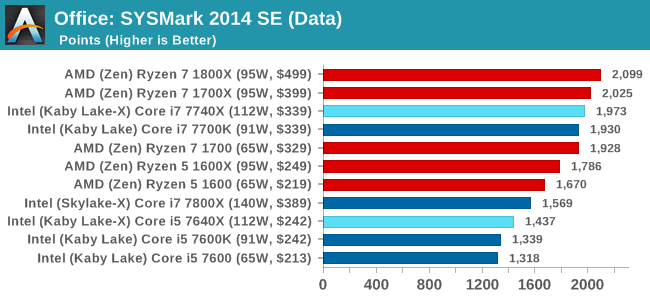
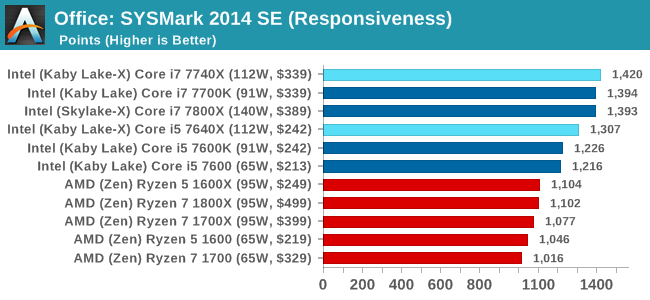
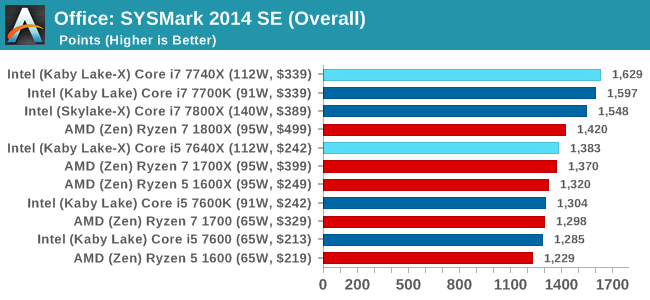
SYSmark 2014 SE: link
SYSmark is developed by Bapco, a consortium of industry CPU companies. The goal of SYSmark is to take stripped down versions of popular software, such as Photoshop and Onenote, and measure how long it takes to process certain tasks within that software. The end result is a score for each of the three segments (Office, Media, Data) as well as an overall score. Here a reference system (Core i3-6100, 4GB DDR3, 256GB SSD, Integrated HD 530 graphics) is used to provide a baseline score of 1000 in each test.
A note on context for these numbers. AMD left Bapco in the last two years, due to differences of opinion on how the benchmarking suites were chosen and AMD believed the tests are angled towards Intel processors and had optimizations to show bigger differences than what AMD felt was present. The following benchmarks are provided as data, but the conflict of opinion between the two companies on the validity of the benchmark is provided as context for the following numbers.


176 Comments
View All Comments
Gulagula - Wednesday, July 26, 2017 - link
Can anyone explain to me how the 7600k and in some cases the 7600 beating the 7700k almost consistenly. I don't doubt the Ryzen results but the Intel side of results confuses the heck out of me.PeterSun - Wednesday, July 26, 2017 - link
7800x is missing in LuxMark CPU OpenCL benchmark?kgh00007 - Thursday, July 27, 2017 - link
Hi, thanks for the great review. Are you guys still using OCCT to check your overclock stability?If so what version do you use and which test do you guys use? Is it the CPU OCCT or the CPU Linpack with AVX and for how long before you consider it stable?
Thanks, I'm trying to work on my own 7700k overclock at the minute!
fattslice - Thursday, July 27, 2017 - link
I hate to say, but there is clearly something very wrong with your 7700K test system. Using the same settings for Tomb Raider, a GTX 1080 11Gbps, and a 7700k set at stock settings I am seeing about 40-50% better fps than you are getting on all three benchmarks--213 avg for Mountain Peak, 163 for Syria, and 166 for Geothermal Valley. This likely is not limited to just RotTR, as your other games have impossible results--technically the i5s cannot beat their respective i7s as they are slower and have less cache. How this was not caught is quite disturbing.welbot - Tuesday, August 1, 2017 - link
The test was run with a 1080, not a 1080ti. Depending on resolution, ti's can outperform the 1080 by 30%+. Could well be why you see such a big difference.Funyim - Thursday, August 10, 2017 - link
No. I'm pretty sure the 7700k used was broken. It worries me as well this was posted without further investigation. Basically invalidates all benchmarks.