The Intel Kaby Lake-X i7 7740X and i5 7640X Review: The New Single-Threaded Champion, OC to 5GHz
by Ian Cutress on July 24, 2017 8:30 AM EST- Posted in
- CPUs
- Intel
- Kaby Lake
- X299
- Basin Falls
- Kaby Lake-X
- i7-7740X
- i5-7640X
Benchmarking Performance: CPU Rendering Tests
Rendering tests are a long-time favorite of reviewers and benchmarkers, as the code used by rendering packages is usually highly optimized to squeeze every little bit of performance out. Sometimes rendering programs end up being heavily memory dependent as well - when you have that many threads flying about with a ton of data, having low latency memory can be key to everything. Here we take a few of the usual rendering packages under Windows 10, as well as a few new interesting benchmarks.
All of our benchmark results can also be found in our benchmark engine, Bench.
Corona 1.3: link
Corona is a standalone package designed to assist software like 3ds Max and Maya with photorealism via ray tracing. It's simple - shoot rays, get pixels. OK, it's more complicated than that, but the benchmark renders a fixed scene six times and offers results in terms of time and rays per second. The official benchmark tables list user submitted results in terms of time, however I feel rays per second is a better metric (in general, scores where higher is better seem to be easier to explain anyway). Corona likes to pile on the threads, so the results end up being very staggered based on thread count.
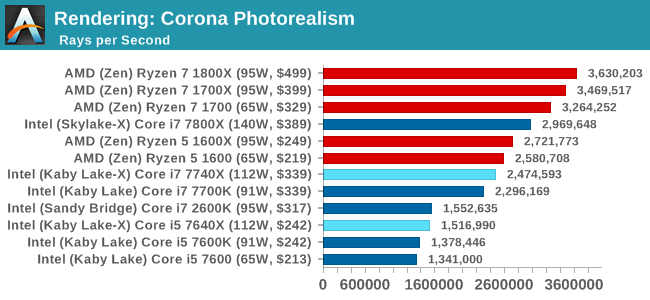
More threads win the day, although the Core i7 does knock at the door of the Ryzen 5 (presumably with $110 in hand as well). It is worth noting that the Core i5-7640X and the older Core i7-2600K are on equal terms.
Blender 2.78: link
For a render that has been around for what seems like ages, Blender is still a highly popular tool. We managed to wrap up a standard workload into the February 5 nightly build of Blender and measure the time it takes to render the first frame of the scene. Being one of the bigger open source tools out there, it means both AMD and Intel work actively to help improve the codebase, for better or for worse on their own/each other's microarchitecture.
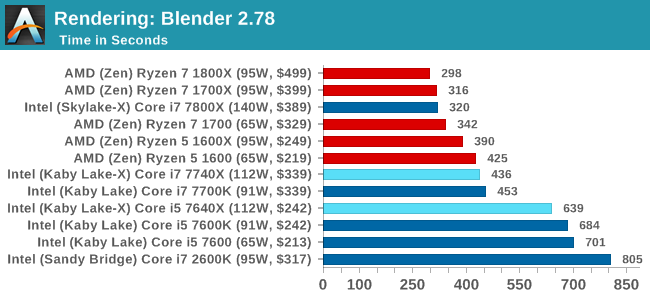
Similar to Corona, more threads means a faster time.
LuxMark v3.1: Link
As a synthetic, LuxMark might come across as somewhat arbitrary as a renderer, given that it's mainly used to test GPUs, but it does offer both an OpenCL and a standard C++ mode. In this instance, aside from seeing the comparison in each coding mode for cores and IPC, we also get to see the difference in performance moving from a C++ based code-stack to an OpenCL one with a CPU as the main host.
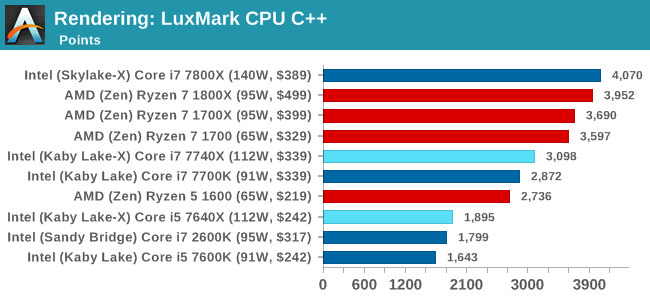
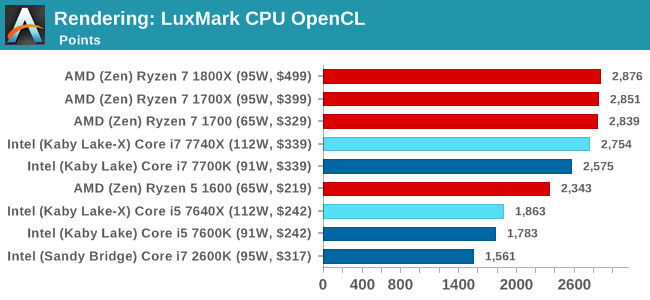
Luxmark is more thread and cache dependent, and so the Core i7 nips at the heels of the AMD parts with double the threads. The Core i5 sits behind the the Ryzen 5 parts though, due to the 1:3 thread difference.
POV-Ray 3.7.1b4: link
Another regular benchmark in most suites, POV-Ray is another ray-tracer but has been around for many years. It just so happens that during the run up to AMD's Ryzen launch, the code base started to get active again with developers making changes to the code and pushing out updates. Our version and benchmarking started just before that was happening, but given time we will see where the POV-Ray code ends up and adjust in due course.
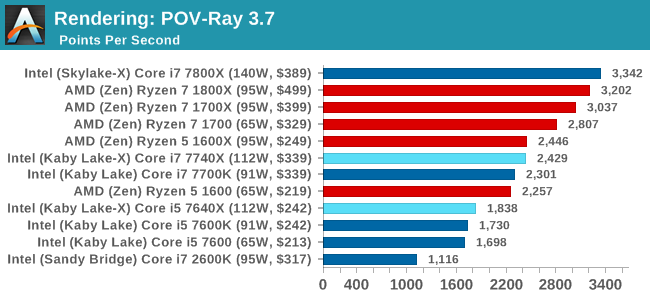
Mirror Mirror on the wall...
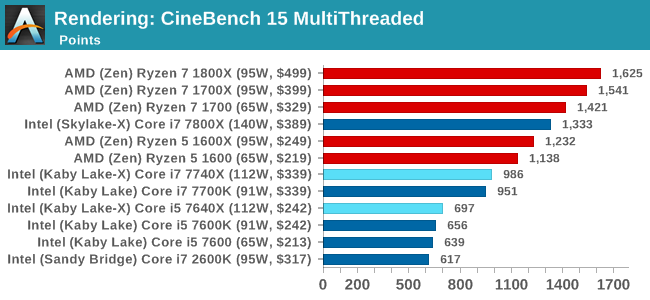
Cinebench R15: link
The latest version of CineBench has also become one of those 'used everywhere' benchmarks, particularly as an indicator of single thread performance. High IPC and high frequency gives performance in ST, whereas having good scaling and many cores is where the MT test wins out.
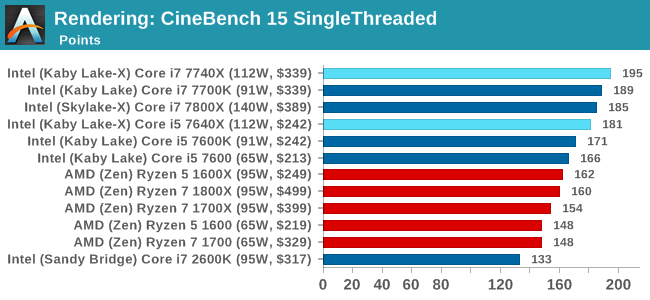
CineBench gives us singlethreaded numbers, and it is clear who rules the roost, almost scoring 200. The Core i7-2600K, due to its lack of instruction support, sits in the corner.


176 Comments
View All Comments
Gulagula - Wednesday, July 26, 2017 - link
Can anyone explain to me how the 7600k and in some cases the 7600 beating the 7700k almost consistenly. I don't doubt the Ryzen results but the Intel side of results confuses the heck out of me.PeterSun - Wednesday, July 26, 2017 - link
7800x is missing in LuxMark CPU OpenCL benchmark?kgh00007 - Thursday, July 27, 2017 - link
Hi, thanks for the great review. Are you guys still using OCCT to check your overclock stability?If so what version do you use and which test do you guys use? Is it the CPU OCCT or the CPU Linpack with AVX and for how long before you consider it stable?
Thanks, I'm trying to work on my own 7700k overclock at the minute!
fattslice - Thursday, July 27, 2017 - link
I hate to say, but there is clearly something very wrong with your 7700K test system. Using the same settings for Tomb Raider, a GTX 1080 11Gbps, and a 7700k set at stock settings I am seeing about 40-50% better fps than you are getting on all three benchmarks--213 avg for Mountain Peak, 163 for Syria, and 166 for Geothermal Valley. This likely is not limited to just RotTR, as your other games have impossible results--technically the i5s cannot beat their respective i7s as they are slower and have less cache. How this was not caught is quite disturbing.welbot - Tuesday, August 1, 2017 - link
The test was run with a 1080, not a 1080ti. Depending on resolution, ti's can outperform the 1080 by 30%+. Could well be why you see such a big difference.Funyim - Thursday, August 10, 2017 - link
No. I'm pretty sure the 7700k used was broken. It worries me as well this was posted without further investigation. Basically invalidates all benchmarks.