The Intel Kaby Lake-X i7 7740X and i5 7640X Review: The New Single-Threaded Champion, OC to 5GHz
by Ian Cutress on July 24, 2017 8:30 AM EST- Posted in
- CPUs
- Intel
- Kaby Lake
- X299
- Basin Falls
- Kaby Lake-X
- i7-7740X
- i5-7640X
Ashes of the Singularity: Escalation
Seen as the holy child of DirectX12, Ashes of the Singularity (AoTS, or just Ashes) has been the first title to actively go explore as many of DirectX12s features as it possibly can. Stardock, the developer behind the Nitrous engine which powers the game, has ensured that the real-time strategy title takes advantage of multiple cores and multiple graphics cards, in as many configurations as possible.
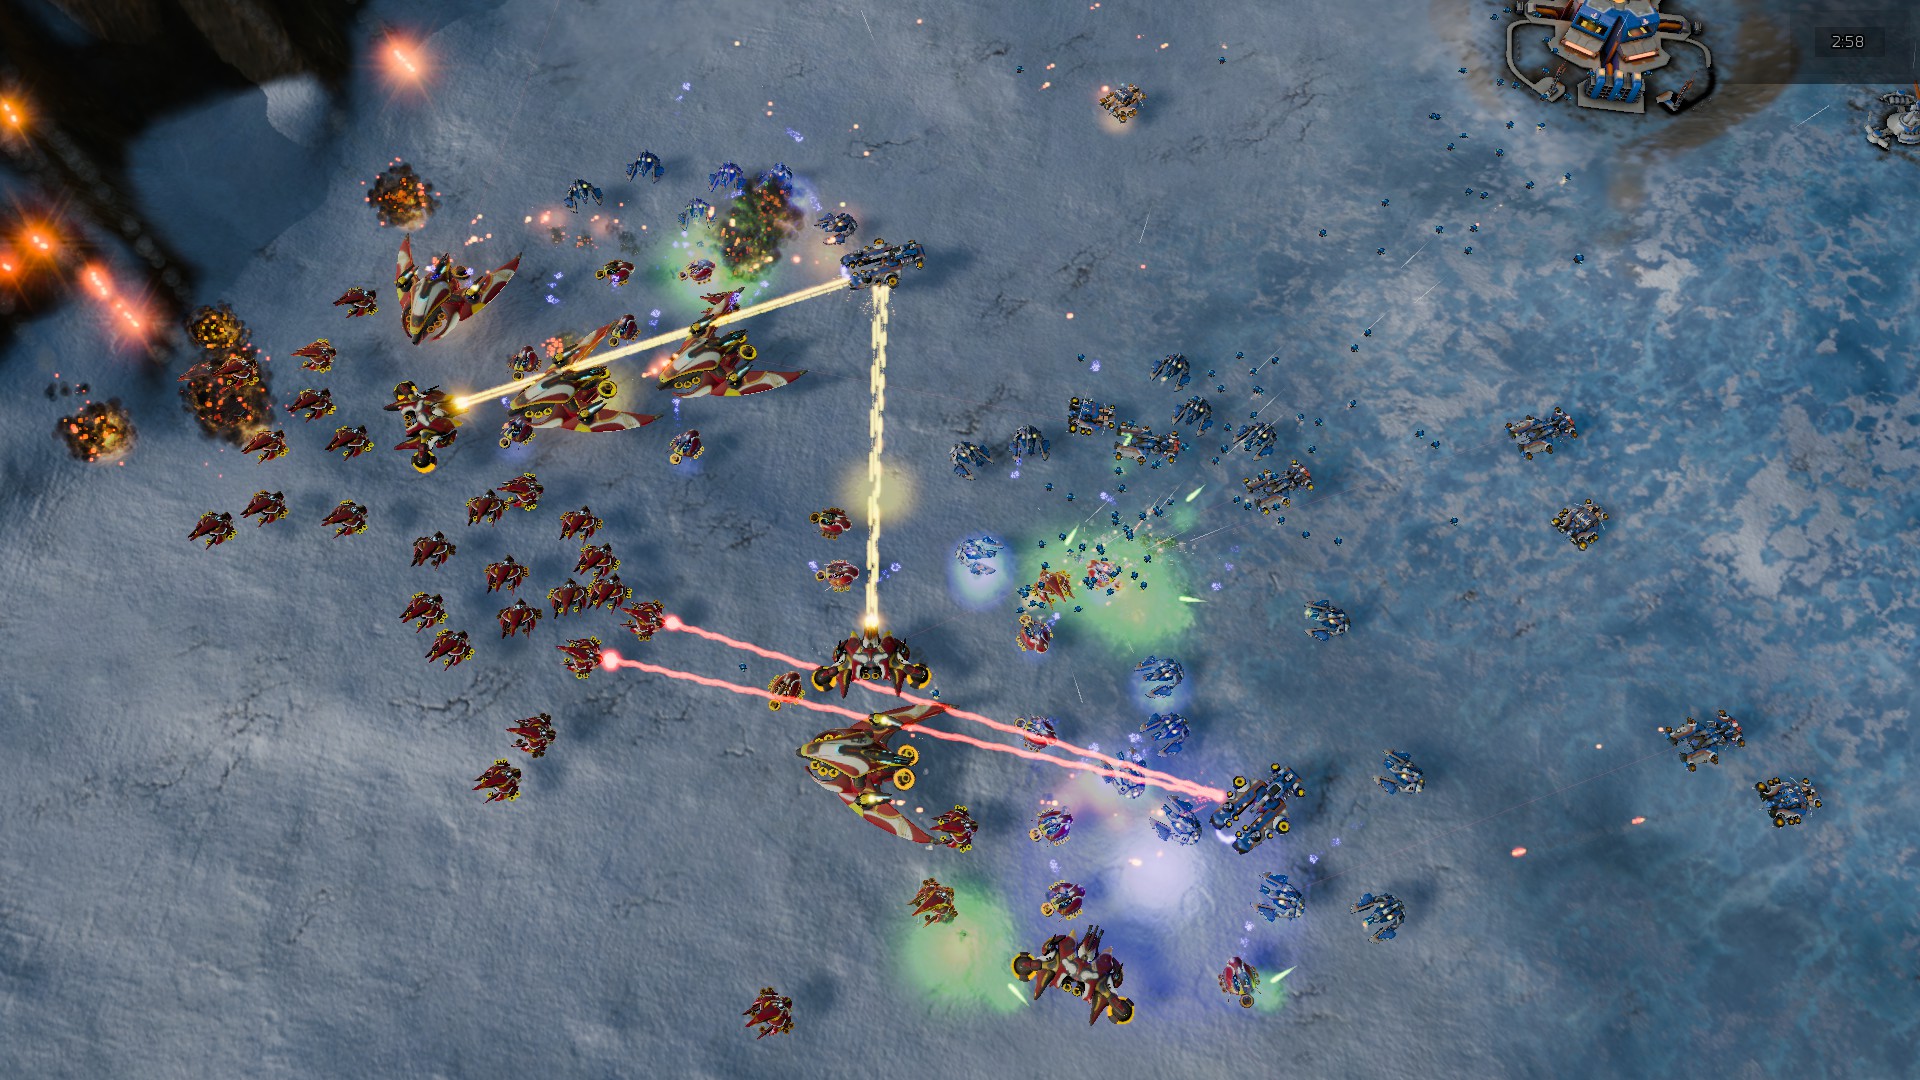
As a real-time strategy title, Ashes is all about responsiveness during both wide open shots but also concentrated battles. With DirectX12 at the helm, the ability to implement more draw calls per second allows the engine to work with substantial unit depth and effects that other RTS titles had to rely on combined draw calls to achieve, making some combined unit structures ultimately very rigid.
Stardock clearly understand the importance of an in-game benchmark, ensuring that such a tool was available and capable from day one, especially with all the additional DX12 features used and being able to characterize how they affected the title for the developer was important. The in-game benchmark performs a four minute fixed seed battle environment with a variety of shots, and outputs a vast amount of data to analyze.
For our benchmark, we run a fixed v2.11 version of the game due to some peculiarities of the splash screen added after the merger with the standalone Escalation expansion, and have an automated tool to call the benchmark on the command line. (Prior to v2.11, the benchmark also supported 8K/16K testing, however v2.11 has odd behavior which nukes this.)
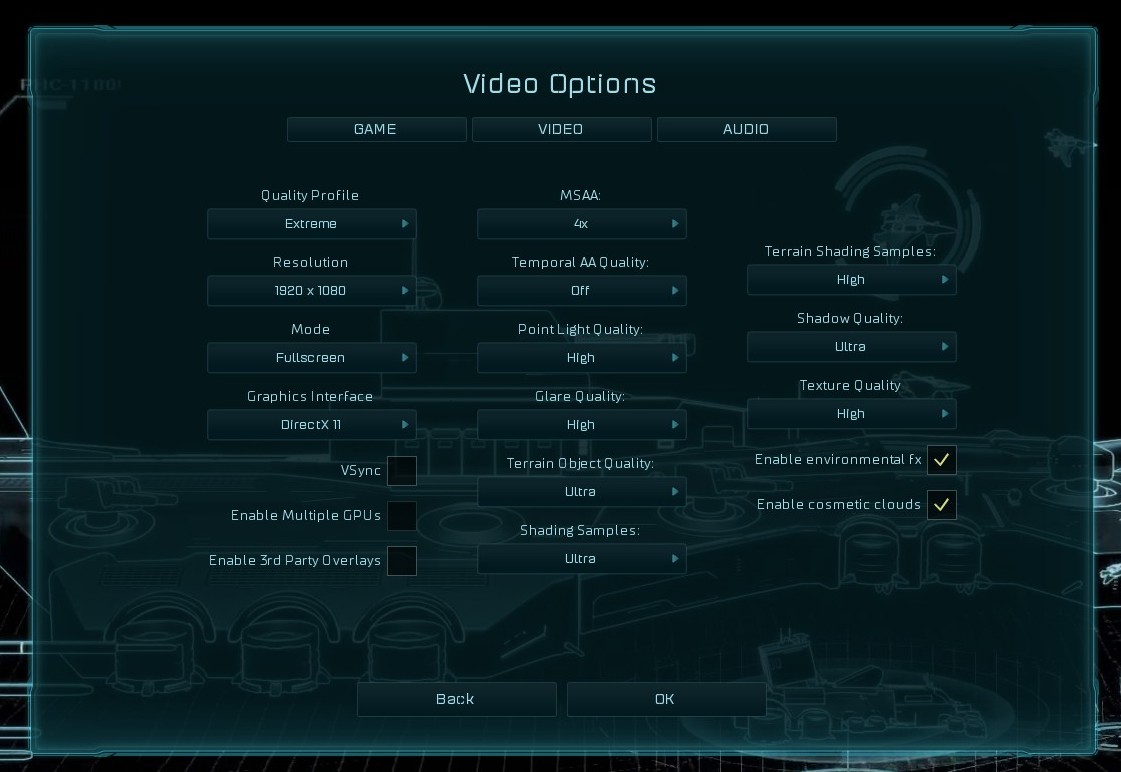
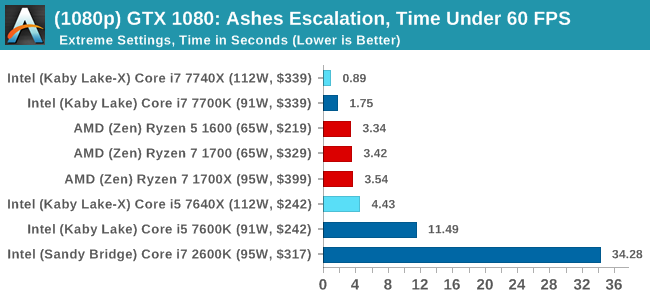
At both 1920x1080 and 4K resolutions, we run the same settings. Ashes has dropdown options for MSAA, Light Quality, Object Quality, Shading Samples, Shadow Quality, Textures, and separate options for the terrain. There are several presents, from Very Low to Extreme: we run our benchmarks at Extreme settings, and take the frame-time output for our average, percentile, and time under analysis.
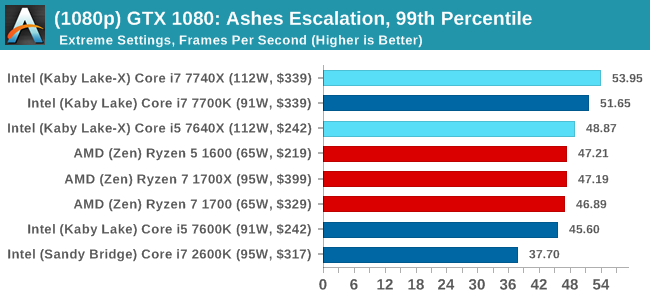
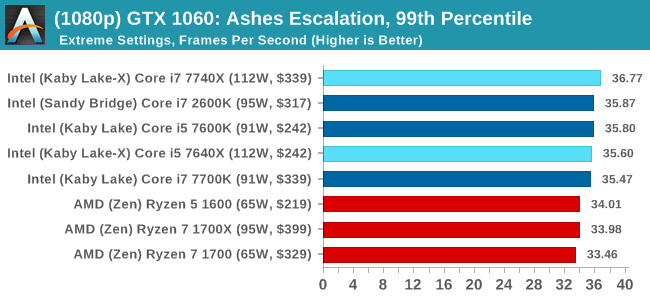
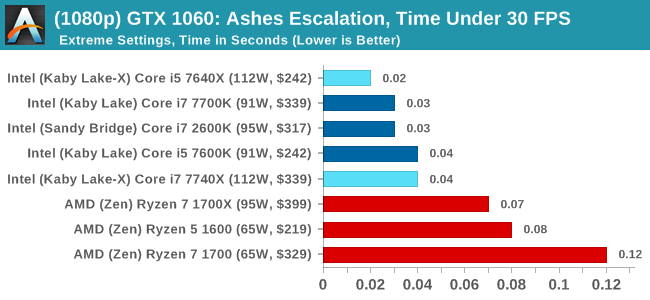
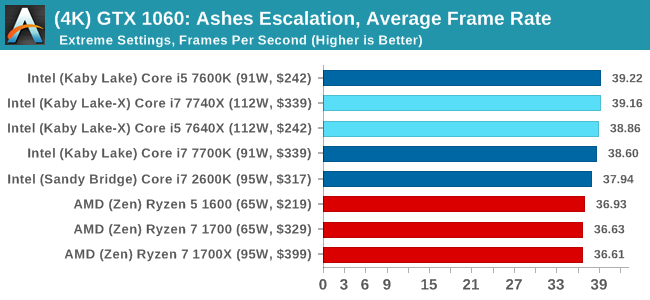
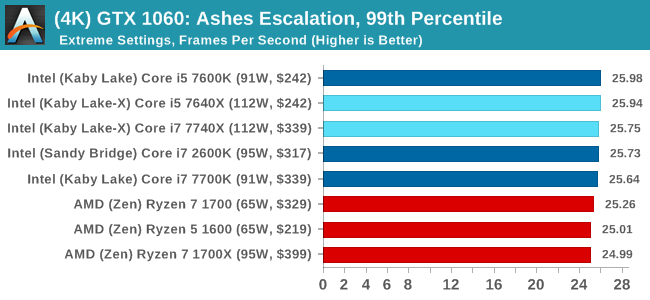
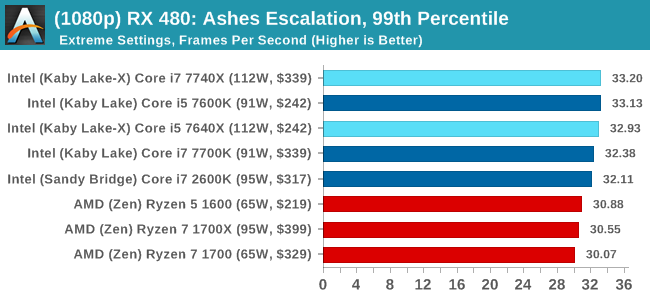
For all our results, we show the average frame rate at 1080p first. Mouse over the other graphs underneath to see 99th percentile frame rates and 'Time Under' graphs, as well as results for other resolutions. All of our benchmark results can also be found in our benchmark engine, Bench.
MSI GTX 1080 Gaming 8G Performance
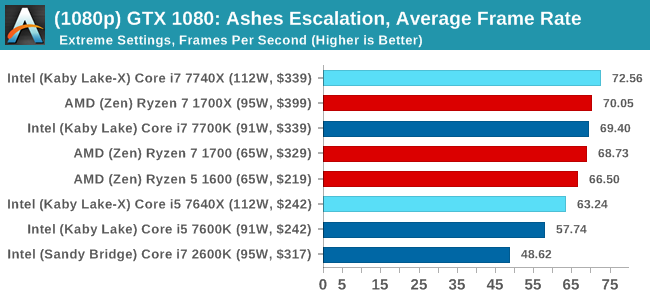
1080p
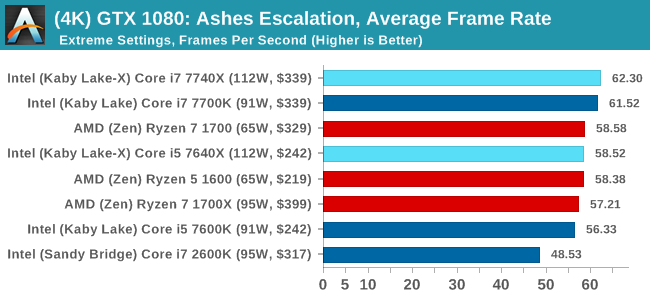
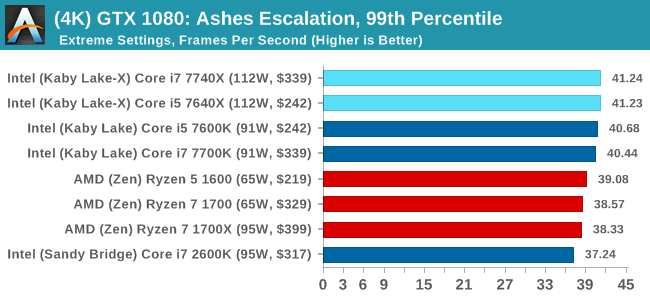
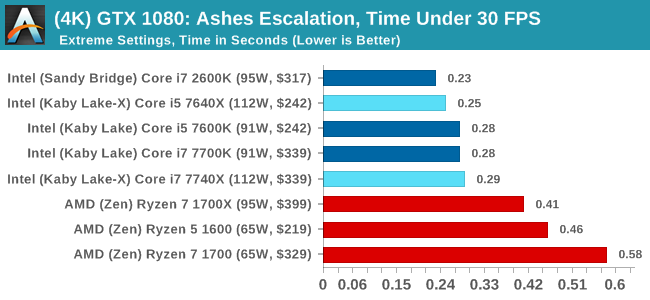
4K
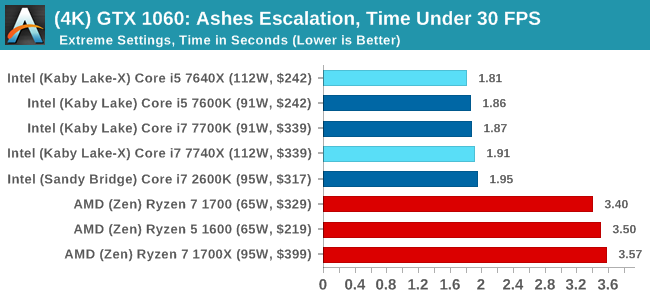
ASUS GTX 1060 Strix 6GB Performance

1080p
4K
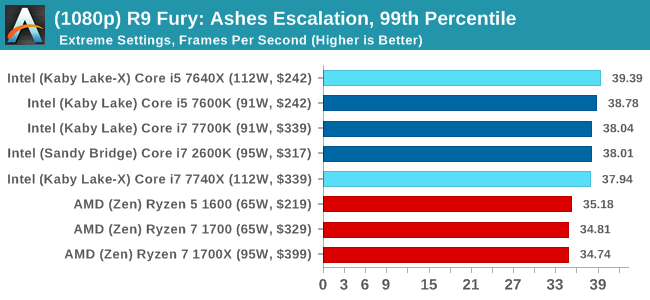
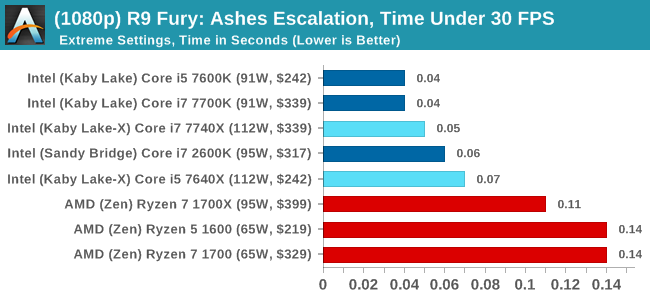
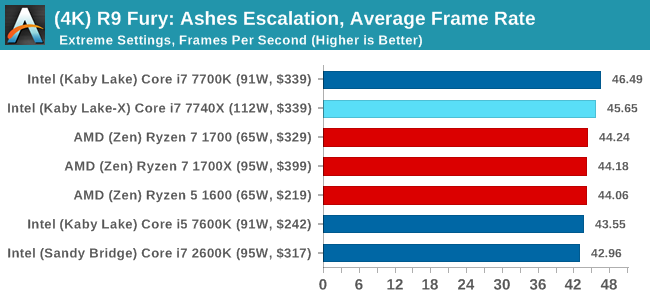
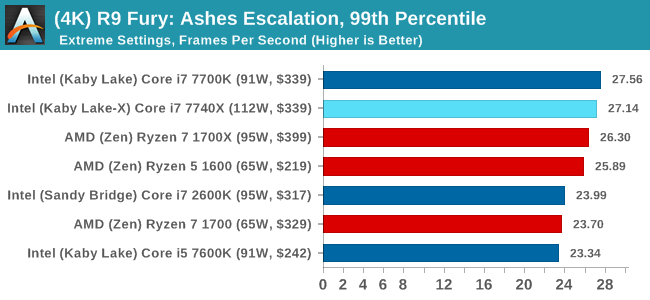
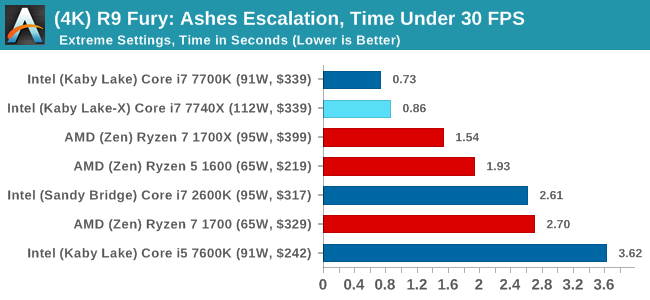
Sapphire R9 Fury 4GB Performance
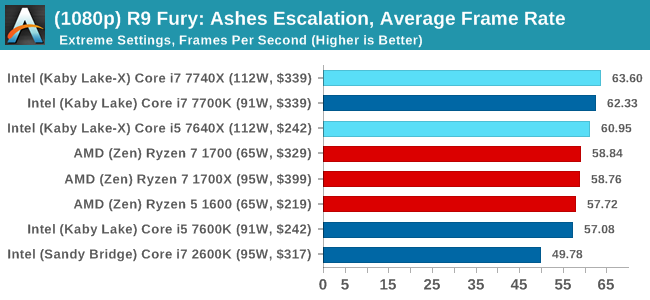
1080p
4K
Sapphire RX 480 8GB Performance
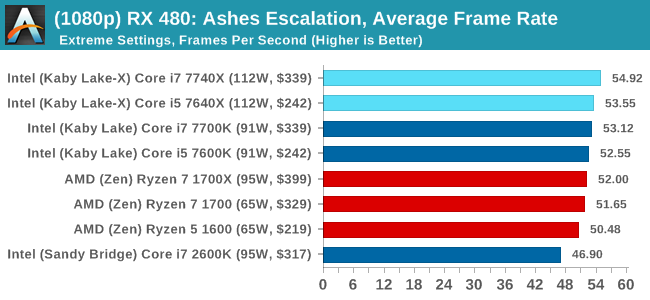
1080p
4K
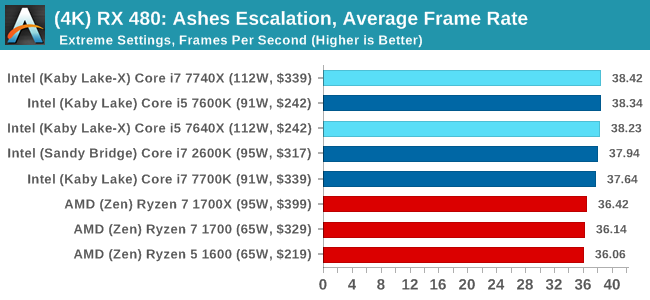
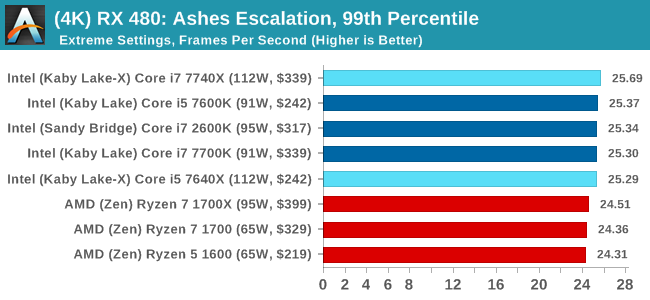
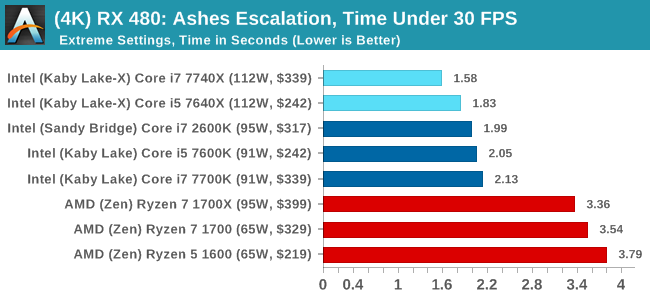
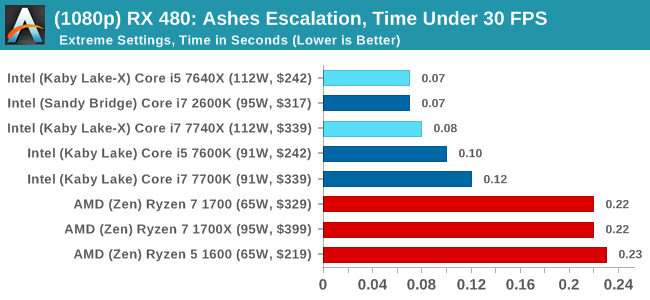
Ashes Conclusion
Pretty much across the board, no matter the GPU or the resolution, Intel gets the win here. This is most noticable in the time under analysis, although AMD seems to do better when the faster cards are running at the lower resolution. That's nothing to brag about though.


176 Comments
View All Comments
Gulagula - Wednesday, July 26, 2017 - link
Can anyone explain to me how the 7600k and in some cases the 7600 beating the 7700k almost consistenly. I don't doubt the Ryzen results but the Intel side of results confuses the heck out of me.PeterSun - Wednesday, July 26, 2017 - link
7800x is missing in LuxMark CPU OpenCL benchmark?kgh00007 - Thursday, July 27, 2017 - link
Hi, thanks for the great review. Are you guys still using OCCT to check your overclock stability?If so what version do you use and which test do you guys use? Is it the CPU OCCT or the CPU Linpack with AVX and for how long before you consider it stable?
Thanks, I'm trying to work on my own 7700k overclock at the minute!
fattslice - Thursday, July 27, 2017 - link
I hate to say, but there is clearly something very wrong with your 7700K test system. Using the same settings for Tomb Raider, a GTX 1080 11Gbps, and a 7700k set at stock settings I am seeing about 40-50% better fps than you are getting on all three benchmarks--213 avg for Mountain Peak, 163 for Syria, and 166 for Geothermal Valley. This likely is not limited to just RotTR, as your other games have impossible results--technically the i5s cannot beat their respective i7s as they are slower and have less cache. How this was not caught is quite disturbing.welbot - Tuesday, August 1, 2017 - link
The test was run with a 1080, not a 1080ti. Depending on resolution, ti's can outperform the 1080 by 30%+. Could well be why you see such a big difference.Funyim - Thursday, August 10, 2017 - link
No. I'm pretty sure the 7700k used was broken. It worries me as well this was posted without further investigation. Basically invalidates all benchmarks.