ECS LIVA Z Plus Kaby Lake vPro UCFF PC Review
by Ganesh T S on April 12, 2017 8:00 AM ESTPerformance Metrics - I
The ECS LIVA Z Plus was evaluated using our standard test suite for low power desktops / industrial PCs. Not all benchmarks were processed on all the machines due to updates in our testing procedures. Therefore, the list of PCs in each graph might not be the same. In the first section, we will be looking at SYSmark 2014 SE, as well as some of the Futuremark benchmarks.
BAPCo SYSmark 2014 SE
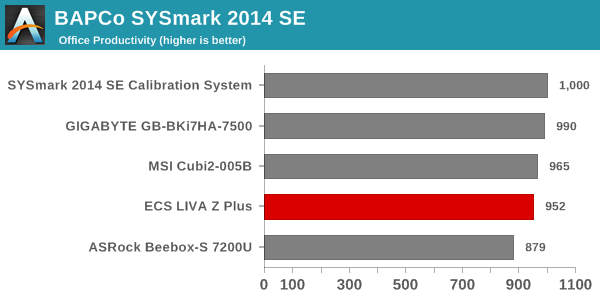
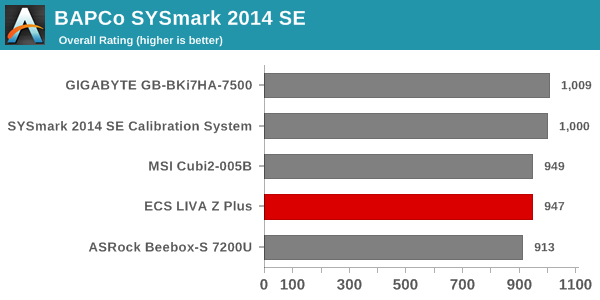
BAPCo's SYSmark 2014 SE is an application-based benchmark that uses real-world applications to replay usage patterns of business users in the areas of office productivity, media creation and data/financial analysis. In addition, it also addresses the responsiveness aspect which deals with user experience as related to application and file launches, multi-tasking etc. Scores are meant to be compared against a reference desktop (the SYSmark 2014 SE calibration system in the graphs below). While the SYSmark 2014 benchmark used a Haswell-based desktop configuration, the SYSmark 2014 SE makes the move to a Lenovo ThinkCenter M800 (Intel Core i3-6100, 4GB RAM and a 256GB SATA SSD). The calibration system scores 1000 in each of the scenarios. A score of, say, 2000, would imply that the system under test is twice as fast as the reference system.
SYSmark 2014 SE also adds energy measurement to the mix. A high score in the SYSmark benchmarks might be nice to have, but, potential customers also need to determine the balance between power consumption and the efficiency of the system. For example, in the average office scenario, it might not be worth purchasing a noisy and power-hungry PC just because it ends up with a 2000 score in the SYSmark 2014 SE benchmarks. In order to provide a balanced perspective, SYSmark 2014 SE also allows vendors and decision makers to track the energy consumption during each workload. In the graphs below, we find the total energy consumed by the PC under test for a single iteration of each SYSmark 2014 SE workload and how it compares against the calibration systems.

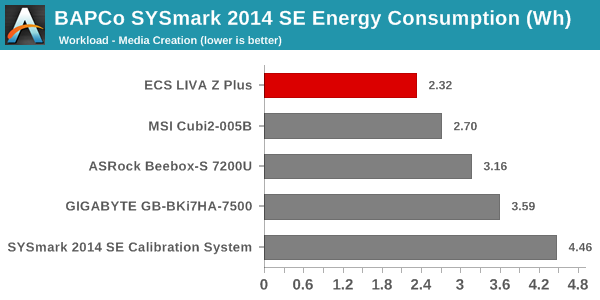
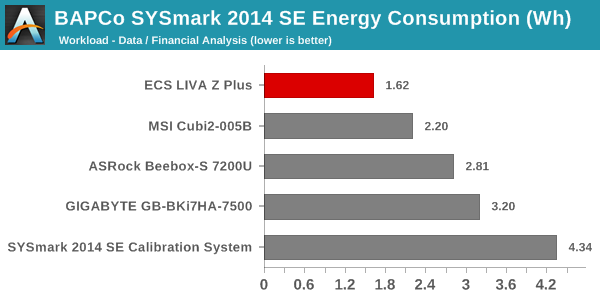
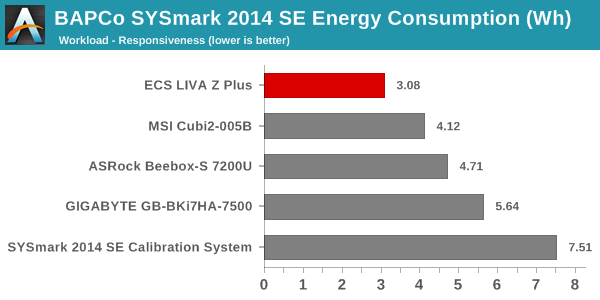
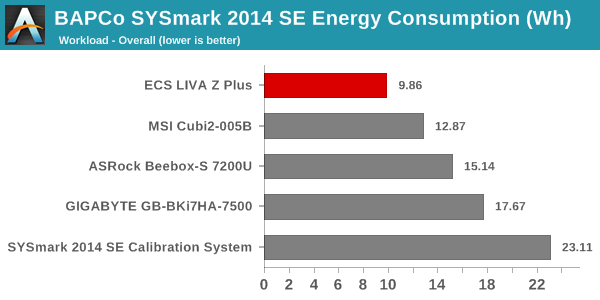
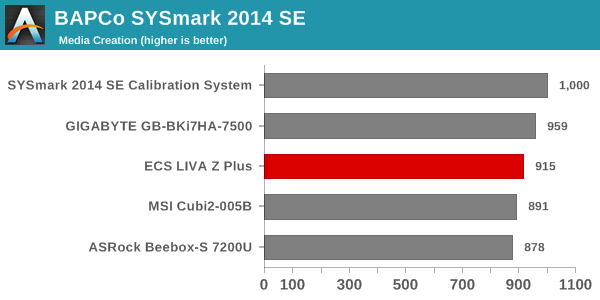
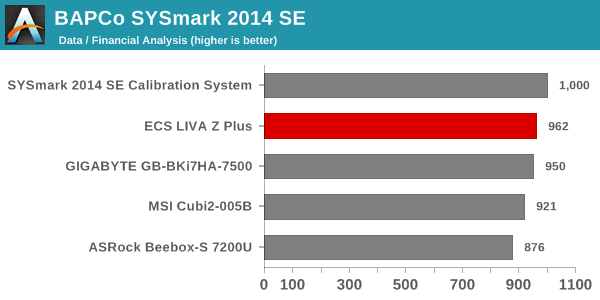
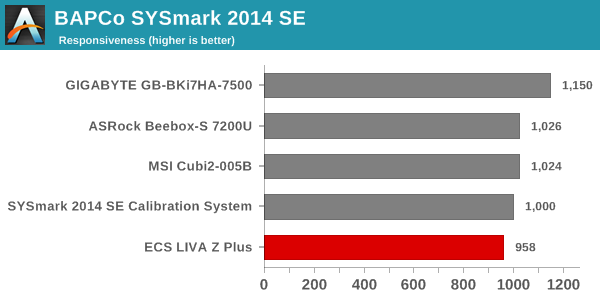
The LIVA Z Plus is equipped with the Core i5-7300U, which has a slightly higher base frequency compared to the Core i5-7200U in the Beebox. However, the amount of L2 cache as well as the base frequency is better for the Core i7s in the MSI Cubi 2 and the BRIX systems in the above graphs. However, the LIVA Z Plus leaves some performance on the table by only using one of the two available SODIMM slots. That, combined with a SATA SSD (instead of NVMe), does help in lowering the energy consumed during the various SYSmark 2014 SE workloads.
Futuremark PCMark 8
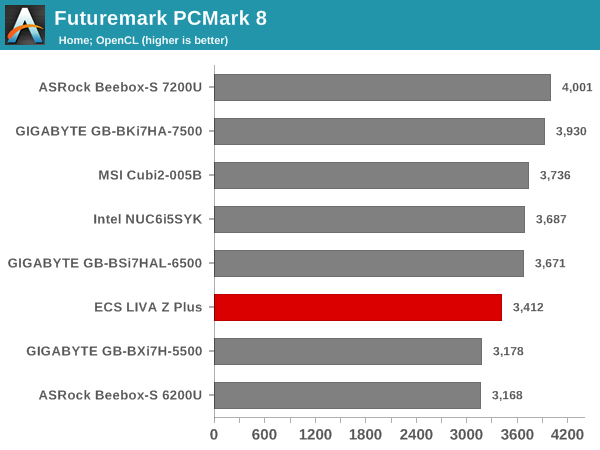
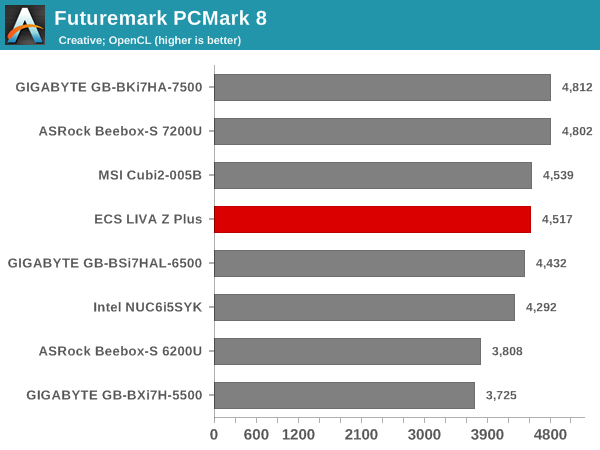
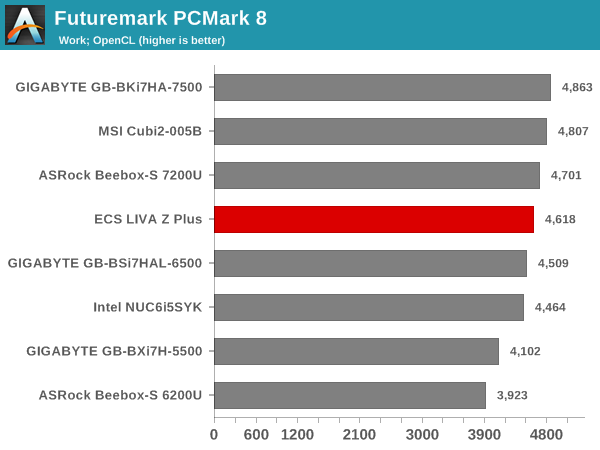
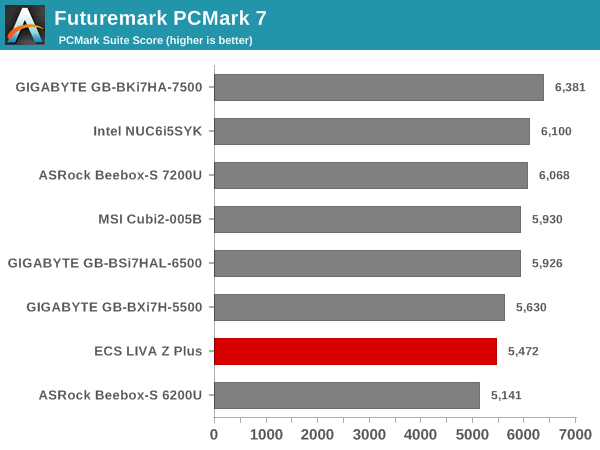
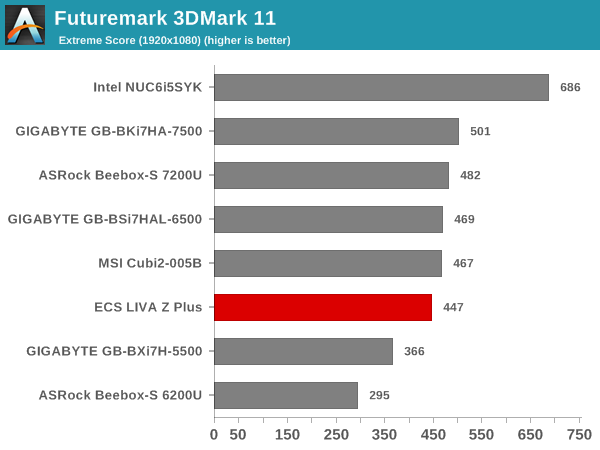
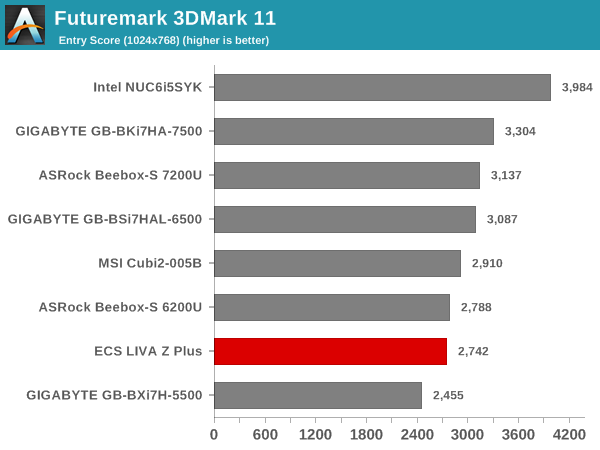
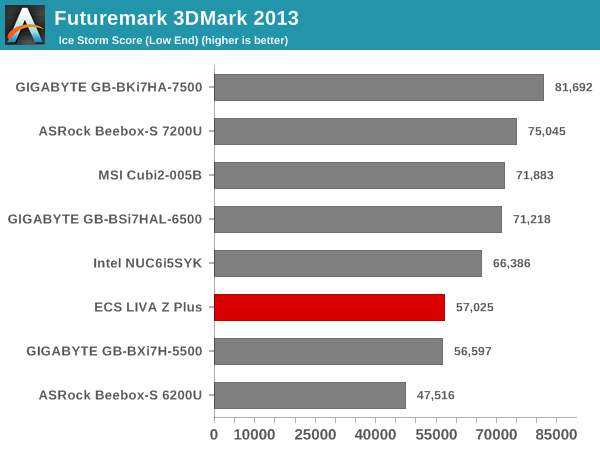
PCMark 8 provides various usage scenarios (home, creative and work) and offers ways to benchmark both baseline (CPU-only) as well as OpenCL accelerated (CPU + GPU) performance. We benchmarked select PCs for the OpenCL accelerated performance in all three usage scenarios. These scores are heavily influenced by the CPU in the system, as well as the memory configuration. The ECS LIVA Z Plus comes in the middle of the pack in these benchmarks.
Miscellaneous Futuremark Benchmarks
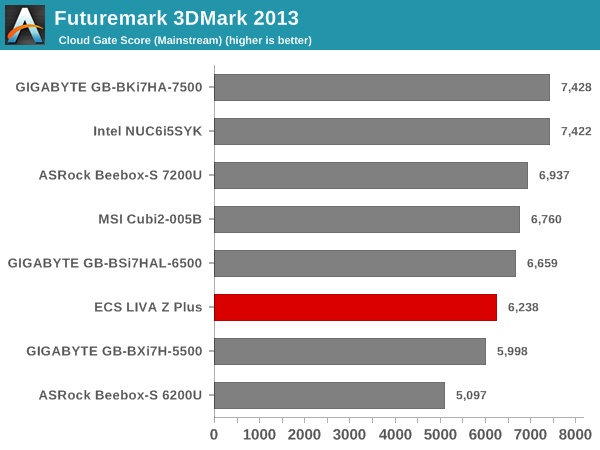
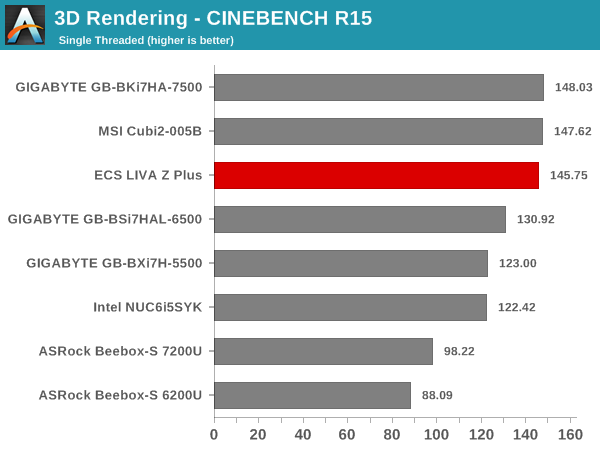
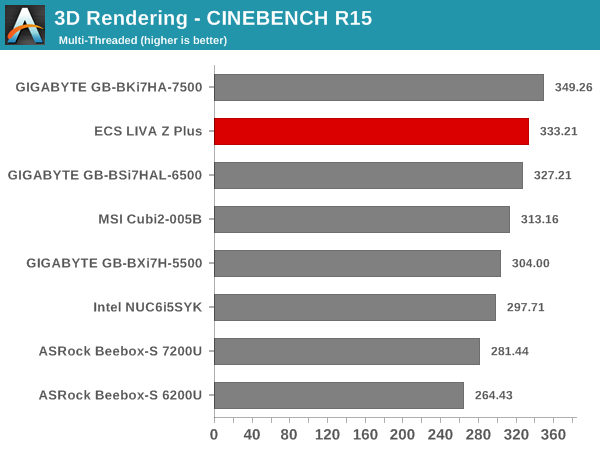
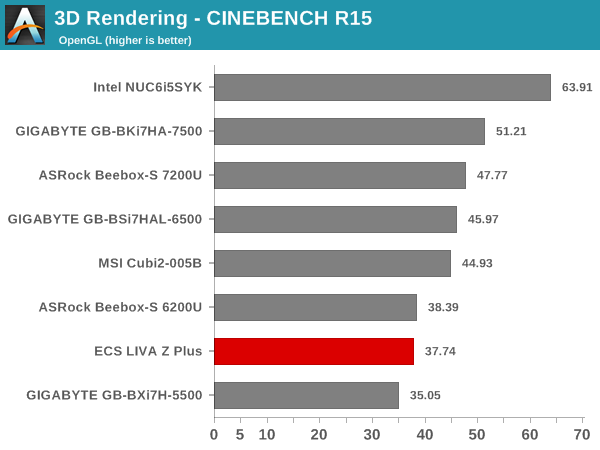
3D Rendering - CINEBENCH R15
We have moved on from R11.5 to R15 for 3D rendering evaluation. CINEBENCH R15 provides three benchmark modes - OpenGL, single threaded and multi-threaded. Evaluation of select PCs in all three modes provided us the following results. On the CPU-limited workloads, we find that the higher base frequency and turbo speeds help the ECS LIVA Z Plus land in the top three. The OpenGL version is probably handicapped by the memory configuration, considering that the GPU operating frequencies are pretty much the same across all the considered KBL-U PCs.


12 Comments
View All Comments
neo_1221 - Monday, May 15, 2017 - link
"Transcend TS128GMTS400 (512 GB)"I think you mean 128GB. Now I don't know if it's actually 20nm MLC or if that's a copy-paste error too...