The AMD Ryzen 5 1600X vs Core i5 Review: Twelve Threads vs Four at $250
by Ian Cutress on April 11, 2017 9:00 AM ESTBenchmarking Performance: CPU Rendering Tests
Rendering tests are a long-time favorite of reviewers and benchmarkers, as the code used by rendering packages is usually highly optimized to squeeze every little bit of performance out. Sometimes rendering programs end up being heavily memory dependent as well - when you have that many threads flying about with a ton of data, having low latency memory can be key to everything. Here we take a few of the usual rendering packages under Windows 10, as well as a few new interesting benchmarks.
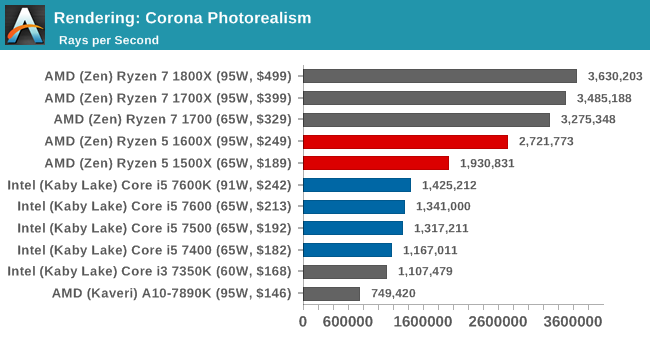
Corona 1.3
Corona is a standalone package designed to assist software like 3ds Max and Maya with photorealism via ray tracing. It's simple - shoot rays, get pixels. OK, it's more complicated than that, but the benchmark renders a fixed scene six times and offers results in terms of time and rays per second. The official benchmark tables list user submitted results in terms of time, however I feel rays per second is a better metric (in general, scores where higher is better seem to be easier to explain anyway). Corona likes to pile on the threads, so the results end up being very staggered based on thread count.
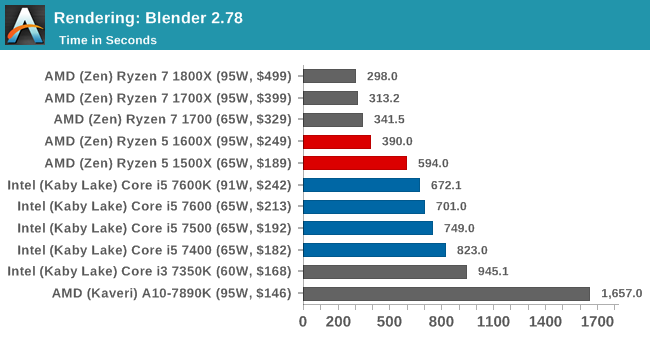
Blender 2.78
For a render that has been around for what seems like ages, Blender is still a highly popular tool. We managed to wrap up a standard workload into the February 5 nightly build of Blender and measure the time it takes to render the first frame of the scene. Being one of the bigger open source tools out there, it means both AMD and Intel work actively to help improve the codebase, for better or for worse on their own/each other's microarchitecture.
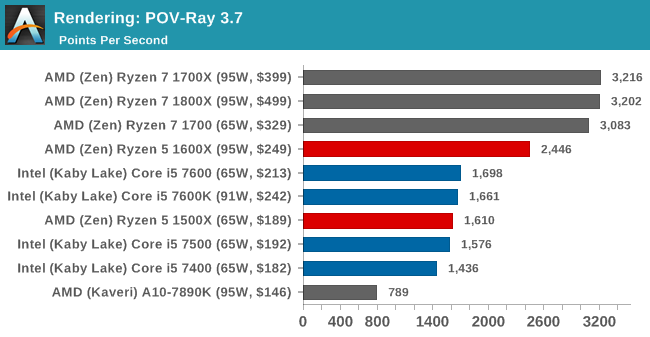
POV-Ray 3.7.1
Another regular benchmark in most suites, POV-Ray is another ray-tracer but has been around for many years. It just so happens that during the run up to AMD's Ryzen launch, the code base started to get active again with developers making changes to the code and pushing out updates. Our version and benchmarking started just before that was happening, but given time we will see where the POV-Ray code ends up and adjust in due course.
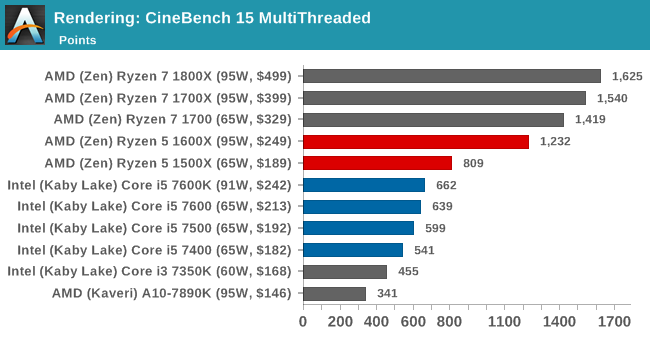
Cinebench R15
The latest version of CineBench has also become one of those 'used everywhere' benchmarks, particularly as an indicator of single thread performance. High IPC and high frequency gives performance in ST, whereas having good scaling and many cores is where the MT test wins out.


254 Comments
View All Comments
Phiro69 - Tuesday, April 11, 2017 - link
Thank you Ian!Maybe at some point as part of your benchmark description you have a url to a page showing basic (e.g. exactly the level of information you provided above but not step by step hand holding) benchmark setup instructions. I know I wonder if I've configured my builds correctly when I put together new systems; I buy the parts based on benchmarks but I don't ever really validate they perform at that level/I have things set correctly.
qupada - Tuesday, April 11, 2017 - link
I was curious about this too. Obviously a direct comparison between your Windows test and my Linux one is going to be largely meaningless but I felt the need to try anyway. Since Linux is all I have, this is what we get.My Haswell-EP Xeon E5-1660v3 - approximately an i7-5960X with ECC RAM, and that CPU seems to be oft-compared to the 1800X you have put in your results - clocks in at 78:36 to compile Chromium (59.0.3063.4), or 18.31 compiles per day (hoorah for the pile of extra money I spent on it resulting in such a small performance margin). However that's for the entire process, from unpacking the tarball, compiling, then tarring and compressing the compiled result. My machine is running Gentoo, it was 'time emerge -OB chromium' (I didn't feel like doing it manually to get just the compile). Am I reading right you've used the result of timing the 'ninja' compile step only?
I only ask because there definitely could be other factors in play for this one - for the uninitiated reading this comment, Chromium is a fairly massive piece of software, the source tar.xz file for the version I tried is 496MB (decompressing to 2757MB), containing around 28,000 directories and a shade under 210,000 files. At that scale, filesystem cache is definitely going to come into play, I would probably expect a slightly different result for a freshly rebooted machine versus one where the compile was timed immediately after unpacking the source code and it was still in RAM (obviously less of a difference on an SSD, but probably still not none).
It is an interesting test metric though, and again I haven't done this on WIndows, but there is a chunk in the middle of the process that seems to be single-threaded on a Linux compile (probably around 10% of the total wall clock time), so it is actually quite nice that it will benefit from both multi-core and single-core performance and boost clocks.
Also with a heavily multi-threaded process of that sort of duration, probably a great test of how long you get before thermal throttling starts to hurt you. I have to admit I'm cheating a bit by watercooling mine (not overclocked though) so it'll happily run 3.3GHz on a base clock of 3.0 across all eight cores for hours on end at around ~45°C/115°F.
rarson - Tuesday, April 11, 2017 - link
14393.969 was released March 20th, any reason you didn't use that build?Ian Cutress - Friday, April 14, 2017 - link
Because my OS is already locked down for the next 12-18 months of testing.Konobi - Tuesday, April 11, 2017 - link
I don't know what's up with those FPS number in rocket league 1080p. I have ye olde FX-8350 @ 4.8GHz and a GTX 1070 @ 2.1GHz and I get 244fps max and 230FPS average at 1080p Ultra.Ian Cutress - Tuesday, April 11, 2017 - link
I'm running a 4x4 bot match on Aquadome. Automated inputs to mimic gameplay and camera switching / tricks, FRAPS over 4 minutes of a match.jfmonty2 - Wednesday, April 12, 2017 - link
Why Aquadome specifically? It's been criticized for performance issues compared to most of the other maps in the game, although the most recent update has improved that.Ian Cutress - Friday, April 14, 2017 - link
On the basis that it's the most strenuous map to test on. Lowest common denominator and all that.Adam Saint - Tuesday, April 11, 2017 - link
"Looking at the results, it’s hard to notice the effect that 12 threads has on multithreaded CPU tests"Perhaps you mean *not* hard to notice? :)
coder543 - Tuesday, April 11, 2017 - link
I agree. That was also confusing.