The Intel Optane SSD DC P4800X (375GB) Review: Testing 3D XPoint Performance
by Billy Tallis on April 20, 2017 12:00 PM ESTRandom Read
Random read speed is the most difficult performance metric for flash-based SSDs to improve on. There is very limited opportunity for a drive to do useful prefetching or caching, and parallelism from multiple dies and channels can only help at higher queue depths. The NVMe protocol reduces overhead slightly, but even a high-end enterprise PCIe SSD can struggle to offer random read throughput that would saturate a SATA link.
Real-world random reads are often blocking operations for an application, such as when traversing the filesystem to look up which logical blocks store the contents of a file. Opening even an non-fragmented file can require the OS to perform a chain of several random reads, and since each is dependent on the result of the last, they cannot be queued.
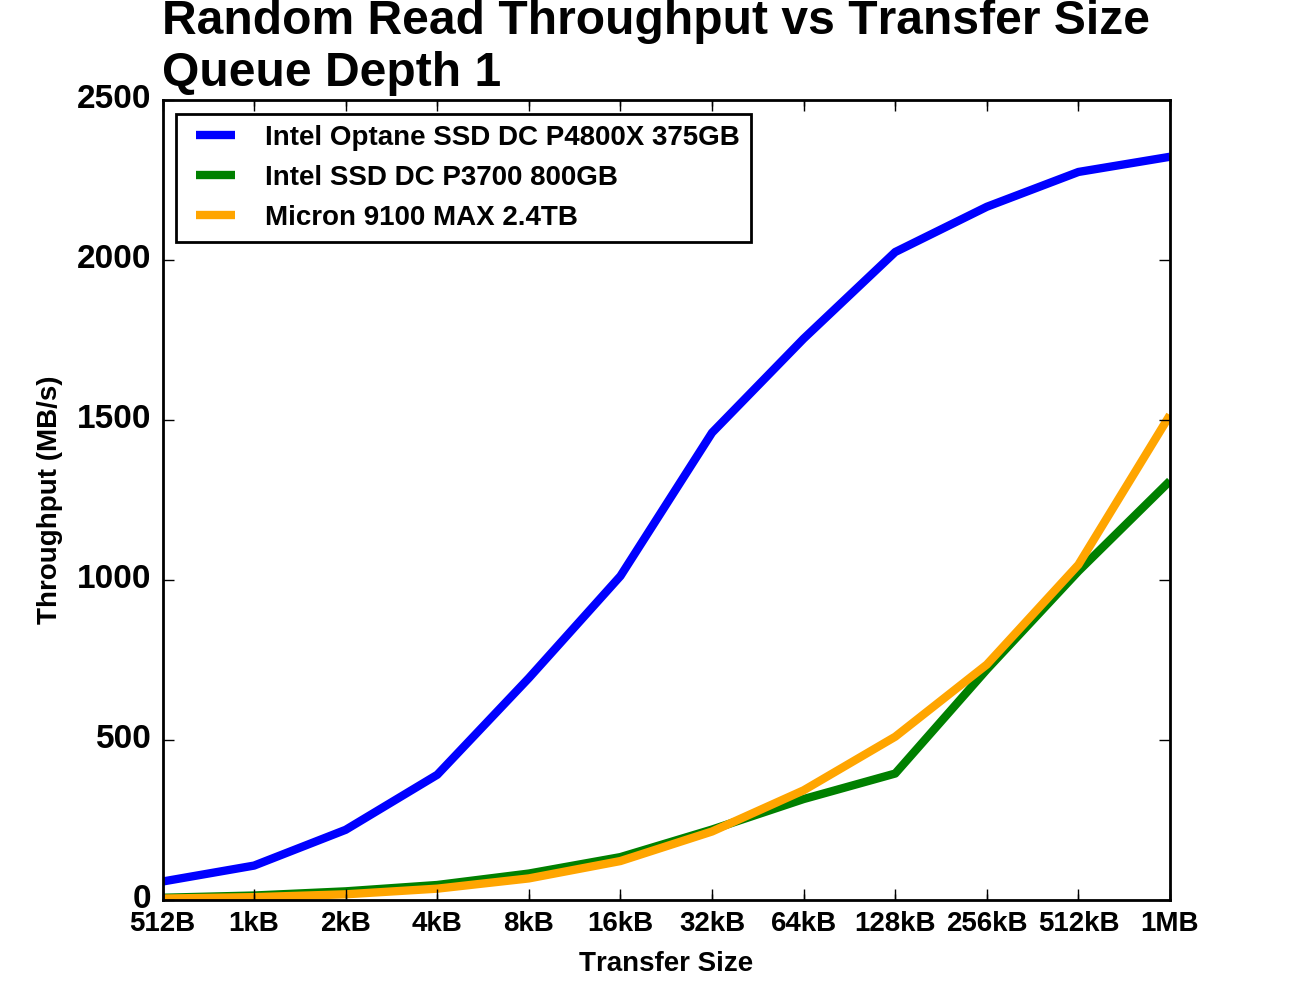
Our first test of random read performance looks at the dependence on transfer size. Most SSDs focus on 4kB random access as that is the most common page size for virtual memory systems and it is a common filesystem block size. Maximizing 4kB performance has gotten more difficult as NAND flash has moved to page sizes that are larger than 4kB, and some SSD vendors have started including 8kB random access specifications. It is worth noting that 3D XPoint memory, from a fundamental standpoint, does not impose any inherent block size restrictions on the Optane SSD, but for compatibility purposes the P4800X by default exposes a 512B sector size.
Queue Depth 1
For our test, each transfer size was tested for four minutes and the statistics exclude the first minute. The drives were preconditioned to steady state by filling them with 4kB random writes twice over.
 |
|||||||||
| Vertical Axis scale: | Linear | Logarithmic | |||||||
The Optane SSD starts off with about eight times the throughput of the other drives for small random reads. As the transfer sizes grow past 16kB the Optane SSD's performance starts to level off and the flash SSDs start to catch up, with the Micron 9100 overtaking the Intel P3700. At 1MB transfer size the Optane SSD is only providing an additional 50% higher throughput than the Micron 9100.
Queue Depth >1
Next, we consider 4kB random read performance at queue depths greater than one. A single-threaded process is not capable of saturating the Optane SSD DC P4800X with random reads so this test is conducted with up to four threads. The queue depths of each thread are adjusted so that the queue depth seen by the SSD varies from 1 to 64, with every single queue depth from 1 through 16, then 18, 20, and factors of four up to 64 (so 24, 28, 32... to 64). The timing is the same as for the other tests: four minutes for each tested queue depth, with the first minute excluded from the statistics.
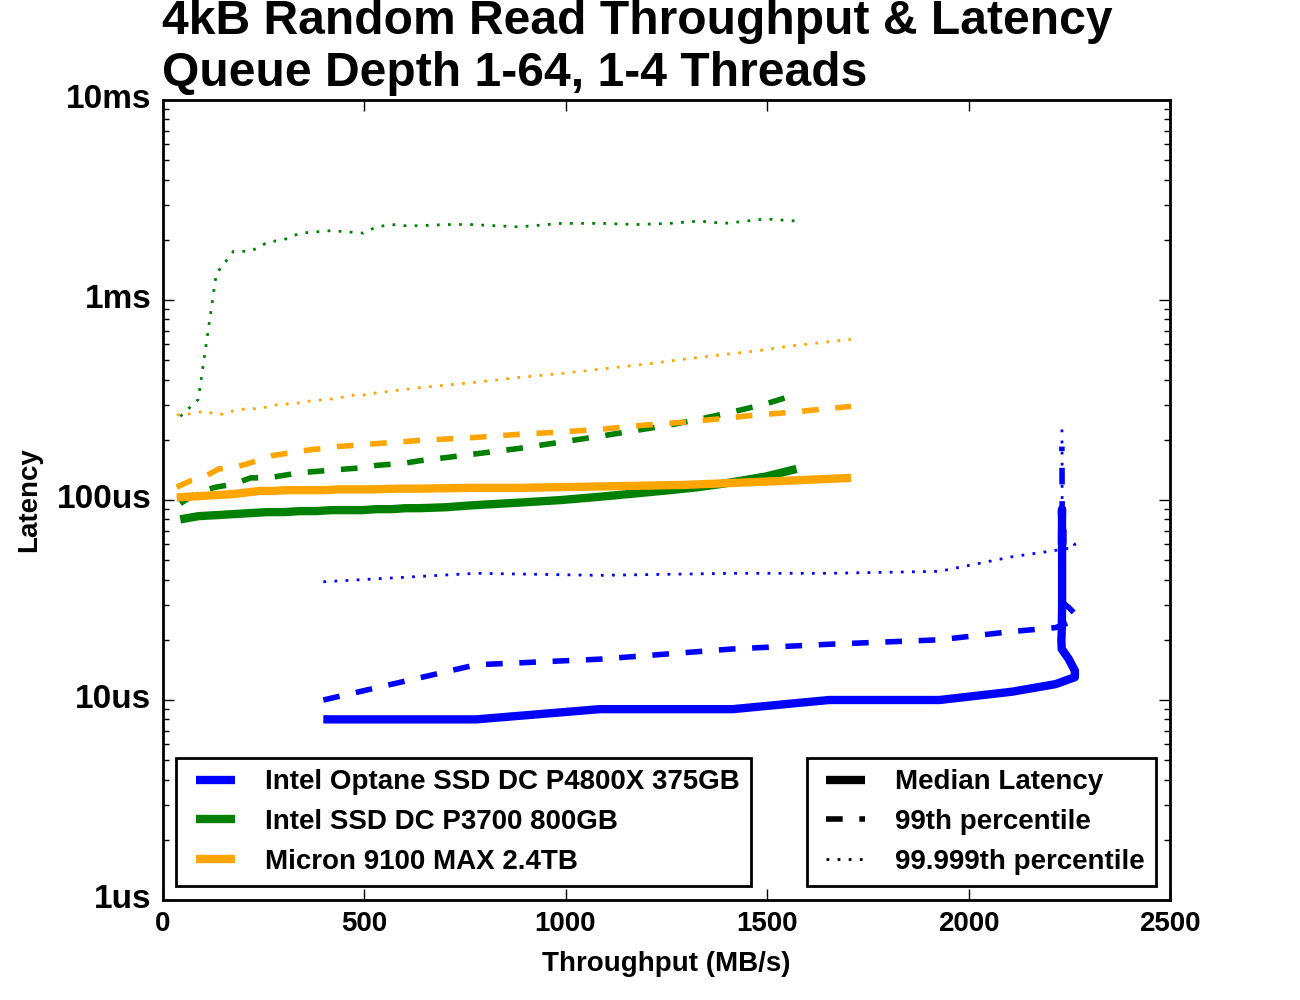
Looking just at the range of throughputs and latencies achieved, it is clear that the Optane SSD DC P4800X is in a different league entirely from the flash SSDs. The Optane SSD saturates part way through the test with a throughput +30% higher than what the Micron 9100 can deliver even at QD64, and at the same time its 99.999th percentile latency is half of the Micron 9100's median latency.
Between the two flash SSDs, the Intel P3700 has better performance on average through most of the test, but its maximum achieved throughput is slightly lower than the Micron 9100's peak and the 9100 offers lower latency at the high end. The Micron 9100 also has much better 99.999th percentile latency across almost the entire range of queue depths.
 |
|||||||||
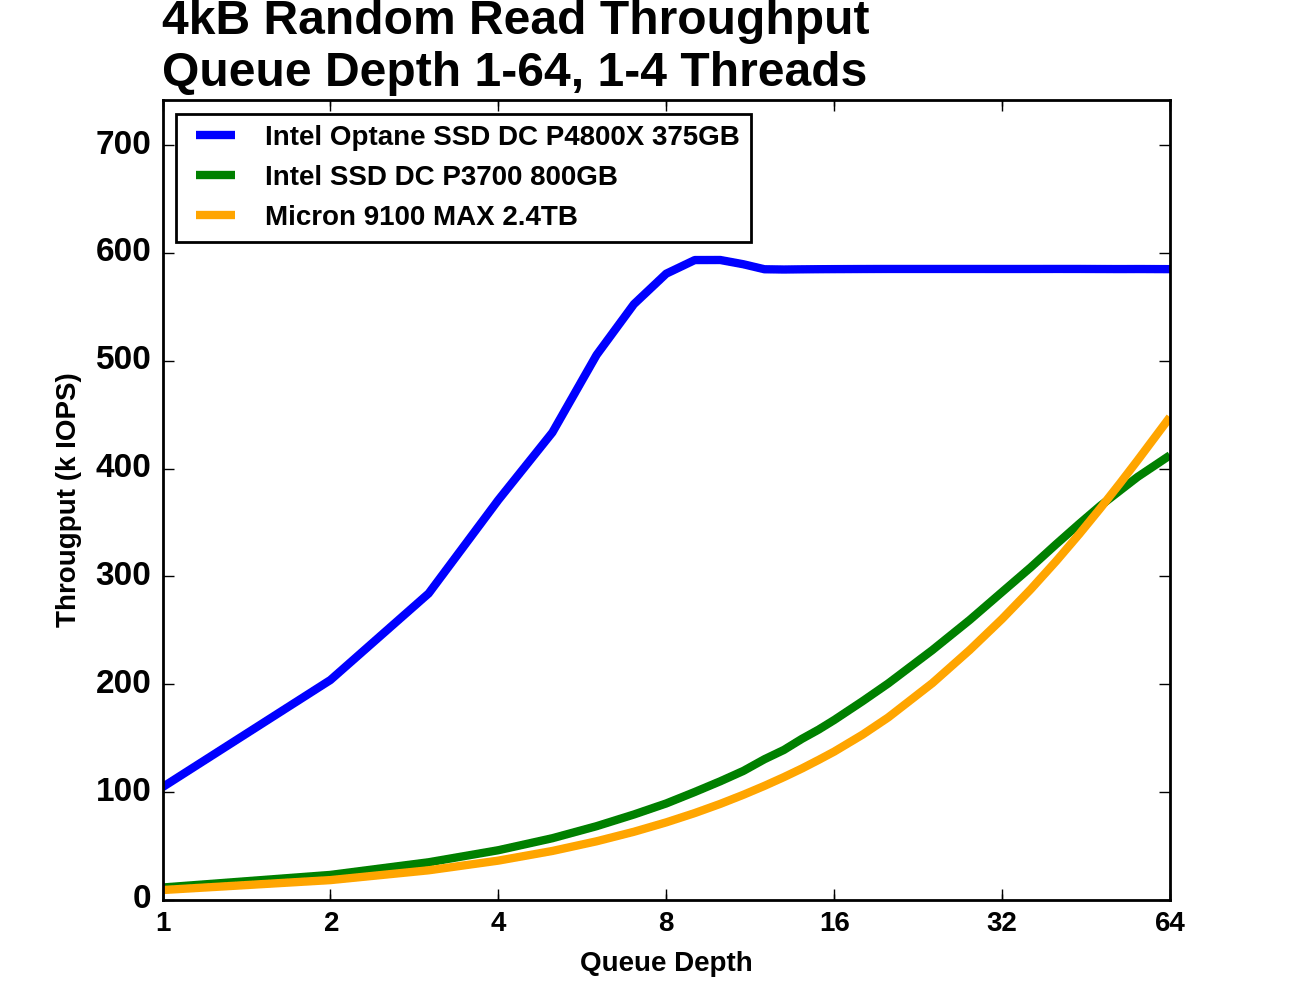
| Vertical Axis units: | IOPS | MB/s | |||||||
In absolute terms, the Optane SSD's performance is uncontested. Even though the Optane SSD's random read throughput is saturating at QD8, by QD6 it's outperforming what either flash SSD can deliver at any reasonable queue depth. Beyond QD8 the Optane SSD does not deliver even incremental improvement in throughput and increasing queue depth just adds latency. This test stops at QD64, which isn't enough to saturate either flash SSD. The Micron 9100 MAX is rated for a maximum of 750k random read IOPS, but clearly the Optane SSD delivers far better performance at the kinds of queue depths that are reasonably attainable.
 |
|||||||||
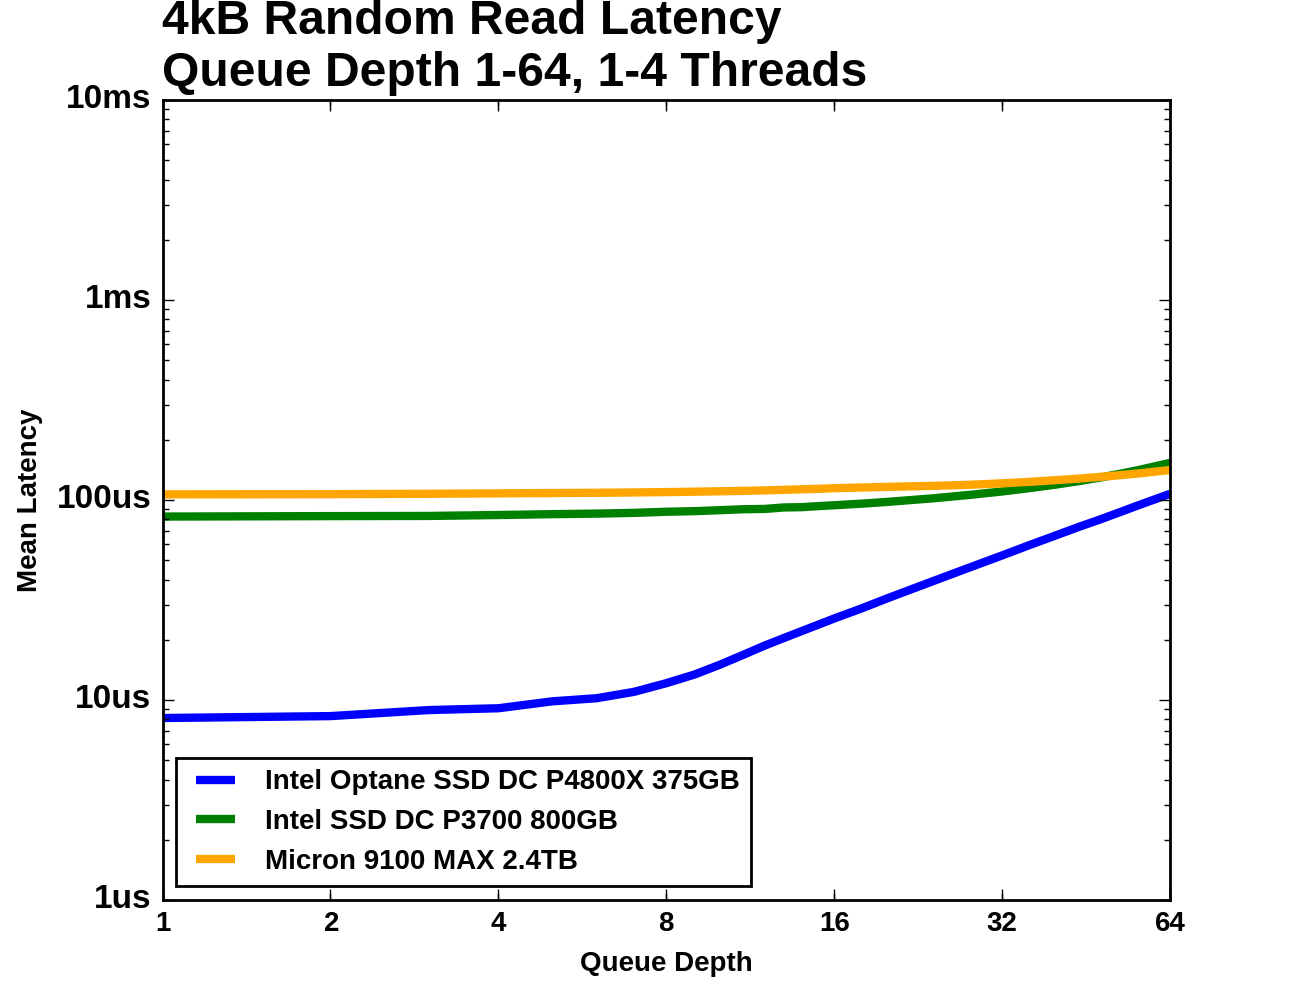
| Mean | Median | 99th Percentile | 99.999th Percentile | ||||||
All three SSDs show median latency growing slowly across a wide range of queue depths. At QD1 the 99th percentile curves are very close to the median latency curves, but at high queue depths the 99th percentile latency is around twice the median. For the Optane SSD and the Micron 9100 MAX, the 99.999th percentile latency is higher by another factor of two or so, but the Intel P3700 cannot deliver such tight regulation and its worst-case latencies are well over a millisecond.
Random Write
Flash memory write operations are far slower than read operations. This is not always reflected in the performance specifications of SSDs because writes can be deferred and combined, allowing the SSD to signal completion before the data has actually moved from the drive's cache to the flash memory. The 3D XPoint memory used by the Optane SSD DC P4800X does have slower writes than reads, and it was commented that Intel did not specificy read latency when Optane was initially announced, but our results show that the disparity is not as large. With inherently fast writes and no page size and erase block limitations, the Optane SSD should be far less reliant on write combining and large spare areas to offer high throughput random writes. The drive's translation layer is probably far simpler than what flash SSDs require, potentially giving a latency advantage.
Queue Depth 1
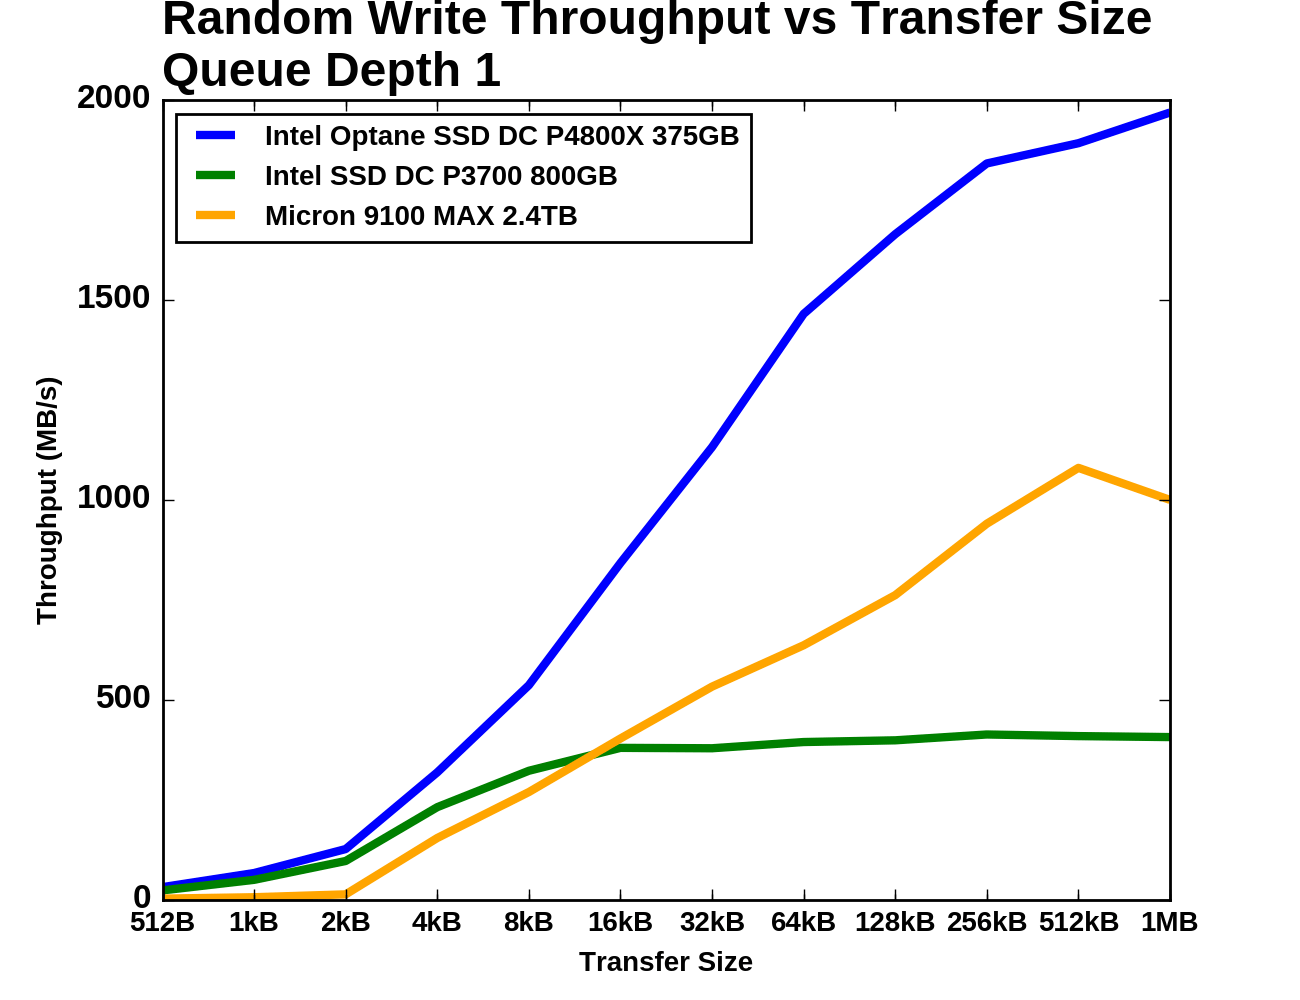
As with random reads, we first examine QD1 random write performance of different transfer sizes. 4kB is usually the most important size, but some applications will make smaller writes when the drive has a 512B sector size. Larger transfer sizes make the workload somewhat less random, reducing the amount of bookkeeping the SSD controller needs to do and generally allowing for increased performance.
 |
|||||||||
| Vertical Axis scale: | Linear | Logarithmic | |||||||
The Micron 9100 really doesn't like random writes smaller than 4kB, but both Intel drives handle it relatively well. The Optane SSD DC P4800X has only a 30% higher throughput result than the P3700 for transfer sizes of 4kB and smaller. The Intel P3700 (owing mainly to its relatively low capacity) doesn't benefit very much as transfer sizes grow beyond 4kB, as it saturates soon after. The Optane SSD maintains a clear lead for transfers of 8kB and larger, averaging about twice the throughput of the Micron 9100 as both show diminishing returns from increased transfer sizes.
Queue Depth >1
The test of 4kB random write throughput at different queue depths is structured identically to its counterpart random write test above. Queue depths from 1 to 64 are tested, with up to four threads used to generate this workload. Each tested queue depth is run for four minutes and the first minute is ignored when computing the statistics.
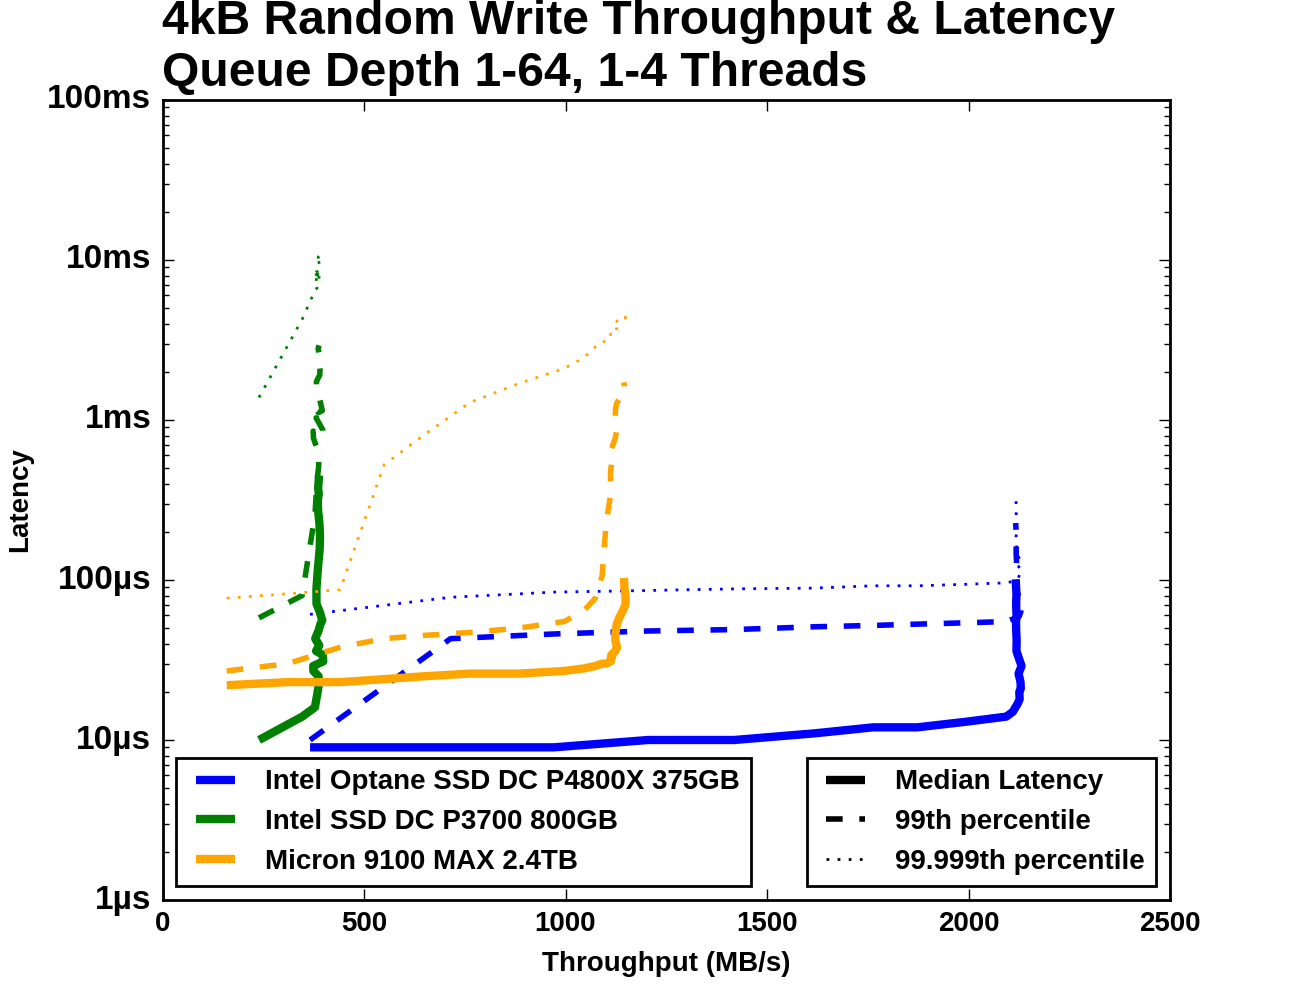
The QD1 starting points for all three drives are somewhat close together, with the fastest drive (the Optane SSD, of course) only offering about twice the random write throughput than the Micron 9100, with less than half the average latency. From there, the gaps widen quickly. The Intel P3700 reaches its maximum throughput very quickly and then the latency just piles up. The Micron 9100 keeps its median and 99th percentile latency reasonably well controlled until reaching its maximum throughput, which is half of what the Optane SSD can deliver.
 |
|||||||||
| Vertical Axis units: | IOPS | MB/s | |||||||
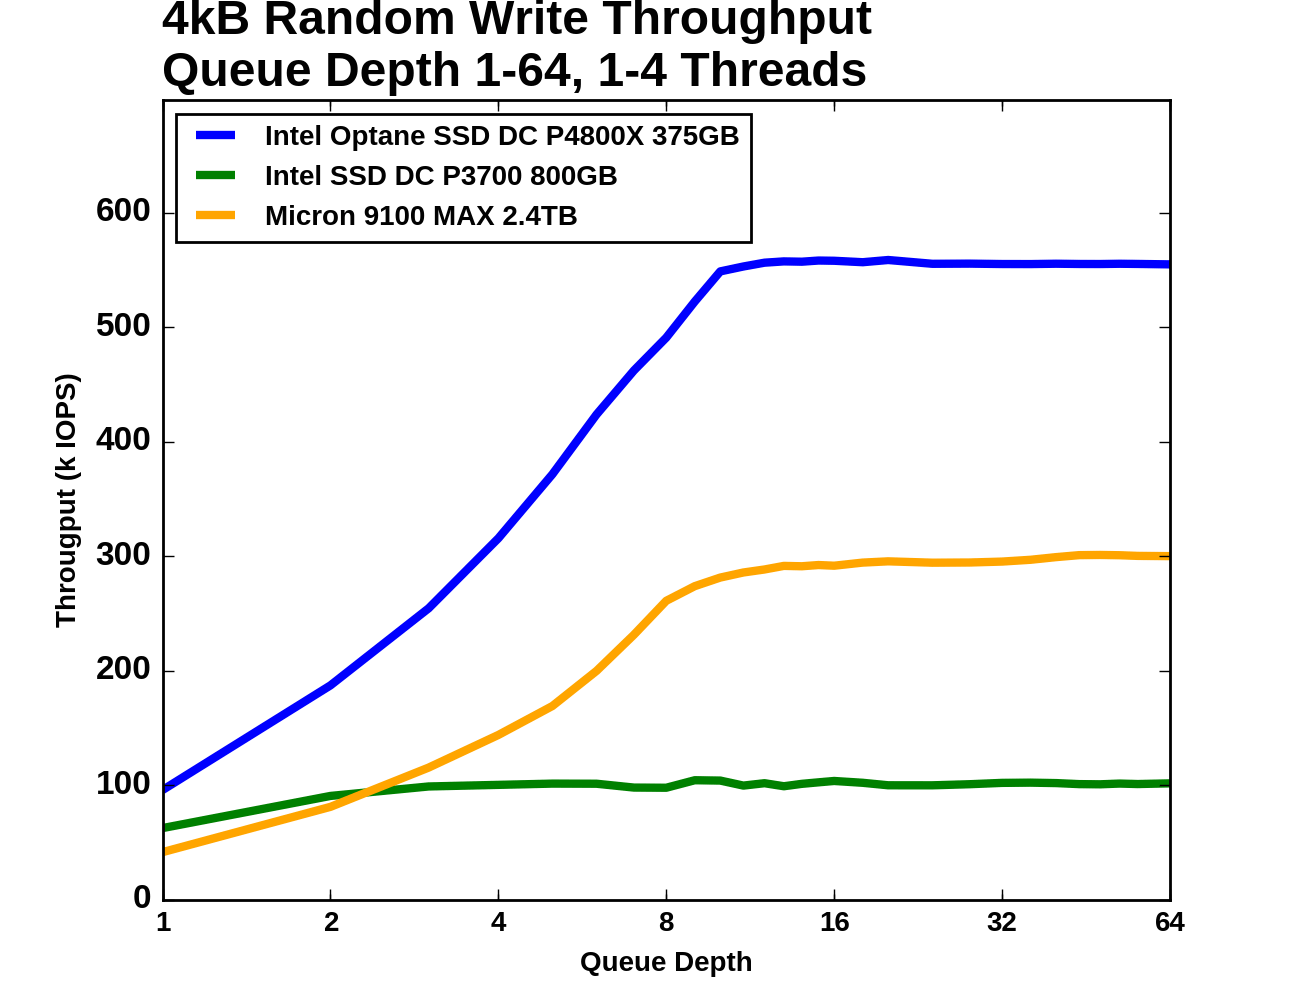
While QD64 wasn't enough to completely saturate the flash SSDs with random reads, here with random writes, QD8 is enough for any of the drives, and the P3700 is done around QD2. The Micron 9100 starts out as the slowest of the three but soon overtakes the Intel P3700.
When examining the latency statistics, we should keep in mind that all three drives reached their full throughput by QD8. At queue depths higher than that, latency increases with no improvement to throughput. A well-tuned server will generally not be operating the drives in that regime, so the right half of these graphs can be mostly ignored.
 |
|||||||||
| Mean | Median | 99th Percentile | 99.999th Percentile | ||||||
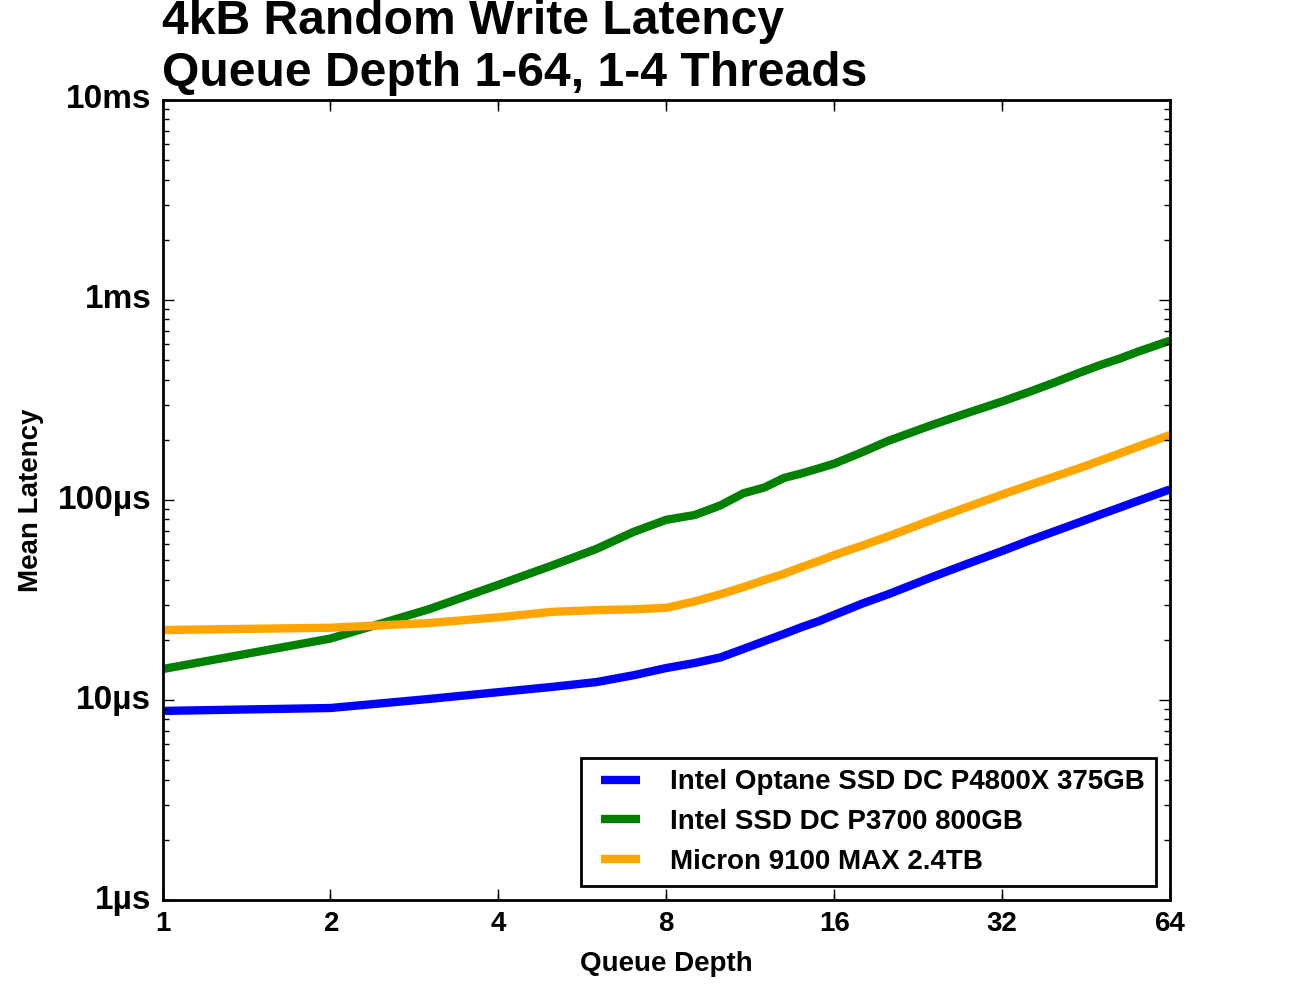
Median latency for these drives is quite flat until they reach saturation. 99th percentile latency for the flash SSDs shoots up when they're operated at unnecessarily high queue depths. The 99.999th percentile latency of the Intel P3700 is never less than 1ms and actually exceeds 10ms at the end of the test. The Micron 9100's 99.999th percentile latency is fairly close to that of the Optane SSD until the 9100 hits QD4, where it spikes and surpasses 1ms shortly before the drive reaches full throughput. Meanwhile, the Optane SSD's 99.999th percentile latency only climbs up to a third of a millisecond even at QD64.


117 Comments
View All Comments
extide - Thursday, April 20, 2017 - link
Queue depth is how many commands the computer has queued up for the drive. The computer can issue commands to the drive faster than it can service them -- so, for example, SATA can support a queue of up to 32 commands. Typical desktop use just doesn't generate enough traffic on the drives to queue up much data so you usually are in the low 1-2, maybe 4 QD. Some server workloads can be higher, but even on a DB server, if you are seeing QD's of 16 I would say your storage is not fast enough for what you are trying to do, so being able to get good performance at low queue depths is truly a breakthrough.bcronce - Thursday, April 20, 2017 - link
For file servers, it's not just the queue depth that's important, it's the number of queues. FreeBSD and OpenZFS have had a lot of blogs and videos about the issues of scaling up servers, especially in regards to multi-core.SATA only supports 1 queue. NVMe supports up to ~65,000 with a depth of ~65,000 each. They're actually having issues saturating high end SSDs because their IO stack can't handle the throughput.
If you have a lot of SATA drives, then you effectively have many queues, but if you want a single/few super fast device(s), like say L2ARC, you need to take advantage of the new protocol.
tuxRoller - Friday, April 21, 2017 - link
The answer is something like the Linux kernel's block multiqueue (ongoing, still not the default for all devices but it shouldn't be more than a few more cycles). Its been a massive undertaking and involved rewriting many drivers.https://lwn.net/Articles/552904/
Shadowmaster625 - Thursday, April 20, 2017 - link
It is a pity intel doesnt make video cards, because 16GB of this would go very well with 4GB of RAM and a decent memory controller. It would lower the overall cost and not impact performance at all.ddriver - Friday, April 21, 2017 - link
"It would lower the overall cost and not impact performance at all."Yeah, I bet. /s
Mugur - Friday, April 21, 2017 - link
I think I read something like this when i740 was launched... :-)Sorry, couldn't resist. But the analogy stands.
ridic987 - Friday, April 21, 2017 - link
"It would lower the overall cost and not impact performance at all."What? This stuff is around 50x slower than DRAM, which itself is reaching its limits in GPUs, hence features like delta color compression... Right now when your gpu runs out of ram it uses your system ram as extra space, this is a far better system.
anynigma - Thursday, April 20, 2017 - link
"Intel's new 3D XPoint non-volatile memory technology, which has been on the cards publically for the last couple of years"I think you mean "IN the cards". In this context, "ON the cards" makes it sound like we've all been missing out on 3D xPoint PCI cards for a "couple of years" :)
SaolDan - Thursday, April 20, 2017 - link
bI think he means it like Its been in the works publicly for a couple of years.DrunkenDonkey - Thursday, April 20, 2017 - link
A bit of a suggestion - can you divide (or provide in final thoughts) SSD reviews per consumer base? Desktop user absolutely does not care about sequential performance or QD16 or even write for what matters (except for the odd time installing something). Database can't care less about sequential or low QD, etc. Giving the tables is good for the odd few % of the readers that actually know what to look for, the rest just take a look at the end of the graph and take a stunningly wrong idea. Just a few comparisons tailored per use will make it so easy for the masses. It was Anand that fought for that during the early sandforce days, he forced ocz to reconsider their ways to tweak SSDs for real world performance, not graph based and got me as a follower. Let that not die in vain and let those, that lack the specific knowledge be informed. Just look at the comments and see how people interpret the results.I know this is enterprise grade SSD, but it is also a showcase for a new technology that will come in our hands soonish.