The Intel Optane SSD DC P4800X (375GB) Review: Testing 3D XPoint Performance
by Billy Tallis on April 20, 2017 12:00 PM ESTChecking Intel's Numbers
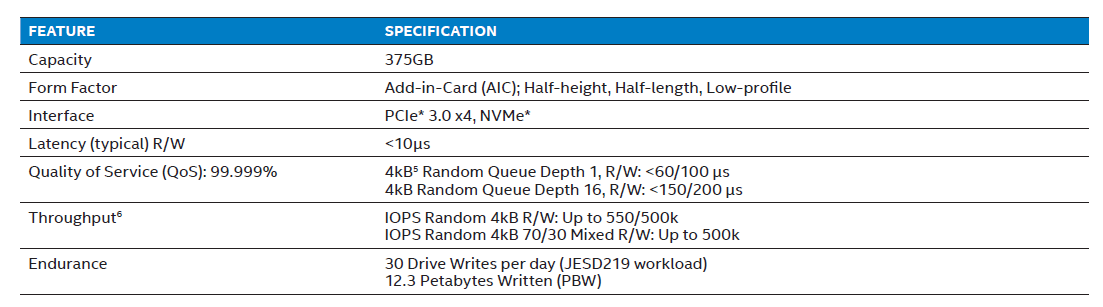
The product brief for the Optane SSD DC P4800X provides a limited set of performance specifications, entirely omitting any standards for sequential throughput. Some latency and throughput targets are provided for 4kB random reads, writes, and a 70/30 mix of reads and writes.
This section has our results for how the Optane SSD measures up to Intel's advertised specifications and how the flash SSDs fare on the same tests. The rest of this review provides deeper analysis of how these drives perform across a range of queue depths, transfer sizes, and read/write mixes.
| 4kB Random Read at a Queue Depth of 1 (QD1) | |||||||
| Drive | Throughput | Latency (µs) | |||||
| MB/s | IOPS | Mean | Median | 99th | 99.999th | ||
| Intel Optane SSD DC P4800X 375GB | 413.0 | 108.3k | 8.9 | 9 | 10 | 37 | |
| Intel SSD DC P3700 800GB | 48.7 | 12.8k | 77.9 | 76 | 96 | 2768 | |
| Micron 9100 MAX 2.4TB | 35.3 | 9.2k | 107.7 | 104 | 117 | 306 | |
Intel's queue depth 1 specifications are expressed in terms of latency, and at a throughput specification at QD1 would be redundant. Intel specifies a "typical" latency of less than 10µs, and most QD1 random reads on the Optane SSD take 8 or 9µs; even the 99th percentile latency is still 10µs.
The 99.999th percentile target is less than 60µs, which the Optane SSD beats by a wide margin. Overall, the Optane SSD passes with ease. The flash SSDs are 8-12x slower on average, and the 99.999th percentile latency of the Intel P3700 is far worse, at around 75x slower.
| 4kB Random Read at a Queue Depth of 16 (QD16) | |||||||
| Drive | Throughput | Latency (µs) | |||||
| MB/s | IOPS | Mean | Median | 99th | 99.999th | ||
| Intel Optane SSD DC P4800X 375GB | 2231.0 | 584.8k | 25.5 | 25 | 41 | 81 | |
| Intel SSD DC P3700 800GB | 637.9 | 167.2k | 93.9 | 91 | 163 | 2320 | |
| Micron 9100 MAX 2.4TB | 517.5 | 135.7k | 116.2 | 114 | 205 | 1560 | |
Intel's QD16 random read result is 584.8k IOPS for throughput, which is above the official specification of 550k IOPS by a few percent. The 99.999th percentile latency scores 81µs, significantly under the target of less than 150µs. The flash SSDs are 3-5x slower on most metrics, but 20-30 times slower at the 99.999th percentile for latency.
| 4kB Random Write at a Queue Depth of 1 (QD1) | |||||||
| Drive | Throughput | Latency (µs) | |||||
| MB/s | IOPS | Mean | Median | 99th | 99.999th | ||
| Intel Optane SSD DC P4800X 375GB | 360.6 | 94.5k | 8.9 | 9 | 10 | 64 | |
| Intel SSD DC P3700 800GB | 350.6 | 91.9k | 9.2 | 9 | 18 | 81 | |
| Micron 9100 MAX 2.4TB | 160.9 | 42.2k | 22.2 | 22 | 24 | 76 | |
In the specifications, the QD1 random write specifications are 10µs on latency, while the 99.999th percentile for latency is relaxed from 60µs to 100µs. In our results, the QD1 random write throughput (360.6 MB/s) of the Optane SSD is a bit lower than the QD1 random read throughput (413.0 MB/s), but the latency is roughly the same (8.9µs mean, 10µs on 99th).
However it is worth noting that the Optane SSD only manages a passing score when the application uses asynchronous I/O APIs. Using simple synchronous write() system calls pushes the average latency up to 11-12µs.
Also, due to the capacitor-backed DRAM caches, the flash SSDs also handle QD1 random writes very well. The Intel P3700 also manages to keep latency mostly below 10µs, and all three drives have 99.999th percentile latency below Intel's 100µs standard for the Optane SSD.
| 4kB Random Write at a Queue Depth of 16 (QD16) | |||||||
| Drive | Throughput | Latency (µs) | |||||
| MB/s | IOPS | Mean | Median | 99th | 99.999th | ||
| Intel Optane SSD DC P4800X 375GB | 2122.5 | 556.4 | 27.0 | 23 | 65 | 147 | |
| Intel SSD DC P3700 800GB | 446.3 | 117.0 | 134.8 | 43 | 1336 | 9536 | |
| Micron 9100 MAX 2.4TB | 1144.4 | 300.0 | 51.6 | 34 | 620 | 3504 | |
The Optane SSD DC P4800X is specified for 500k random write IOPS using four threads to provide a total queue depth of 16. In our tests, the Optane SSD scored 556.4k IOPs, exceeding the specification by more than 11%. This equates to a random write throughput of more than 2GB/s.
The flash SSDs are more dependent on the parallelism benefits of higher capacities, and as a result can be slow at the same capacity. Hence in this case the 2.4TB Micron 9100 fares much better than the 800GB Intel P3700. The Micron 9100 hits its own specification right on the nose with 300k IOPS and the Intel P3700 comfortably exceeds its own 90k IOPS specification, although remaining the slowest of the three by far. The Optane SSD stays well below its 200µs limit for 99.999th percentile latency by scoring 147µs, while the flash SSDs have outliers of several milliseconds. Even at the 99th percentile the flash SSDs are 10-20x slower than Optane.
| 4kB Random Mixed 70/30 Read/Write Queue Depth 16 | |||||||
| Drive | Throughput | Latency (µs) | |||||
| MB/s | IOPS | Mean | Median | 99th | 99.999th | ||
| Intel Optane SSD DC P4800X 375GB | 1929.7 | 505.9 | 29.7 | 28 | 65 | 107 | |
| Intel SSD DC P3700 800GB | 519.9 | 136.3 | 115.5 | 79 | 1672 | 5536 | |
| Micron 9100 MAX 2.4TB | 518.0 | 135.8 | 116.0 | 105 | 1112 | 3152 | |
On a 70/30 read/write mix, the Optane SSD DC P4800X scores 505.9k IOPS, which beats the specification of 500k IOPS by 1%. Both of the flash SSDs deliver roughly the same throughput, a little over a quarter of the speed of the Optane SSD. Intel doesn't provide a latency specification for this workload, but the measurements unsurprisingly fall in between the random read and random write results. While low-end consumer SSDs sometimes perform dramatically worse on mixed workloads than on pure read or write workloads, none of these drives have that problem due to their market positioning and capabilities therein.


117 Comments
View All Comments
lilmoe - Thursday, April 20, 2017 - link
With all the Intel hype and PR, I was expecting the charts to be a bit more, um, flat? Looking at the deltas from start to finish of each benchmark, it looks like the drive has lots of characteristics similar to current flash based SSDs for the same price.Not impressed. I'll wait for your hands on review before bashing it more.
DrunkenDonkey - Thursday, April 20, 2017 - link
This is what the reviews don't explain and leave people in total darkness. You think your shiny new samsung 960 pro with 2.5g/s will be faster than your dusty old 840 evo barely scratching 500? Yes? Then you are in for a surprise - graphs look great, but check on loading times and real program/game benches and see it is exactly the same. That is why SSD reviews should always either divide to sections for the different usage or explain in great simplicity and detail what you need to look for in a PART of the graph. This one is about 8-10 times faster than your SSD so it IS impressive a lot, but price is equally impressive.lilmoe - Friday, April 21, 2017 - link
Yes, that's the problem with readers. They're comparing this to the 960 Pro and other M.2 and even SATA drives. Um.... NO. You compare this with similar form factor SSDs with similar price tags and heat sinks.And no, even QD1 benches aren't that big of a difference.
lilmoe - Friday, April 21, 2017 - link
"And no, even QD1 benches aren't that big of a difference"This didn't sound right, I meant to say that even QD1 isn't very different **compared to enterprise full PCIe SSDs*** at similar prices.
sor - Friday, April 21, 2017 - link
You're crazy. This thing is great. The current weak spot of NAND is on full display here, and xpoint is decimating it. We all know SSDs chug when you throw a lot of writes at them, all of Anandtech "performance consistency" benchmarks show that iops take a nose dive if you benchmark for more than a few seconds. Xpoint doesn't break a sweat and is orders of magnitude faster.I'm also pleasantly surprised at the consistency of sequential. A lot of noise was made about their sequential numbers not being as good as the latest SSDs, but one thing not considered is that SSDs don't hit that number until you get to high queue depths. For individual transfers xpoint seems to actually come closer to max performance.
tuxRoller - Friday, April 21, 2017 - link
I think the controllers have a lot to due with the perf.It's perf profile is eerily similar to the p3700 in too many cases.
Meteor2 - Thursday, April 20, 2017 - link
So... what is a queue depth? And what applications result in short or long QDs?DrunkenDonkey - Thursday, April 20, 2017 - link
Queue depth is concurent access to the drive, at the same time.For desktop/gaming you are looking at 4k random read (95-99% of the time), QD=1
For movie processing you are looking at sequential read/write at QD=1
For light file server you are looking at both higher blocks, say 64k random read and also sequential read, at QD=2/4
For heavy file server you go for QD=8/16
For light database you are looking for QD=4, random read/random write (depends on db type)
For heavy database you are looking for QD=16/more, random read/random write (depends on db type)
Meteor2 - Thursday, April 20, 2017 - link
Thank you!bcronce - Thursday, April 20, 2017 - link
A heavy file server only has such a small queue depth if using spinning rust, to keep down latency. When using SSDs, file servers have QDs in 64-256 range.