The Intel Optane SSD DC P4800X (375GB) Review: Testing 3D XPoint Performance
by Billy Tallis on April 20, 2017 12:00 PM ESTSequential Read
Intel provides no specifications for sequential access performance of the Optane SSD DC P4800X. Buying an Optane SSD for a mostly sequential workload would make very little sense given that sufficiently large flash-based SSDs or RAID arrays can offer plenty of sequential throughput. Nonetheless, it will be interesting to see how much faster the Optane SSD is with sequential transfers instead of random access.
Sequential access is usually tested with 128kB transfers, but this is more of an industry convention and is not based on any workload trend as strong as the tendency for random I/Os to be 4kB. The point of picking a size like 128kB is to have transfers be large enough that they can be striped across multiple controller channels and still involve writing a full page or more to the flash on each channel. Real-world sequential transfer sizes vary widely depending on factors like which application is moving the data or how fragmented the filesystem is.
Even without a large native page size to its 3D XPoint memory, we expect the Optane SSD DC P4800X to exhibit good performance from larger transfers. A large transfer requires the controller to process fewer operations for the same amount of user data, and fewer operations means less protocol overhead on the wire. Based on the random access tests, it appears that the Optane SSD is internally managing the 3D XPoint memory in a way that greatly benefits from transfers being at least 4kB even though the drive emulates a 512B sector size out of the box.
The drives were preconditioned with two full writes using 4kB random writes, so the data on each drive is entirely fragmented. This may limit how much prefetching of user data the drives can perform on the sequential read tests, but they can likely benefit from better locality of access to their internal mapping tables.
Queue Depth 1
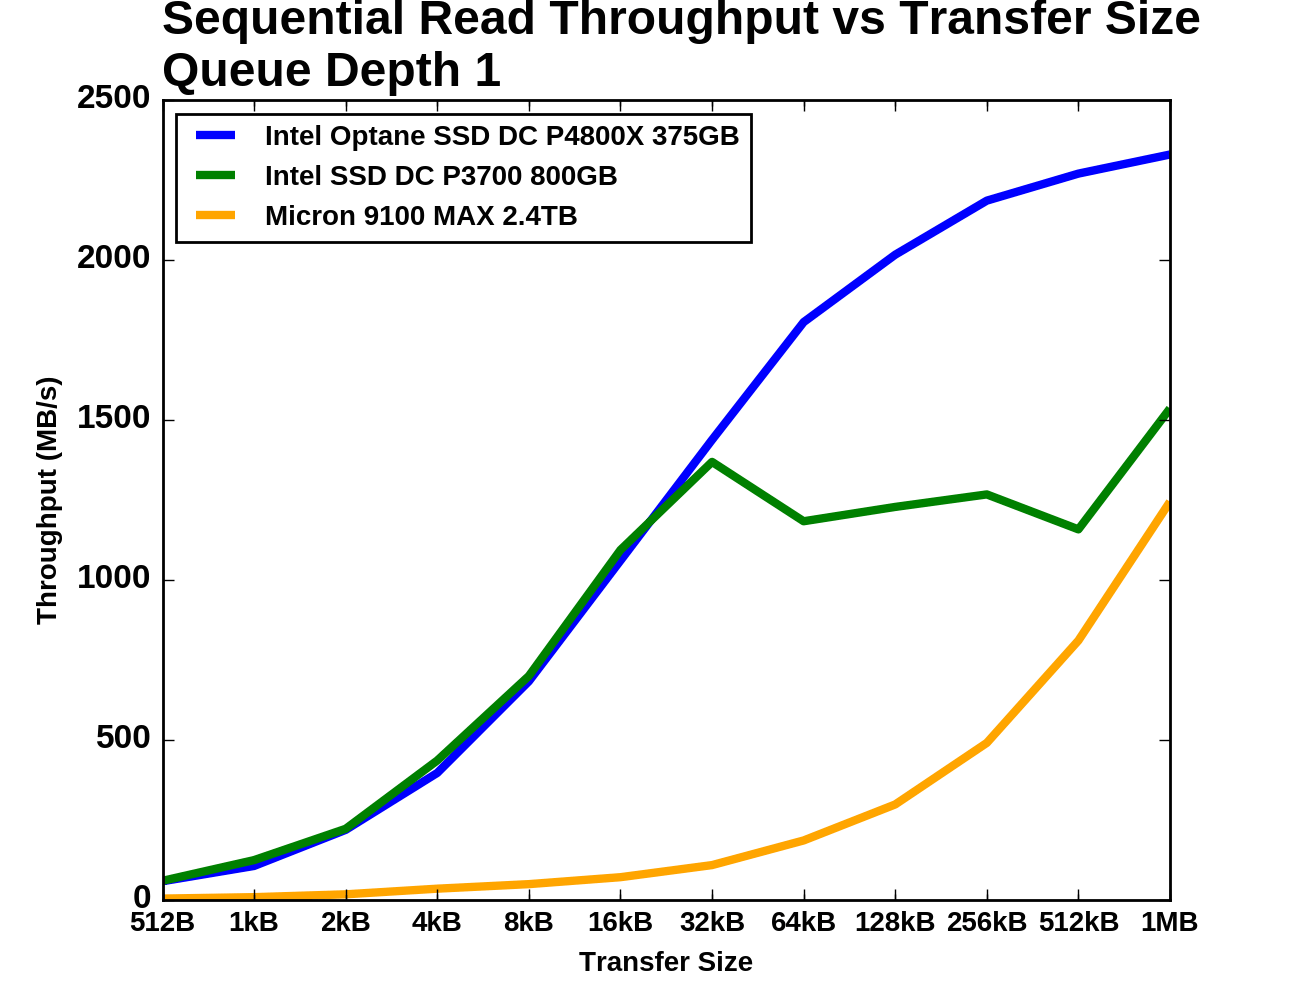
The test of sequential read performance at different transfer sizes was conducted at queue depth 1. Each transfer size was used for four minutes, and the throughput was averaged over the final three minutes of each test segment.
 |
|||||||||
| Vertical Axis scale: | Linear | Logarithmic | |||||||
For transfer sizes up to 32kB, both Intel drives deliver similar sequential read speeds. Beyond 32kB the P3700 appears to be saturated but also highly inconsistent. The Micron 9100 is plodding along with very low but steadily growing speeds, and by the end of the test it has almost caught up with the Intel P3700. It was at least ten times slower than the Optane SSD until the transfer size reached 64kB. The Optane SSD passes 2GB/s with 128kB transfers and finishes the test at 2.3GB/s.
Queue Depth > 1
For testing sequential read speeds at different queue depths, we use the same overall test structure as for random reads: total queue depths of up to 64 are tested using a maximum of four threads. Each thread is reading sequentially but from a different region of the drive, so the read commands the drive receives are not entirely sorted by logical block address.
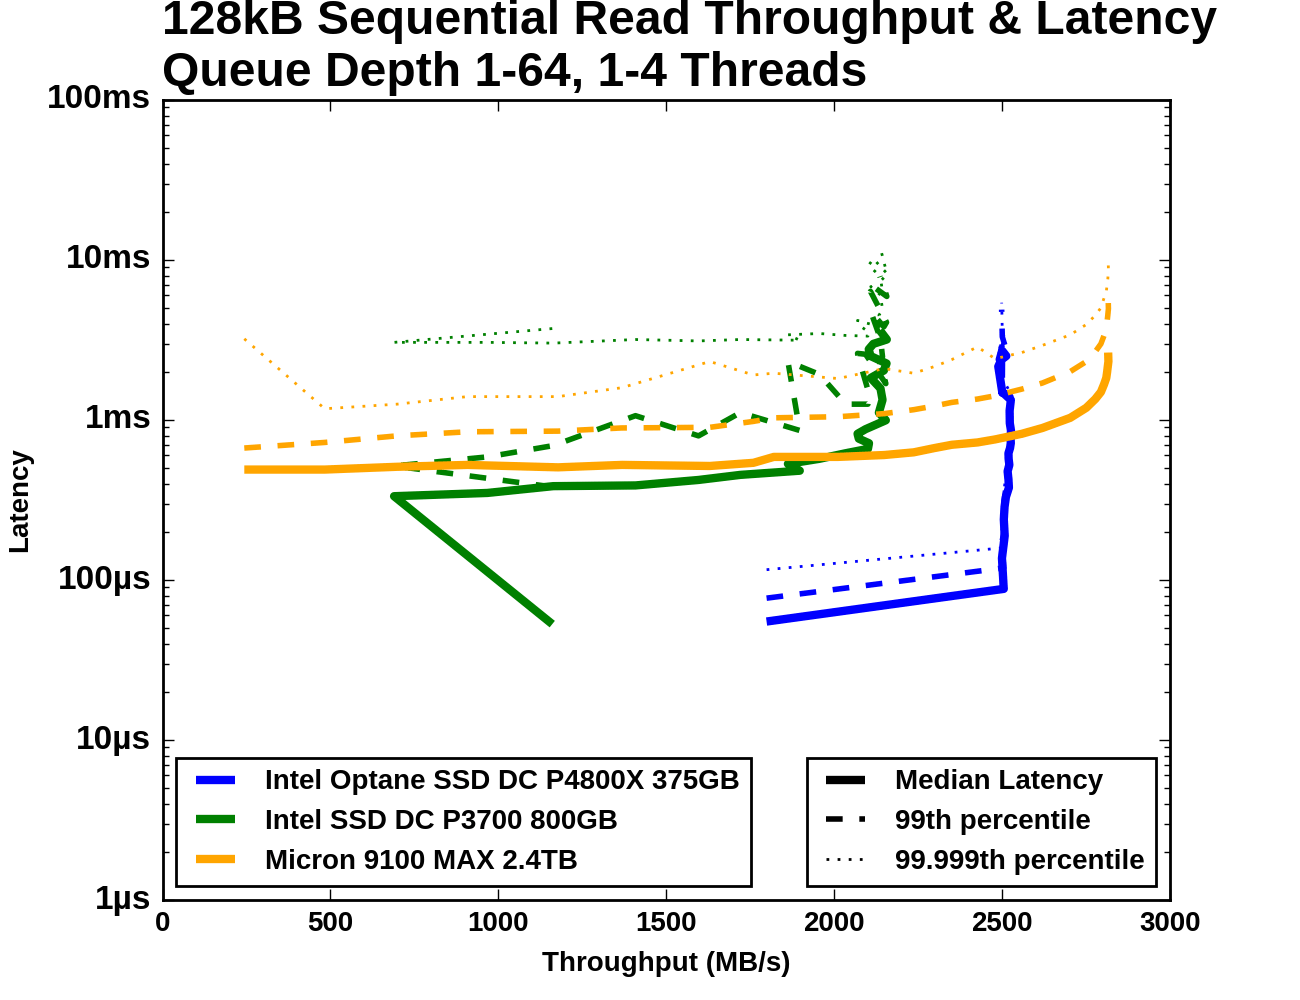
The Optane SSD DC P4800X starts out with a far higher QD1 sequential read speed than either flash SSD can deliver. The Optane SSD's median latency at QD1 is not significantly better than what the Intel P3700 delivers, but the P3700's 99th and 99.999th percentile latencies are at least an order of magnitude worse. Beyond QD1, the Optane SSD saturates while the Intel P3700 takes a temporary hit to throughput and a permanent hit to latency. The Micron 9100 starts out with low throughput and fairly high latency, but with increasing queue depth it manages to eventually surpass the Optane SSD's maximum throughput, albeit with ten times the latency.
 |
|||||||||
| Vertical Axis units: | IOPS | MB/s | |||||||
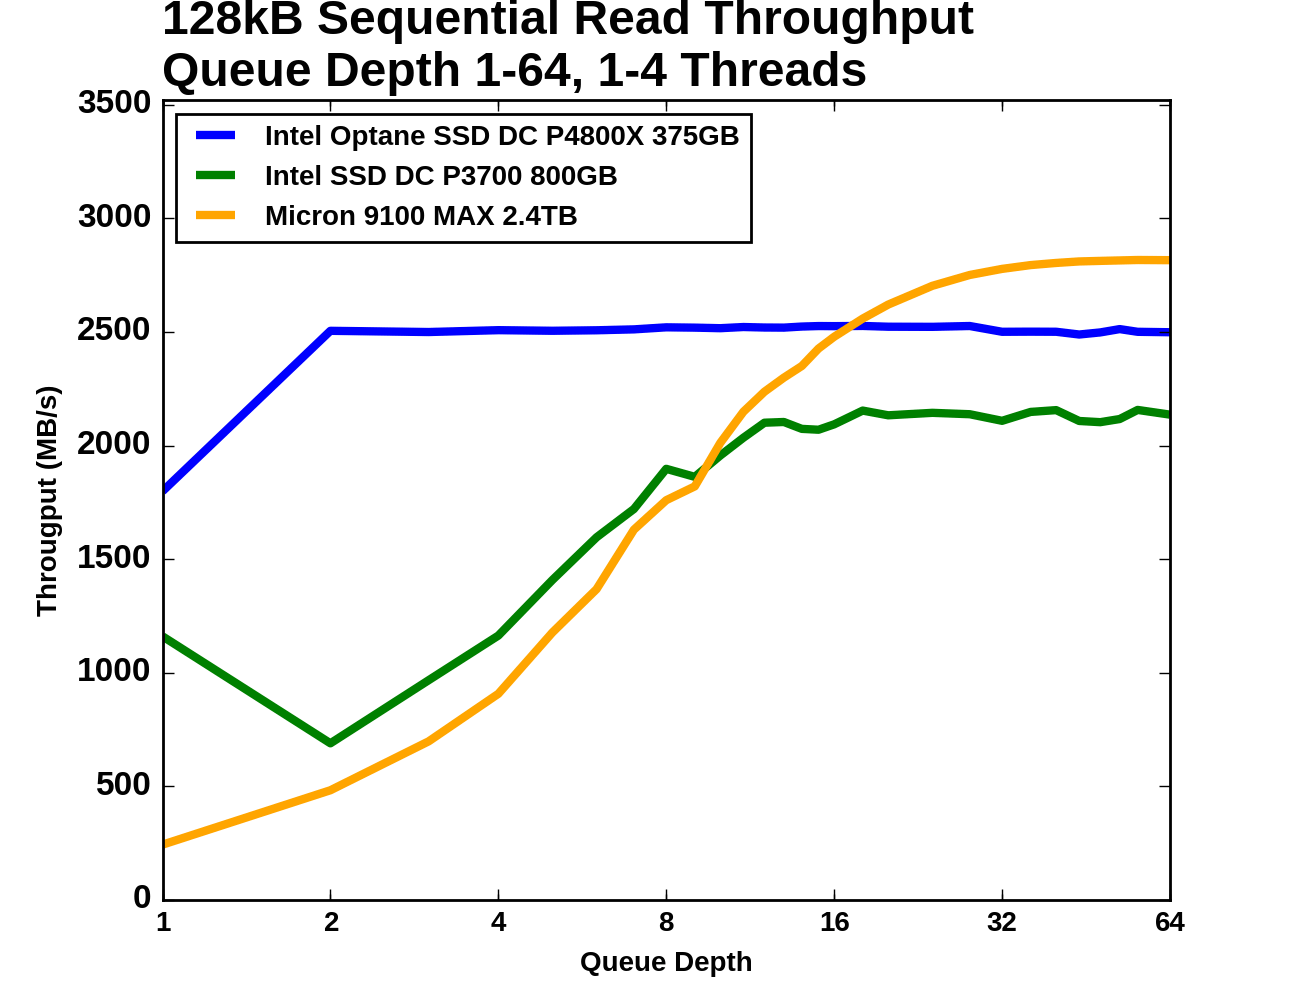
The Intel Optane SSD DC P4800X starts this test at 1.8GB/s for QD1, and delivers 2.5GB/s at all higher queue depths. The Intel P3700 performs significantly worse when a second QD1 thread is introduced, but by the time there are four threads reading from the drive the total throughput has recovered. The Intel P3700 saturates a little past QD8, which is where the Micron 9100 passes it. The Micron 9100 then goes on to surpass the Optane SSD's throughput above QD16, but it too has saturated by QD64.
 |
|||||||||
| Mean | Median | 99th Percentile | 99.999th Percentile | ||||||
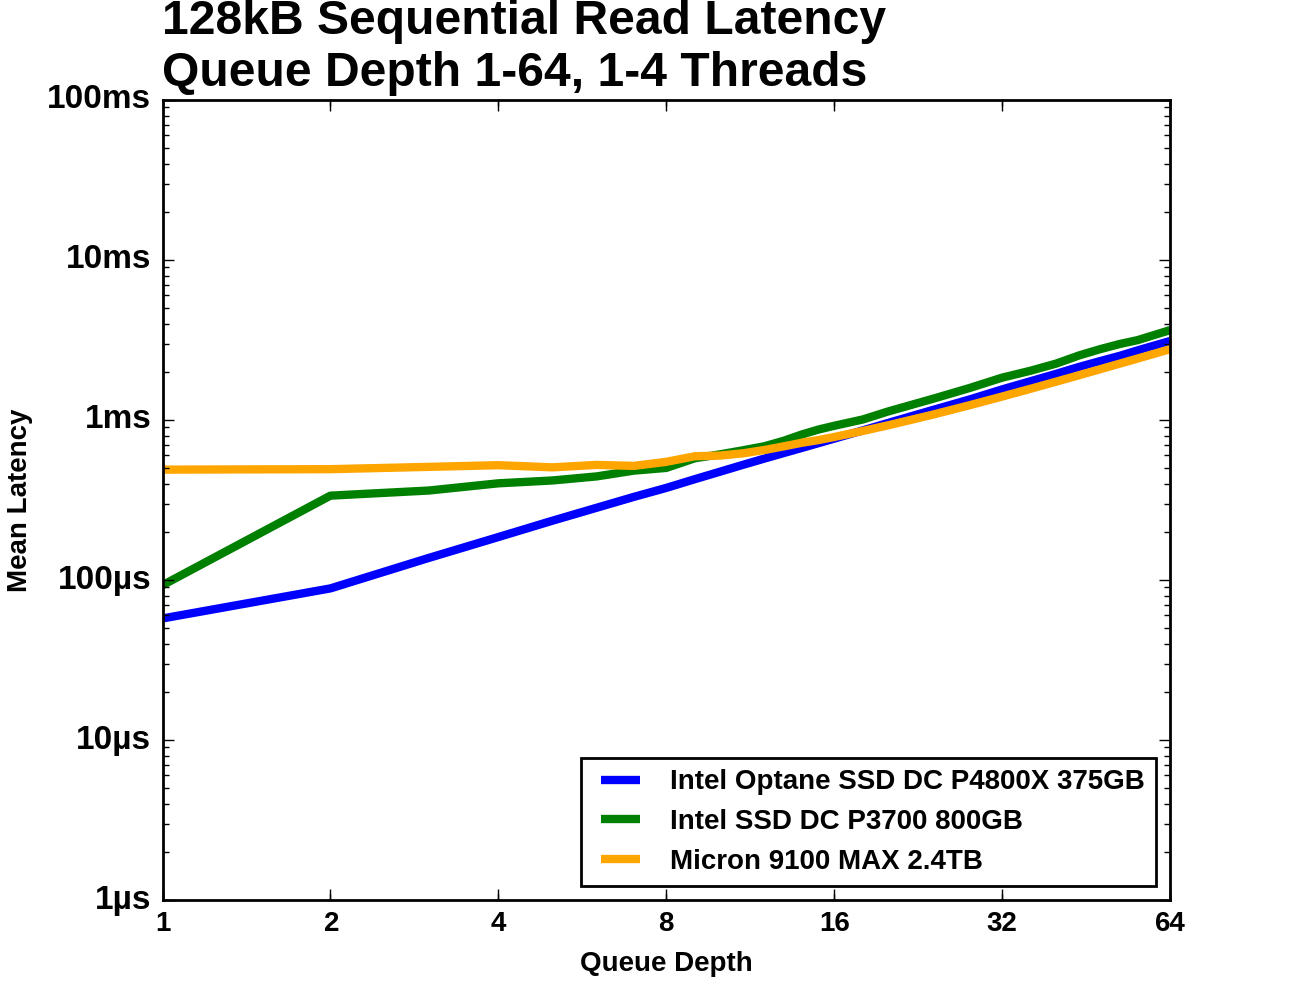
The Optane SSD's latency increases modestly from QD1 to QD2, and then unavoidably increases linearly with queue depth due to the drive being saturated and unable to offer any better throughput. The Micron 9100 starts out with almost ten times the average latency, but is able to hold that mostly constant as it picks up most of its throughput. Once the 9100 passes the Optane SSD in throughput it is delivering slightly better average latency, but substantially higher 99th and 99.999th percentile latencies. The Intel P3700's 99.999th percentile latency is the worst of the three across almost all queue depths, and its 99th percentile latency is only better than the Micron 9100's during the early portions of the test.
Sequential Write
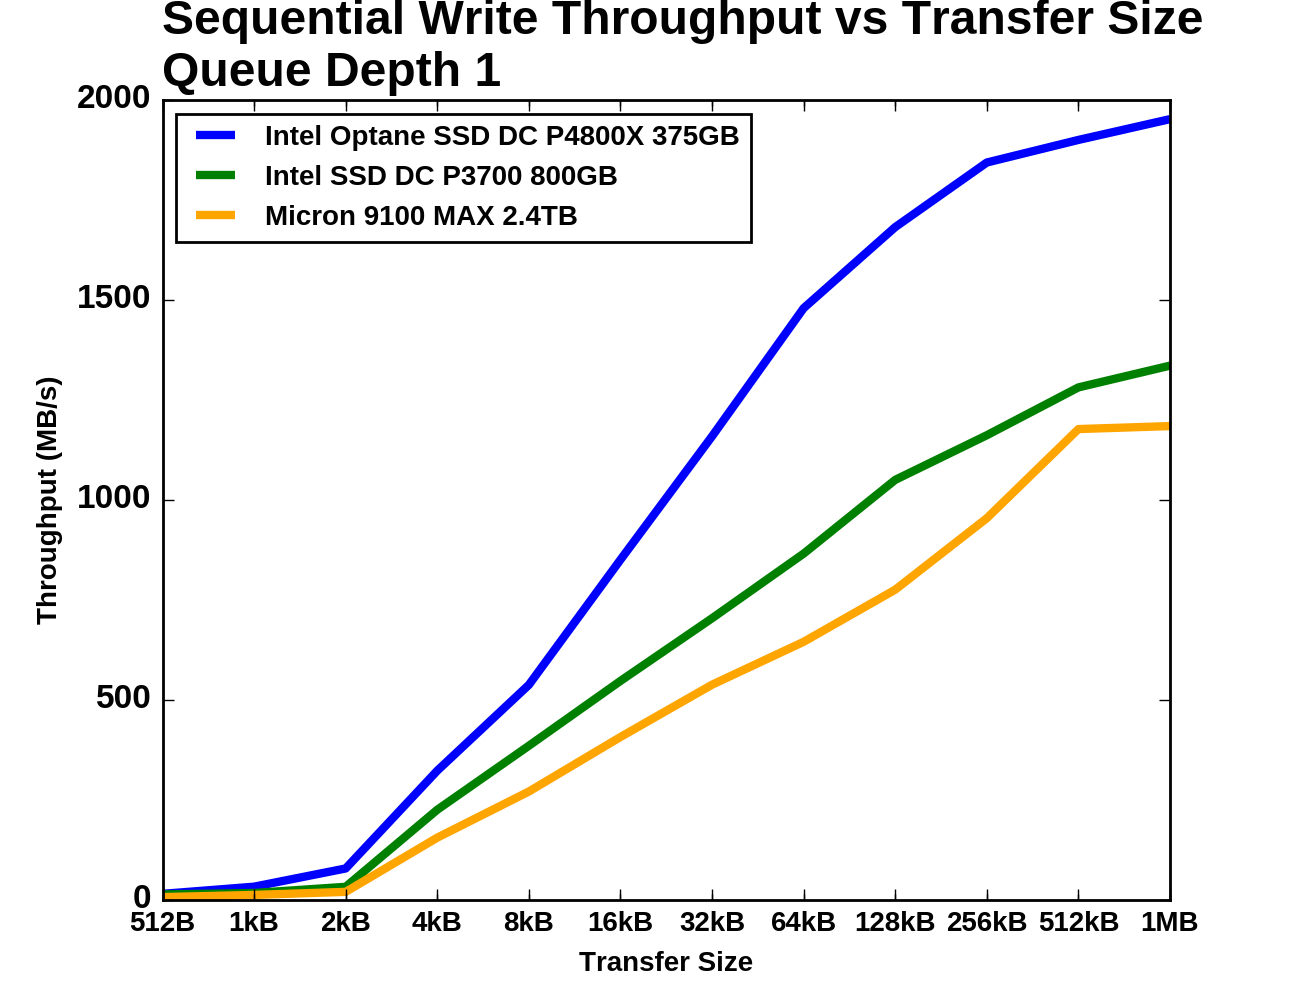
The sequential write tests are structured identically to the sequential read tests save for the direction the data is flowing. The sequential write performance of different transfer sizes is conducted with a single thread operating at queue depth 1. For testing a range of queue depths, a 128kB transfer size is used and up to four worker threads are used, each writing sequentially but to different portions of the drive. Each sub-test (transfer size or queue depth) is run for four minutes and the performance statistics ignore the first minute.
 |
|||||||||
| Vertical Axis scale: | Linear | Logarithmic | |||||||
As with random writes, sequential write performance doesn't begin to take off until transfer sizes reach 4kB. Below that size, all three SSDs offer dramatically lower throughput, with the Optane SSD narrowly ahead of the Intel P3700. The Optane SSD shows the steepest growth as transfer size increases, but it and the Intel P3700 begin to show diminishing returns beyond 64kB. The Optane SSD almost reaches 2GB/s by the end of the test while the Intel P3700 and the Micron 9100 reach around 1.2-1.3GB/s.
Queue Depth > 1
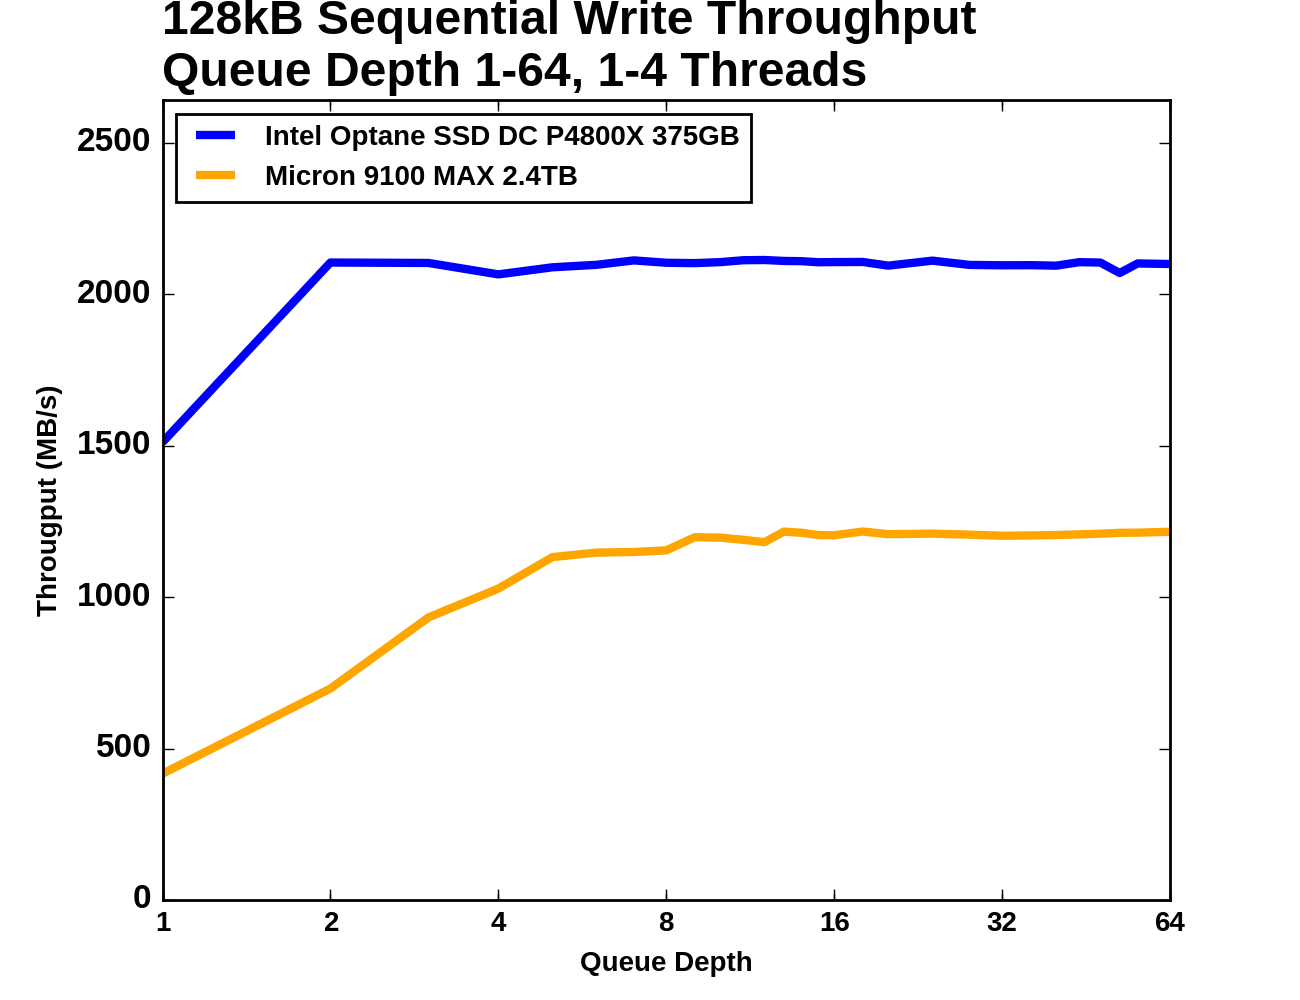
When testing sequential writes at varying queue depths, the Intel SSD DC P3700's performance was highly erratic. We did not have sufficient time to determine what was going wrong, so its results have been excluded from the graphs and analysis below.
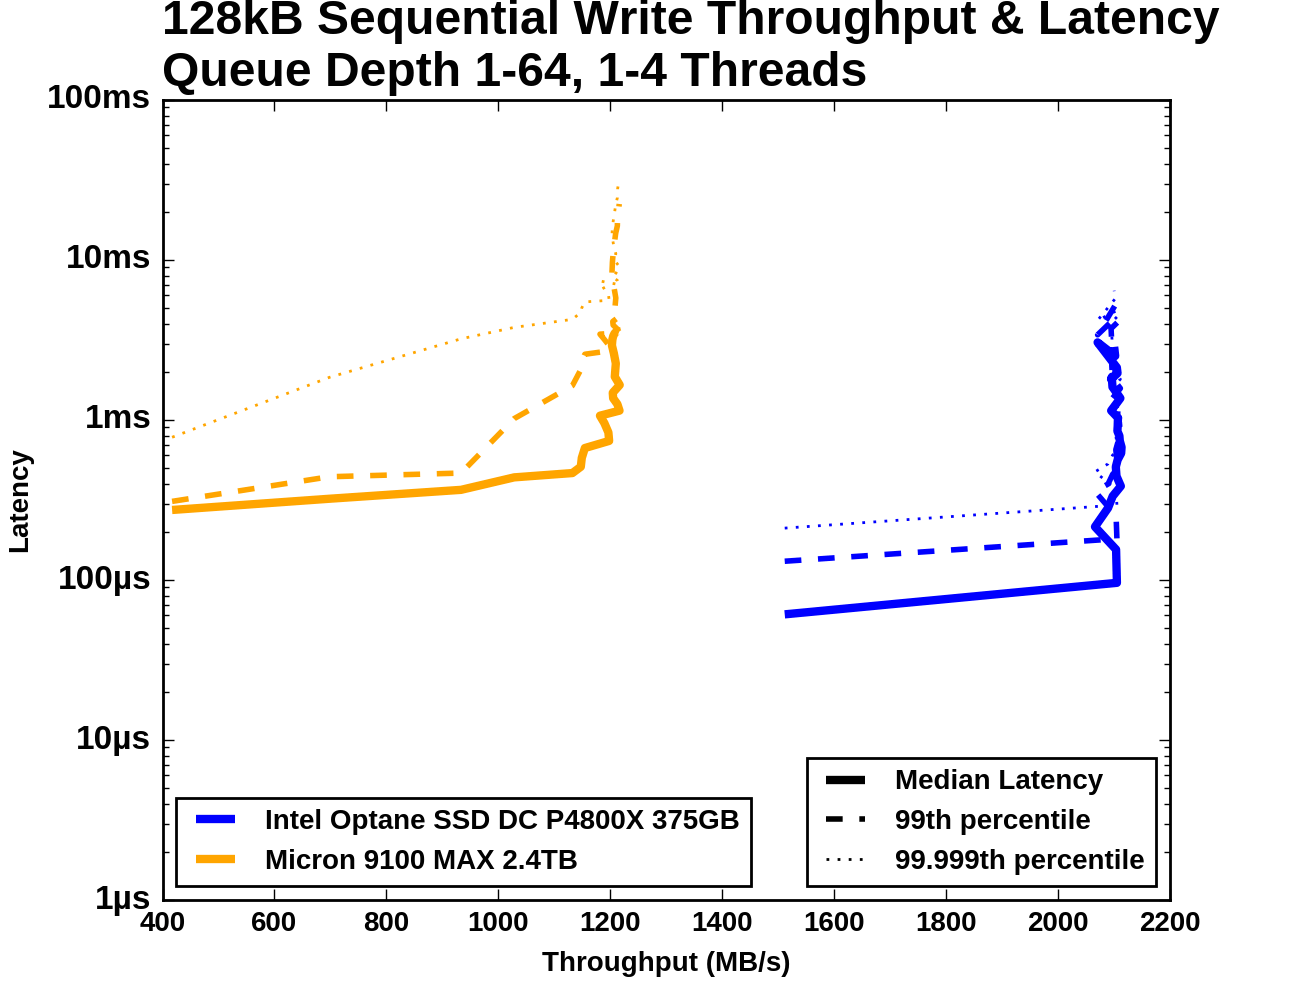
The Optane SSD DC P4800X delivers better sequential write throughput at every queue depth than the Micron 9100 can deliver at any queue depth. The Optane SSD's latency increases only slightly as it reaches saturation while the Micron 9100's 99th percentile latency begins to climb steeply well before that drive reaches its maximum throughput. The Micron 9100's 99.999th percentile latency also grows substantially as throughput increases, but its growth is more evenly spread across the range of queue depths.
 |
|||||||||
| Vertical Axis units: | IOPS | MB/s | |||||||
The Optane SSD reaches its maximum throughput at QD2 and maintains it as more threads and higher queue depths are introduced. The Micron 9100 only provides a little over half of the throughput and requires a queue depth of around 6-8 to reach that performance.
 |
|||||||||
| Mean | Median | 99th Percentile | 99.999th Percentile | ||||||
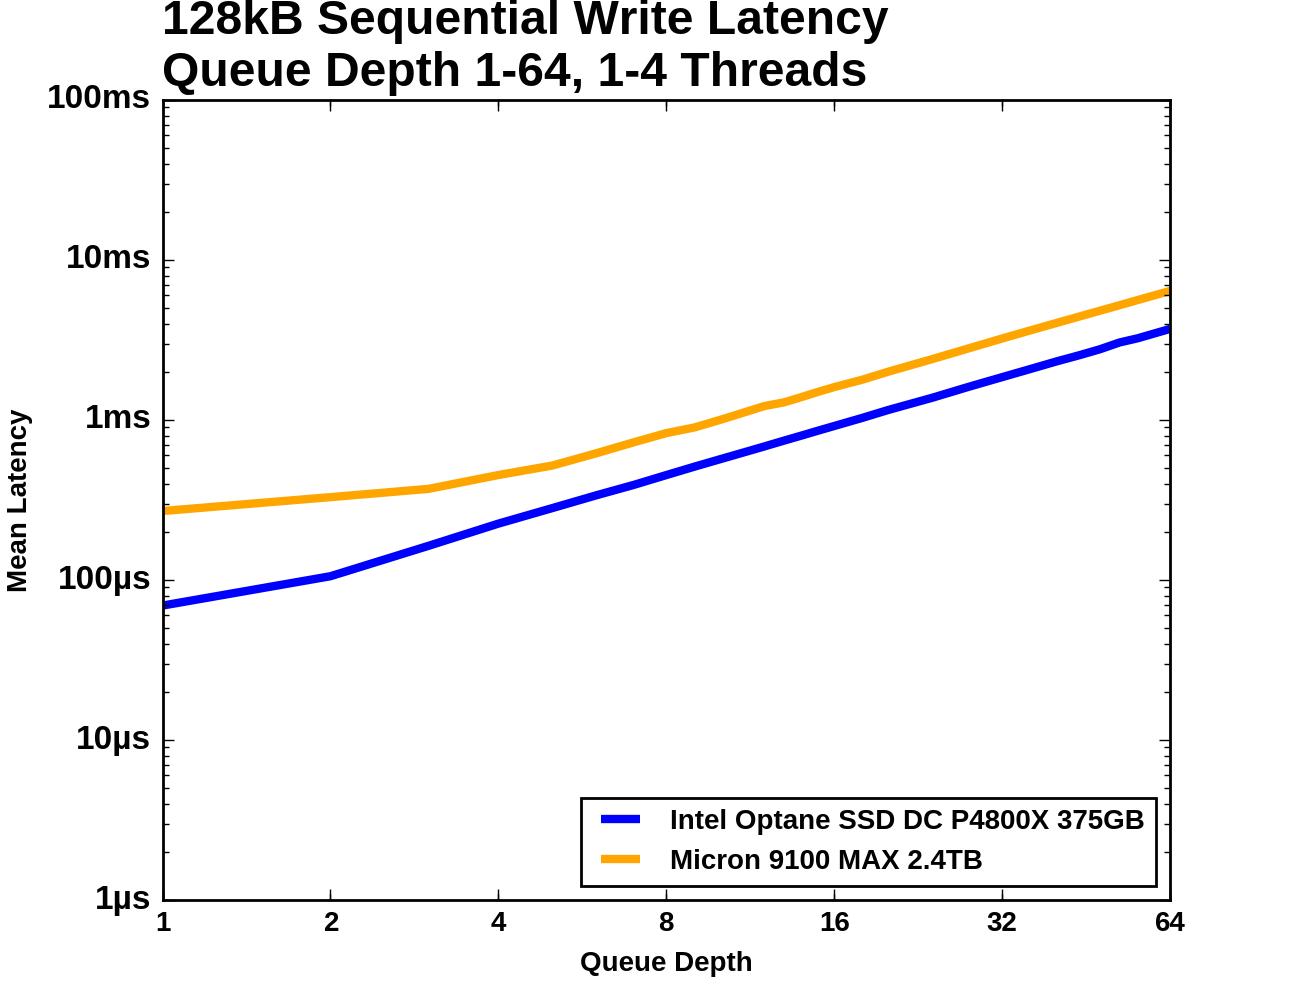
The Micron 9100's 99th percentile latency starts out around twice that of the Optane SSD, but at QD3 it increases sharply as the drive approaches its maximum throughput until it is an order of magnitude higher than the Optane SSD. The 99.999th percentile latencies of the two drives are separated by a wide margin throughout the test.


117 Comments
View All Comments
ddriver - Friday, April 21, 2017 - link
Then those reviews would show minuscule benefit of nvme and hypetane over a regular old ssd.DrunkenDonkey - Friday, April 21, 2017 - link
NVME yes, will show up that when you run that game on 960 pro it will take exactly same amount (-~1 sec) compared to old sata ssd. Octane however will show some 8 times faster and it will stick totally awesome in the graph. If you don't know what to look for, octane is not impressive and some new nvme ssd is actually very good compared to the old, both are untrue.ianmills - Thursday, April 20, 2017 - link
Loving how the "vertical axis units" were added after the graph for clarity. Great attention to detail Billy!serendip - Thursday, April 20, 2017 - link
How about power consumption? Could we start seeing similar hardware in tablets and phones in say, 5 years' time? We will still need DRAM for speed and low power consumption. XPoint would then make for a great system and caching drive, with slower and cheaper NAND being used for media storage, like how SSD + HDD setups are used now.Ian Cutress - Friday, April 21, 2017 - link
Literally the last two sentences in the review (and mentioned at other times):"Since our testing was remote, we have not yet even had the chance to look under the drives's heatsink, or measure the power efficiency of the Optane SSD and compare it against other SSDs. We are awaiting an opportunity to get a drive in hand, and expect some of the secrets under the hood to be exposed in due course as drives filter through the ecosystem."
random2 - Thursday, April 20, 2017 - link
"so it is interesting to see where Intel is going to lay down its line in the sand."Mixed metaphor; "lay down your cards" or "draw a line in the sand"
iwod - Friday, April 21, 2017 - link
What I really want to see, ( Not sure if Intel allows them to )Optane to put through all the test of SSD Bench. ( For Reference Only, and we would know how QD1 affect the benchmarks )
And Power Consumption.
ddriver - Friday, April 21, 2017 - link
( Not sure if Intel allows them to )Most likely the review guidelines intel mandated for this are longer than the actual review ;)
Pork@III - Friday, April 21, 2017 - link
$1520 for only 375GB...we not live in 2012. We live in 2017! If not to lie myself?tuxRoller - Friday, April 21, 2017 - link
"However it is worth noting that the Optane SSD only manages a passing score when the application uses asynchronous I/O APIs. Using simple synchronous write() system calls pushes the average latency up to 11-12µs"You mentioned "polling mode" for nvme was disabled, which is strange since that's been the default since ~4.5. Also, there are different types of polling modes, so, my hope is that the polling mode you are talking about is the new hybrid polling (introduced in 4.10, but possibly backported to your Ubuntu kernel). If not, then we know that xpoint is faster than the data you've gathered. Western Digital gave a talk at the recent Vault conference and discussed when it makes sense to poll vs reap.
Polling ends up being about 1.3x faster (average latency) than waiting for the irq (4.5us vs 6us). If you went with one of the userspace drivers, polling ends up twice as fast, but that would take much more work to benchmark.
So, considering that you're benchmarking the kinds of devices that this feature was designed for, and that we are interested in us latencies, what you've ended up benchmarking here was, to a greater extent than needed, the default kernel configuration.
http://events.linuxfoundation.org/sites/events/fil...