The Intel Optane SSD DC P4800X (375GB) Review: Testing 3D XPoint Performance
by Billy Tallis on April 20, 2017 12:00 PM ESTChecking Intel's Numbers
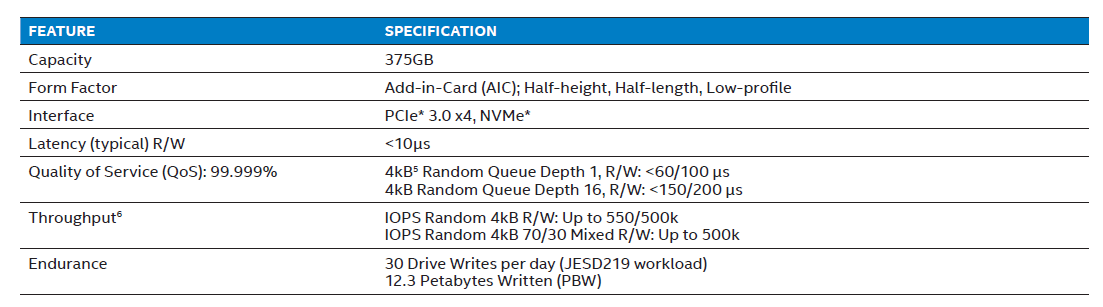
The product brief for the Optane SSD DC P4800X provides a limited set of performance specifications, entirely omitting any standards for sequential throughput. Some latency and throughput targets are provided for 4kB random reads, writes, and a 70/30 mix of reads and writes.
This section has our results for how the Optane SSD measures up to Intel's advertised specifications and how the flash SSDs fare on the same tests. The rest of this review provides deeper analysis of how these drives perform across a range of queue depths, transfer sizes, and read/write mixes.
| 4kB Random Read at a Queue Depth of 1 (QD1) | |||||||
| Drive | Throughput | Latency (µs) | |||||
| MB/s | IOPS | Mean | Median | 99th | 99.999th | ||
| Intel Optane SSD DC P4800X 375GB | 413.0 | 108.3k | 8.9 | 9 | 10 | 37 | |
| Intel SSD DC P3700 800GB | 48.7 | 12.8k | 77.9 | 76 | 96 | 2768 | |
| Micron 9100 MAX 2.4TB | 35.3 | 9.2k | 107.7 | 104 | 117 | 306 | |
Intel's queue depth 1 specifications are expressed in terms of latency, and at a throughput specification at QD1 would be redundant. Intel specifies a "typical" latency of less than 10µs, and most QD1 random reads on the Optane SSD take 8 or 9µs; even the 99th percentile latency is still 10µs.
The 99.999th percentile target is less than 60µs, which the Optane SSD beats by a wide margin. Overall, the Optane SSD passes with ease. The flash SSDs are 8-12x slower on average, and the 99.999th percentile latency of the Intel P3700 is far worse, at around 75x slower.
| 4kB Random Read at a Queue Depth of 16 (QD16) | |||||||
| Drive | Throughput | Latency (µs) | |||||
| MB/s | IOPS | Mean | Median | 99th | 99.999th | ||
| Intel Optane SSD DC P4800X 375GB | 2231.0 | 584.8k | 25.5 | 25 | 41 | 81 | |
| Intel SSD DC P3700 800GB | 637.9 | 167.2k | 93.9 | 91 | 163 | 2320 | |
| Micron 9100 MAX 2.4TB | 517.5 | 135.7k | 116.2 | 114 | 205 | 1560 | |
Intel's QD16 random read result is 584.8k IOPS for throughput, which is above the official specification of 550k IOPS by a few percent. The 99.999th percentile latency scores 81µs, significantly under the target of less than 150µs. The flash SSDs are 3-5x slower on most metrics, but 20-30 times slower at the 99.999th percentile for latency.
| 4kB Random Write at a Queue Depth of 1 (QD1) | |||||||
| Drive | Throughput | Latency (µs) | |||||
| MB/s | IOPS | Mean | Median | 99th | 99.999th | ||
| Intel Optane SSD DC P4800X 375GB | 360.6 | 94.5k | 8.9 | 9 | 10 | 64 | |
| Intel SSD DC P3700 800GB | 350.6 | 91.9k | 9.2 | 9 | 18 | 81 | |
| Micron 9100 MAX 2.4TB | 160.9 | 42.2k | 22.2 | 22 | 24 | 76 | |
In the specifications, the QD1 random write specifications are 10µs on latency, while the 99.999th percentile for latency is relaxed from 60µs to 100µs. In our results, the QD1 random write throughput (360.6 MB/s) of the Optane SSD is a bit lower than the QD1 random read throughput (413.0 MB/s), but the latency is roughly the same (8.9µs mean, 10µs on 99th).
However it is worth noting that the Optane SSD only manages a passing score when the application uses asynchronous I/O APIs. Using simple synchronous write() system calls pushes the average latency up to 11-12µs.
Also, due to the capacitor-backed DRAM caches, the flash SSDs also handle QD1 random writes very well. The Intel P3700 also manages to keep latency mostly below 10µs, and all three drives have 99.999th percentile latency below Intel's 100µs standard for the Optane SSD.
| 4kB Random Write at a Queue Depth of 16 (QD16) | |||||||
| Drive | Throughput | Latency (µs) | |||||
| MB/s | IOPS | Mean | Median | 99th | 99.999th | ||
| Intel Optane SSD DC P4800X 375GB | 2122.5 | 556.4 | 27.0 | 23 | 65 | 147 | |
| Intel SSD DC P3700 800GB | 446.3 | 117.0 | 134.8 | 43 | 1336 | 9536 | |
| Micron 9100 MAX 2.4TB | 1144.4 | 300.0 | 51.6 | 34 | 620 | 3504 | |
The Optane SSD DC P4800X is specified for 500k random write IOPS using four threads to provide a total queue depth of 16. In our tests, the Optane SSD scored 556.4k IOPs, exceeding the specification by more than 11%. This equates to a random write throughput of more than 2GB/s.
The flash SSDs are more dependent on the parallelism benefits of higher capacities, and as a result can be slow at the same capacity. Hence in this case the 2.4TB Micron 9100 fares much better than the 800GB Intel P3700. The Micron 9100 hits its own specification right on the nose with 300k IOPS and the Intel P3700 comfortably exceeds its own 90k IOPS specification, although remaining the slowest of the three by far. The Optane SSD stays well below its 200µs limit for 99.999th percentile latency by scoring 147µs, while the flash SSDs have outliers of several milliseconds. Even at the 99th percentile the flash SSDs are 10-20x slower than Optane.
| 4kB Random Mixed 70/30 Read/Write Queue Depth 16 | |||||||
| Drive | Throughput | Latency (µs) | |||||
| MB/s | IOPS | Mean | Median | 99th | 99.999th | ||
| Intel Optane SSD DC P4800X 375GB | 1929.7 | 505.9 | 29.7 | 28 | 65 | 107 | |
| Intel SSD DC P3700 800GB | 519.9 | 136.3 | 115.5 | 79 | 1672 | 5536 | |
| Micron 9100 MAX 2.4TB | 518.0 | 135.8 | 116.0 | 105 | 1112 | 3152 | |
On a 70/30 read/write mix, the Optane SSD DC P4800X scores 505.9k IOPS, which beats the specification of 500k IOPS by 1%. Both of the flash SSDs deliver roughly the same throughput, a little over a quarter of the speed of the Optane SSD. Intel doesn't provide a latency specification for this workload, but the measurements unsurprisingly fall in between the random read and random write results. While low-end consumer SSDs sometimes perform dramatically worse on mixed workloads than on pure read or write workloads, none of these drives have that problem due to their market positioning and capabilities therein.


117 Comments
View All Comments
ddriver - Friday, April 21, 2017 - link
Then those reviews would show minuscule benefit of nvme and hypetane over a regular old ssd.DrunkenDonkey - Friday, April 21, 2017 - link
NVME yes, will show up that when you run that game on 960 pro it will take exactly same amount (-~1 sec) compared to old sata ssd. Octane however will show some 8 times faster and it will stick totally awesome in the graph. If you don't know what to look for, octane is not impressive and some new nvme ssd is actually very good compared to the old, both are untrue.ianmills - Thursday, April 20, 2017 - link
Loving how the "vertical axis units" were added after the graph for clarity. Great attention to detail Billy!serendip - Thursday, April 20, 2017 - link
How about power consumption? Could we start seeing similar hardware in tablets and phones in say, 5 years' time? We will still need DRAM for speed and low power consumption. XPoint would then make for a great system and caching drive, with slower and cheaper NAND being used for media storage, like how SSD + HDD setups are used now.Ian Cutress - Friday, April 21, 2017 - link
Literally the last two sentences in the review (and mentioned at other times):"Since our testing was remote, we have not yet even had the chance to look under the drives's heatsink, or measure the power efficiency of the Optane SSD and compare it against other SSDs. We are awaiting an opportunity to get a drive in hand, and expect some of the secrets under the hood to be exposed in due course as drives filter through the ecosystem."
random2 - Thursday, April 20, 2017 - link
"so it is interesting to see where Intel is going to lay down its line in the sand."Mixed metaphor; "lay down your cards" or "draw a line in the sand"
iwod - Friday, April 21, 2017 - link
What I really want to see, ( Not sure if Intel allows them to )Optane to put through all the test of SSD Bench. ( For Reference Only, and we would know how QD1 affect the benchmarks )
And Power Consumption.
ddriver - Friday, April 21, 2017 - link
( Not sure if Intel allows them to )Most likely the review guidelines intel mandated for this are longer than the actual review ;)
Pork@III - Friday, April 21, 2017 - link
$1520 for only 375GB...we not live in 2012. We live in 2017! If not to lie myself?tuxRoller - Friday, April 21, 2017 - link
"However it is worth noting that the Optane SSD only manages a passing score when the application uses asynchronous I/O APIs. Using simple synchronous write() system calls pushes the average latency up to 11-12µs"You mentioned "polling mode" for nvme was disabled, which is strange since that's been the default since ~4.5. Also, there are different types of polling modes, so, my hope is that the polling mode you are talking about is the new hybrid polling (introduced in 4.10, but possibly backported to your Ubuntu kernel). If not, then we know that xpoint is faster than the data you've gathered. Western Digital gave a talk at the recent Vault conference and discussed when it makes sense to poll vs reap.
Polling ends up being about 1.3x faster (average latency) than waiting for the irq (4.5us vs 6us). If you went with one of the userspace drivers, polling ends up twice as fast, but that would take much more work to benchmark.
So, considering that you're benchmarking the kinds of devices that this feature was designed for, and that we are interested in us latencies, what you've ended up benchmarking here was, to a greater extent than needed, the default kernel configuration.
http://events.linuxfoundation.org/sites/events/fil...