ASRock Beebox-S 7200U Kaby Lake UCFF PC Review
by Ganesh T S on February 7, 2017 8:00 AM ESTPerformance Metrics - I
The ASRock Beebox-S 7200U was evaluated using our standard test suite for low power desktops / industrial PCs. Not all benchmarks were processed on all the machines due to updates in our testing procedures. Therefore, the list of PCs in each graph might not be the same. In the first section, we will be looking at SYSmark 2014 SE, as well as some of the Futuremark benchmarks.
BAPCo SYSmark 2014 SE
BAPCo's SYSmark 2014 SE is an application-based benchmark that uses real-world applications to replay usage patterns of business users in the areas of office productivity, media creation and data/financial analysis. In addition, it also addresses the responsiveness aspect which deals with user experience as related to application and file launches, multi-tasking etc. Scores are meant to be compared against a reference desktop (the SYSmark 2014 SE calibration system in the graphs below). While the SYSmark 2014 benchmark used a Haswell-based desktop configuration, the SYSmark 2014 SE makes the move to a Lenovo ThinkCenter M800 (Intel Core i3-6100, 4GB RAM and a 256GB SATA SSD). The calibration system scores 1000 in each of the scenarios. A score of, say, 2000, would imply that the system under test is twice as fast as the reference system.
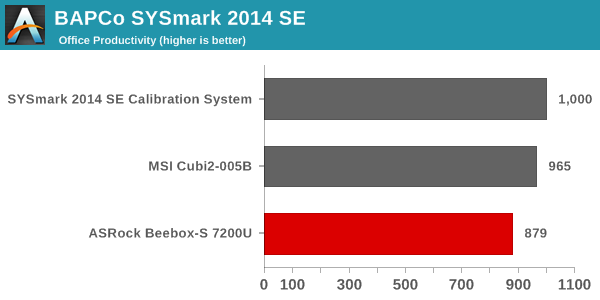
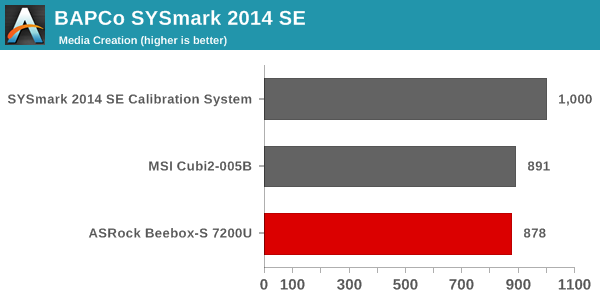
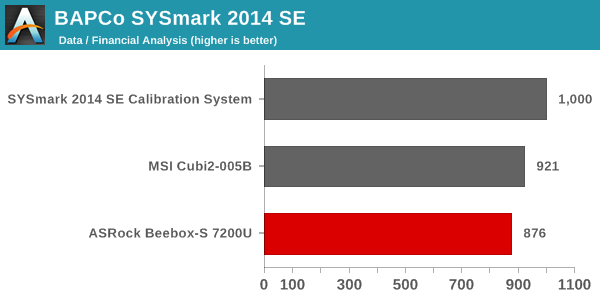
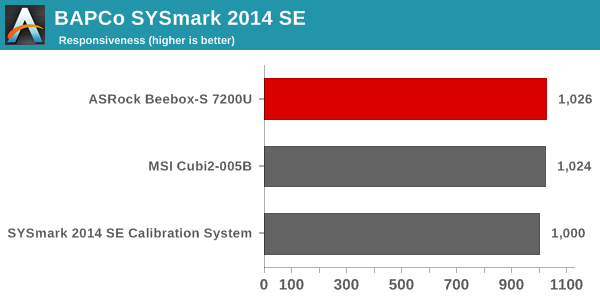
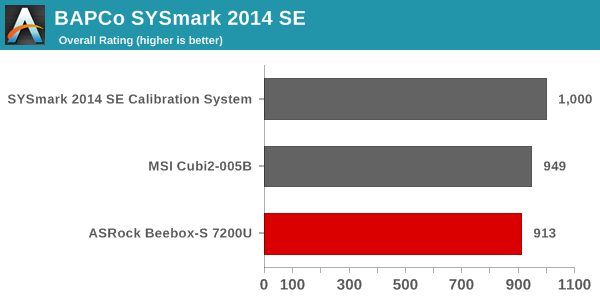
The scores tend to align with the capabilities of the CPU in the systems. The Core i5-7200U in the Beebox-S slightly lags the Core i7-7500U in the Cubi 2 in terms of both cache size and clock frequency. Obviously, neither of them can match the capabilities of the desktop-class CPU with higher TDP in the calibration system. The only scenario where the Beebox-S scores is responsiveness - likely due to the use of a NVMe SSD compared to the SATA SSD used in the Cubi 2.
SYSmark 2014 SE also adds energy measurement to the mix. A high score in the SYSmark benchmarks might be nice to have, but, potential customers also need to determine the balance between power consumption and the efficiency of the system. For example, in the average office scenario, it might not be worth purchasing a noisy and power-hungry PC just because it ends up with a 2000 score in the SYSmark 2014 SE benchmarks. In order to provide a balanced perspective, SYSmark 2014 SE also allows vendors and decision makers to track the energy consumption during each workload. In the graphs below, we find the total energy consumed by the PC under test for a single iteration of each SYSmark 2014 SE workload and how it compares against the calibration systems.
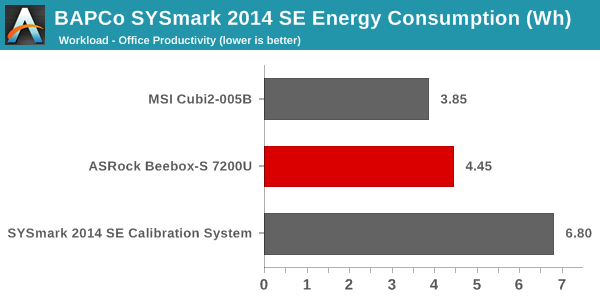
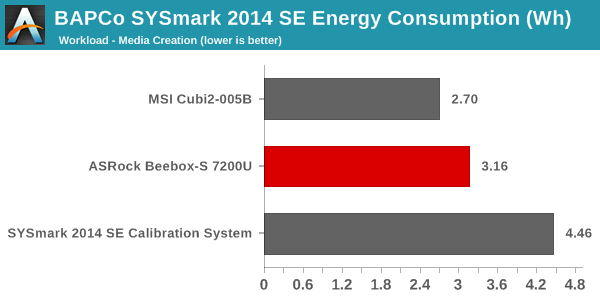
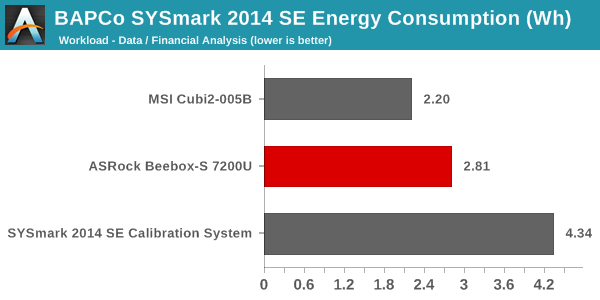

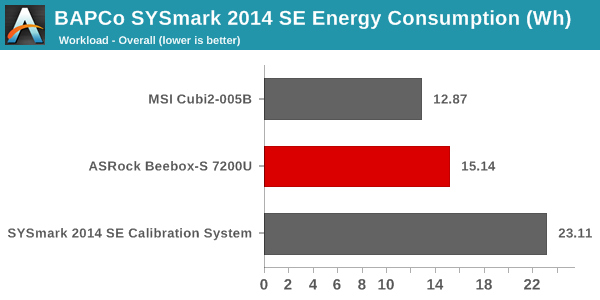
The comparative energy consumption numbers for each scenario are as expected. The Beebox-S is slightly more energy-intensive (despite the use of a CPU with the same TDP as the Cubi 2) likely due to the more power-hungry NVMe SSD in the assembled configuration.
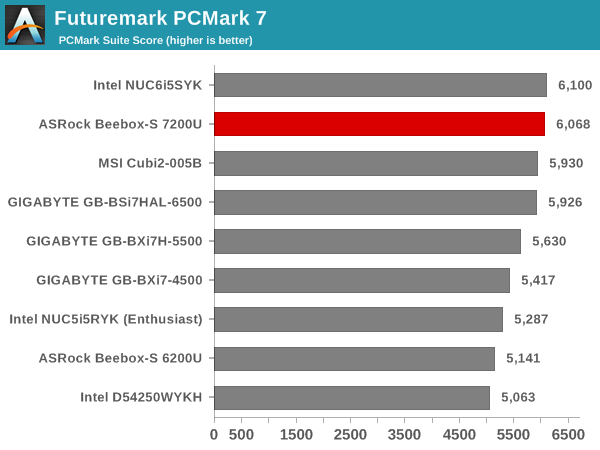
Futuremark PCMark 8
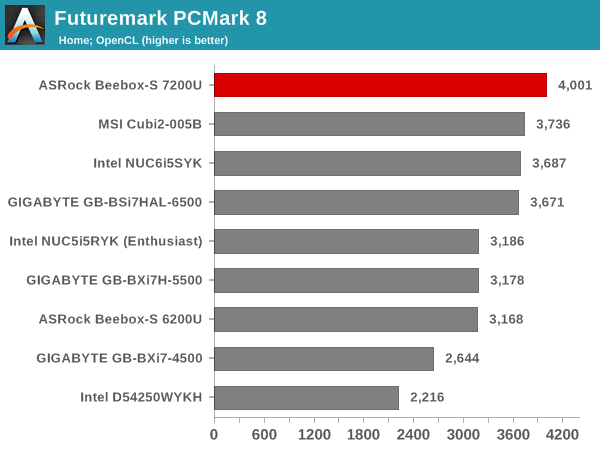
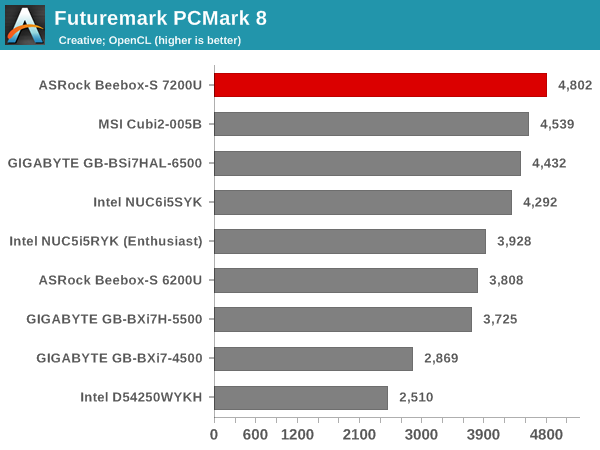
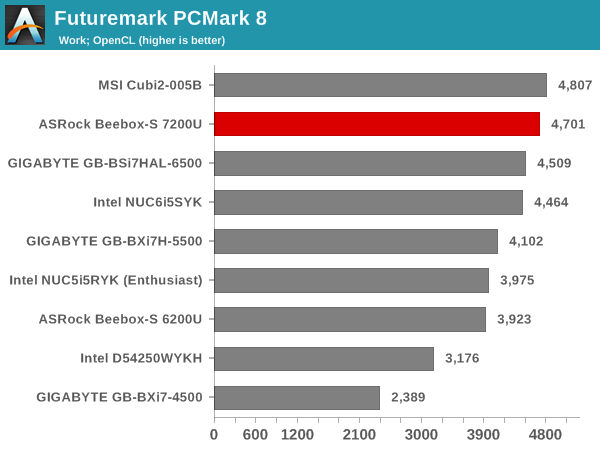
PCMark 8 provides various usage scenarios (home, creative and work) and offers ways to benchmark both baseline (CPU-only) as well as OpenCL accelerated (CPU + GPU) performance. We benchmarked select PCs for the OpenCL accelerated performance in all three usage scenarios. These scores are heavily influenced by the CPU in the system. The storage system also plays a significant role - which is why we see the Beebox-S 7200U and the MSI Cubi 2 trade positions in the top two spots depending on the benchmark. Interestingly, for these workloads, the 15W TDP Core i5-7200U is enough to go past the Skylake and Broadwell BRIX units that configure the CPU for a 28W TDP.
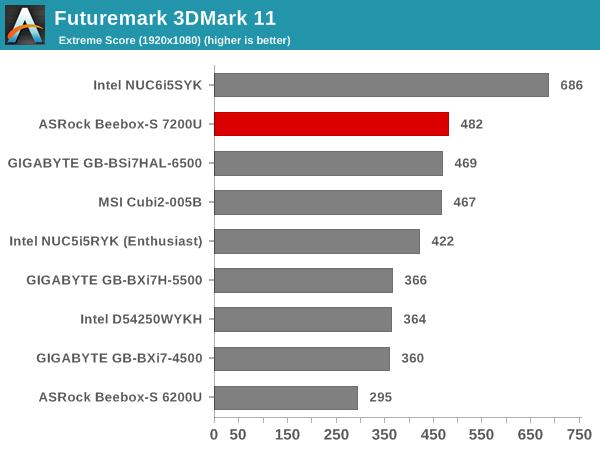
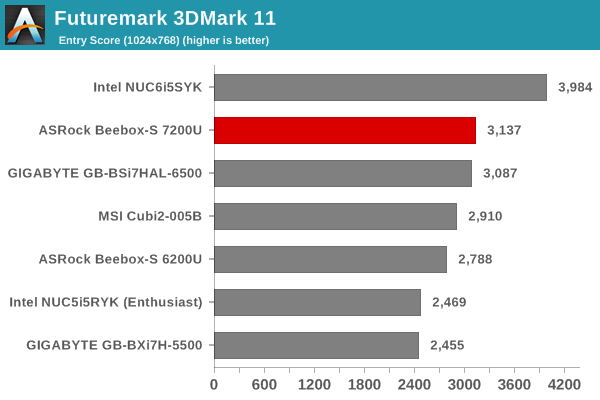
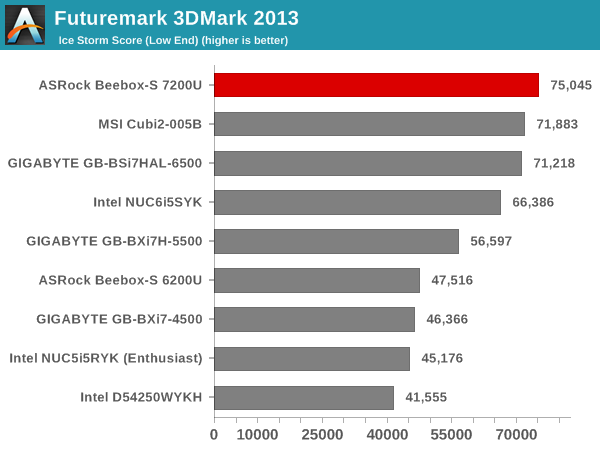
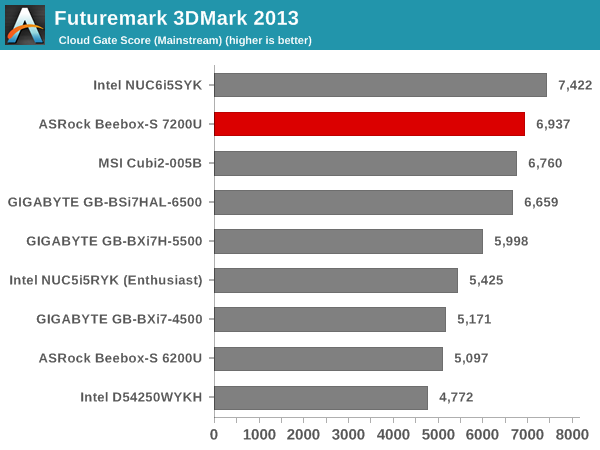
Miscellaneous Futuremark Benchmarks
The GPU-focused benchmarks perform similarly for both the Beebox-S 7200U and the Cubi 2. However, the Skylake Intel NUC with Iris Graphics manages to comfortably outscore the Intel HD Graphics 620 in the Beebox-S 7200U.
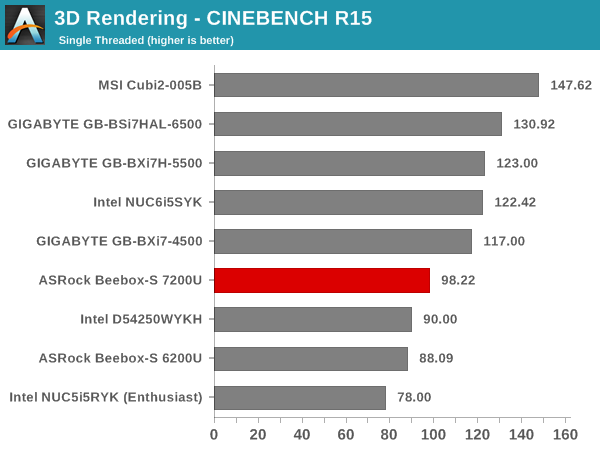
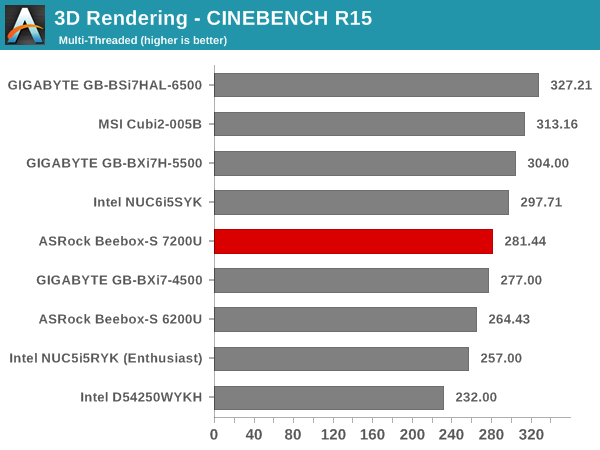
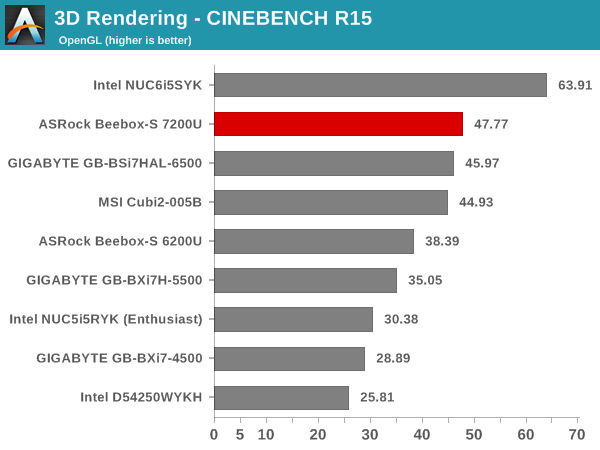
3D Rendering - CINEBENCH R15
We have moved on from R11.5 to R15 for 3D rendering evaluation. CINEBENCH R15 provides three benchmark modes - OpenGL, single threaded and multi-threaded. Evaluation of select PCs in all three modes provided us the following results. The OpenGL version numbers stack up similar to the Futuremark GPU benchmarks. The CPU versions are in line with expectations for a Core i5 U-series CPU.


33 Comments
View All Comments
Unton - Wednesday, March 15, 2017 - link
Could you advise me please,Im looking for NUC pc and choose two favorites:
This model and Zotac Zbox CI543
Does this model make some noize ?
It important because nettop will work 24 hours near my bed.
Zotac is fanless and I guest its absolutely quite, but has older processor and video.
Please help me to choose.
david123 - Wednesday, August 23, 2017 - link
Wow, it just look great. I believe it will rock and boost the system of http://192-168.bizadam22 - Friday, September 15, 2017 - link
Thanks for great review. Where can i find it at lower price ? http://www.192168.info