HiSilicon Kirin 960: A Closer Look at Performance and Power
by Matt Humrick on March 14, 2017 7:00 AM EST- Posted in
- Smartphones
- Mobile
- SoCs
- HiSilicon
- Cortex A73
- Kirin 960
CPU Power Consumption and Thermal Stability
CPU Power Consumption
Taking into account Kirin 950’s excellent performance and power efficiency and ARM’s claim that its A73 CPU consumes 20%-30% less power than Kirin 950’s A72 cores (same process, same frequency), it’s only logical to expect Kirin 960 to be the new efficiency king. Before earning that distinction, however, the 960’s A73 cores need to be physically implemented on silicon, and there are many factors—process and cell library selection, critical path optimizations, etc.—that ultimately determine processor efficiency.
To get a feel for CPU power consumption, I used a power virus with different thread counts to artificially load the cores. Using each device’s onboard fuel gauge, the active power was calculated by subtracting the device’s idle power, where it was doing nothing except displaying a static screen, from the total power for the given scenario. This method compensates for the power used by the display and other hardware components, but it’s not perfect; there’s no way to separate power consumed by certain necessary blocks, such as SoC interconnects, memory controllers, or DRAM, so the figures below include some additional overhead. This is especially true for the “1 Core” figures, where SoC interconnects and busses first ramp to higher frequencies.
| System Active Power: CPU Load + Per CPU Core Increments (mW) |
||||
| SoC | 1 Core | 2 Cores | 3 Cores | 4 Cores |
| Kirin 960 Cortex-A73 @2.362GHz |
1812 | 2845 | 4082 | 5312 |
| - | +1033 | +1237 | +1230 | |
| Kirin 955 Cortex-A72 @2.516GHz |
1755 | 2855 | 4040 | 5010 |
| - | +1100 | +1185 | +970 | |
| Kirin 950 Cortex-A72 @2.304GHz |
1347 | 2091 | 2844 | 3711 |
| - | +744 | +753 | +867 | |
| Exynos 7420 Cortex-A57 @2.1GHz |
1619 | 2969 | 4186 | 5486 |
| - | +1350 | +1217 | +1300 | |
| Snapdragon 810 v2.1 Cortex-A57 @1.958GHz |
2396 | 5144 | 8058 | not allowed |
| - | +2748 | +2914 | - | |
| Snapdragon 820 Kryo @2.150GHz / 1.594GHz |
2055 | 3330 | 4147 | 4735 |
| - | +1275 (2.150GHz) |
+817 (1.594GHz) |
+588 (1.594GHz) |
|
| Snapdragon 821 Kryo @2.342GHz / 1.594GHz |
1752 | 3137 | 3876 | 4794 |
| - | +1385 (2.342GHz) |
+739 (1.594GHz) |
+918 (1.594GHz) |
|
| Kirin 960 Cortex-A53 @1.844GHz |
654 | 885 | 1136 | 1435 |
| - | +231 | +251 | +299 | |
| Kirin 935 Cortex-A53 @2.2GHz |
1062 | 1769 | 2587 | 3311 |
| - | +707 | +818 | +724 | |
Surprisingly, the Kirin 960’s big CPU cores consume more power than the Kirin 950’s A72s—up to 43% more! This is a complete reversal from ARM’s goals for the A73, which were to reduce power consumption and improve sustained performance by reducing the thermal envelope. There’s no way for us to know for sure why the Kirin 960 uses more power at its highest operating point, but it’s likely a combination of implementation and process.
The Kirin 950 uses TSMC’s 16FF+ FinFET process, but HiSilicon switches to TSMC’s 16FFC FinFET process for the Kirin 960. The newer 16FFC process reduces manufacturing costs and die area to make it competitive in mid- to low-end markets, giving SoC vendors a migration path from 28nm. It also claims to reduce leakage and dynamic power by being able to run below 0.6V, making it suitable for wearable devices and IoT applications. Devices targeting price-sensitive markets, along with ultra low-power wearable devices, tend to run at lower frequencies, however, not 2.36GHz like Kirin 960. It’s possible that pushing the less performance-oriented 16FFC process, which targets lower voltages/frequencies, to higher frequencies that lay beyond its peak efficiency point may partially explain the higher power consumption relative to 16FF+.
The differences we’re seeing between Kirin 960 and 950 are unlikely to come from the difference in process alone, however. Implementation plays an even bigger role and allows a semiconductor company to get the most performance/power/area from a given process. HiSilicon did a great job with the Kirin 950 on 16FF+, which is why its efficiency is so good. This was always going to be a tough act to follow, and despite the similarities between 16FF+ and 16FFC from a design perspective, it’s still a different process with different requirements. It’s impossible to say how close HiSilicon came to the optimal solution, though, because we have no other examples of A73 on 16FFC for comparison.
The Kirin 960’s peak power figures are actually very close to what I measured for Kirin 955, the higher-clocked version of the Kirin 950. Its per-core increases are similar to the Exynos 7420’s lower-frequency A57 cores too, only about 50mW less.
The Kirin 960’s A73 cores consume less power than the two high-performance Kryo cores in Snapdragon 820/821, though, using up to 2.8W for two cores versus 3.1W to 3.3W for two Kryo cores. The quad-core Snapdragons’ remaining two cores run at a lower peak frequency and consume less power, nullifying Kirin 960’s power advantage when using 3-4 cores.
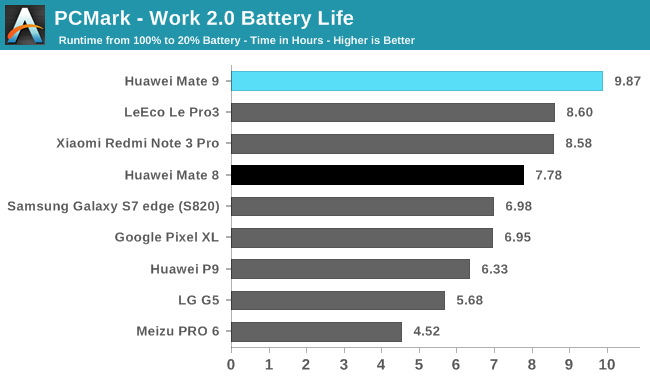
Despite the higher power consumption at the CPU’s highest operating points, Huawei’s Mate 9 actually does very well in our battery life tests. Its 13.25 hours of screen on time in our Wi-Fi Web Browsing test is a full 3 hours more than the Mate 8, and its nearly 10 hours in PCMark 2.0 is 27% better than the Mate 8. These real-world battery life results seem to be at odds with our CPU power measurements.
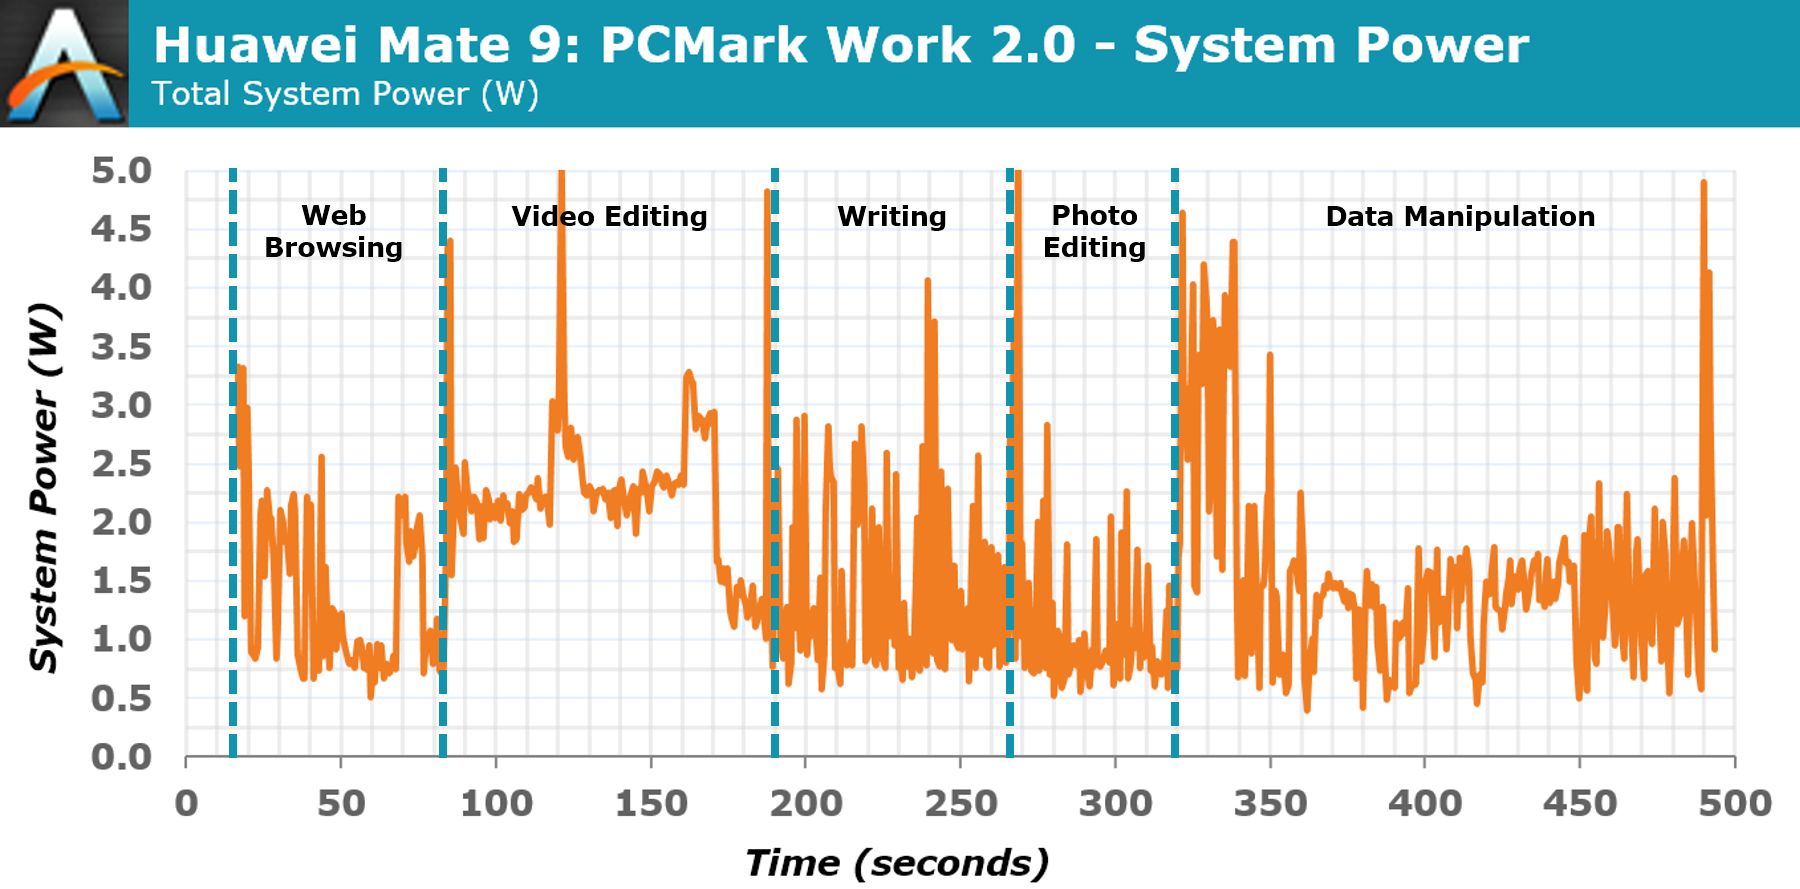
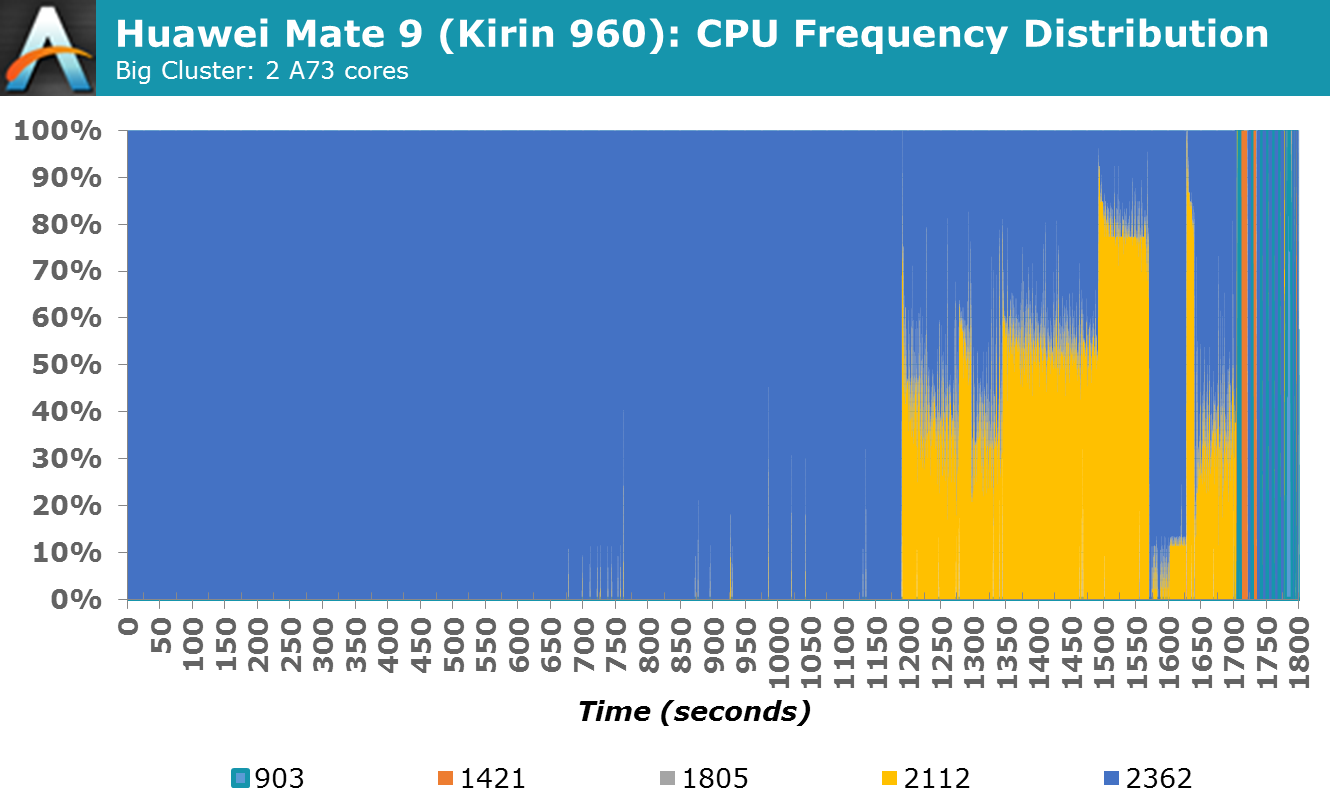
The graph above shows the Mate 9’s total system power consumption while running the PCMark 2.0 performance tests (all radios were turned off and the display’s brightness was calibrated to only 10 nits to better isolate the power consumption of the internal components). With the exception of some power spikes caused by increased activity while loading the next test, total power consumption remains below 3W and generally below 2W, well under the 5.3W we measured from Kirin 960’s four big cores.
I’m showing this graph because most of the apps we use everyday behave similarly to PCMark, where we see threads migrate from the little cores to the big cores and back again and DVFS working hard to match CPU frequency with load (actually, most apps would show significantly more CPU idle time, so PCMark is still a bit extreme in this regard). Many workloads will only use 1-2 big cores too, like we see here with PCMark. With only 2 cores at their max operating point, the Kirin 960 only consumes 754mW more power than Kirin 950 instead of 1601mW more when using 4 cores. So while CPU efficiency is certainly important, we need to frame it in terms of real-world workloads, and we also cannot forget the impact software (scheduler, CPUfreq, CPUidle) has on overall battery life.
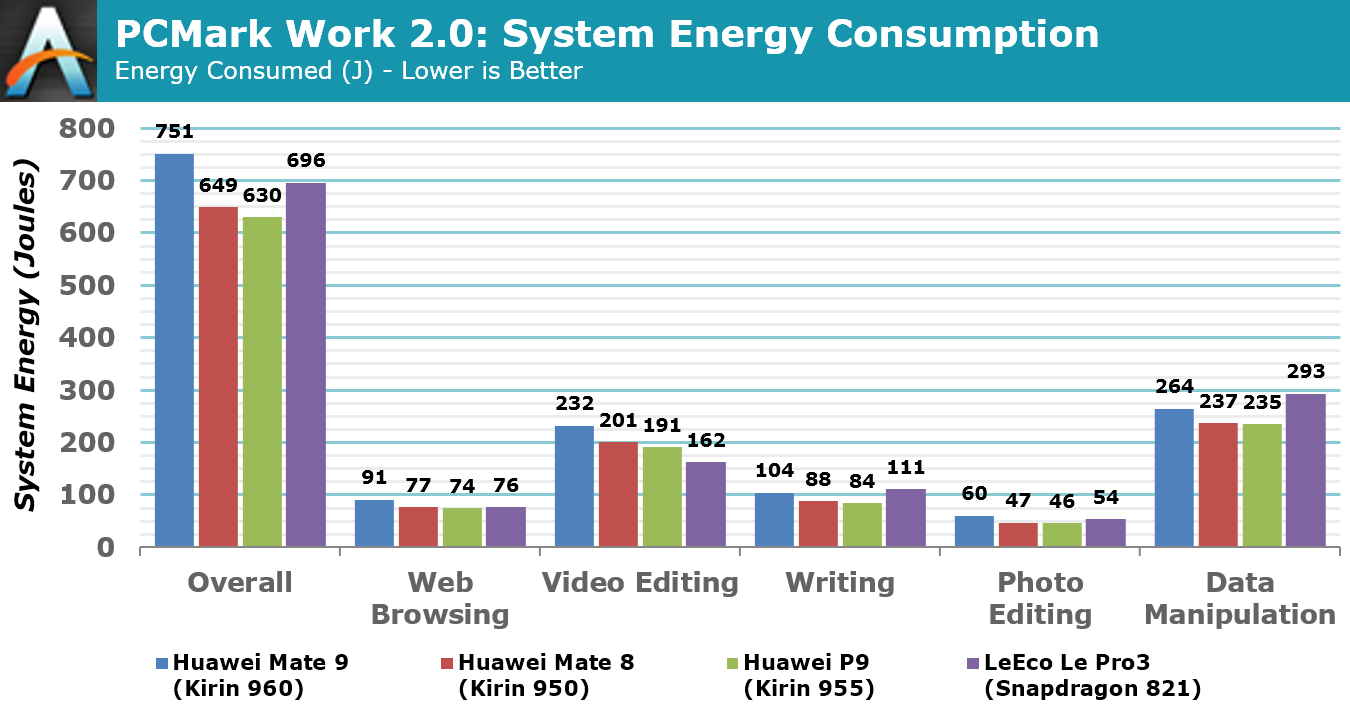
Looking at power alone can be misleading; a device may use more power than another, but if it completes the task in less time, it may actually use less energy, leading to longer battery life. For both of the graphs above, the phones’ radios were turned off and their displays calibrated to only 10 nits (the lowest common setting) to reduce the impact of different screen sizes and efficiencies from skewing the results.
In the first graph, which shows the total energy consumed by each phone when running the PCMark 2.0 performance tests, the Mate 9 consumes 16% more energy overall than the Mate 8 (despite my efforts to minimize display influence, the P9’s energy consumption is slightly lower than the Mate 8’s, which is likely because of its smaller screen). The Video and Photo Editing tests, which employ the GPU, show some of the biggest percent differences, but the Writing test, which makes frequent use of the CPU’s big cores, also shows a larger than average difference. The LeEco Le Pro3 and its Snapdragon 821 SoC actually consumes more energy than the Mate 9 in the Data Manipulation and Writing tests, where it has to use its 2 high-performance Kryo cores, but less in the Video and Photo Editing tests that use the GPU.
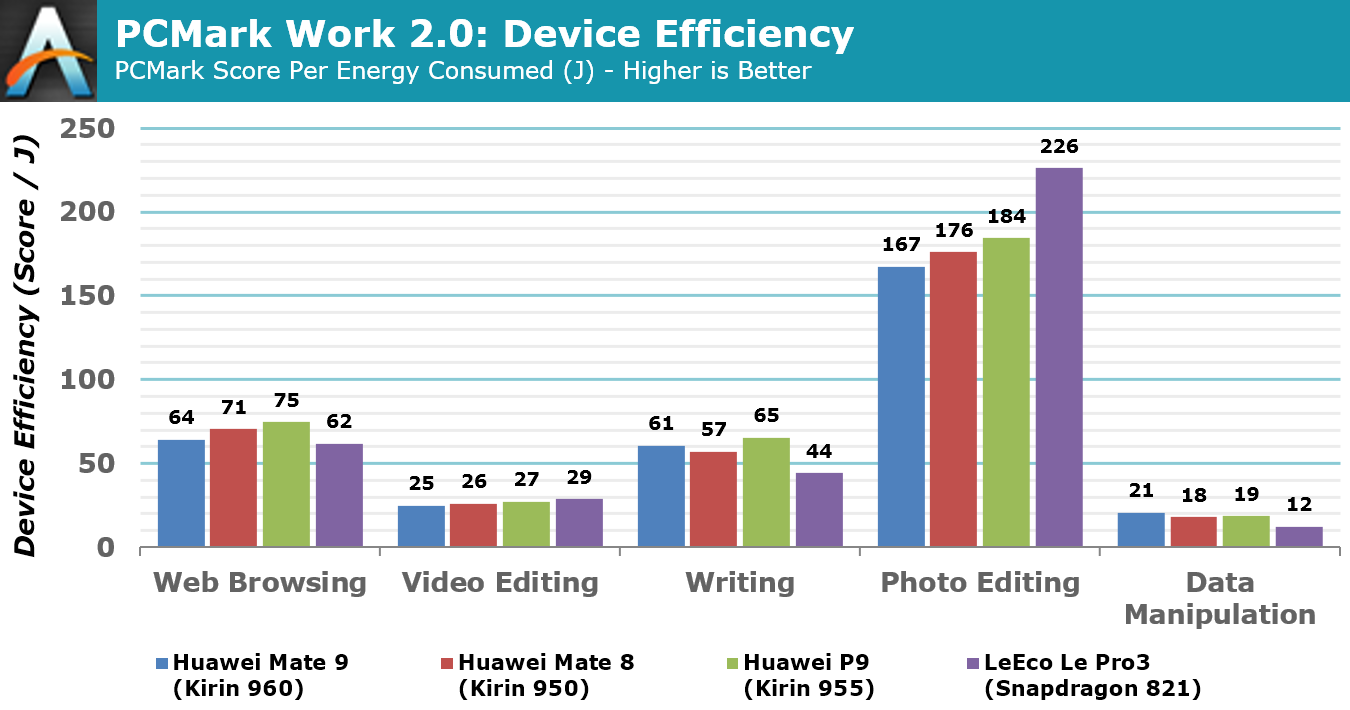
The second graph divides the PCMark score by the energy consumed to show efficiency. Because of the Mate 9’s better performance, it’s actually 7% more efficient than the Mate 8 in the Writing test and 17% more efficient in the Data Manipulation test. The Mate 9’s GPU efficiency is the worst of the group, judging by its scores in the Video and Photo Editing tests. In contrast, the Pro3’s Adreno 530 GPU posts the highest efficiency values in these tests.
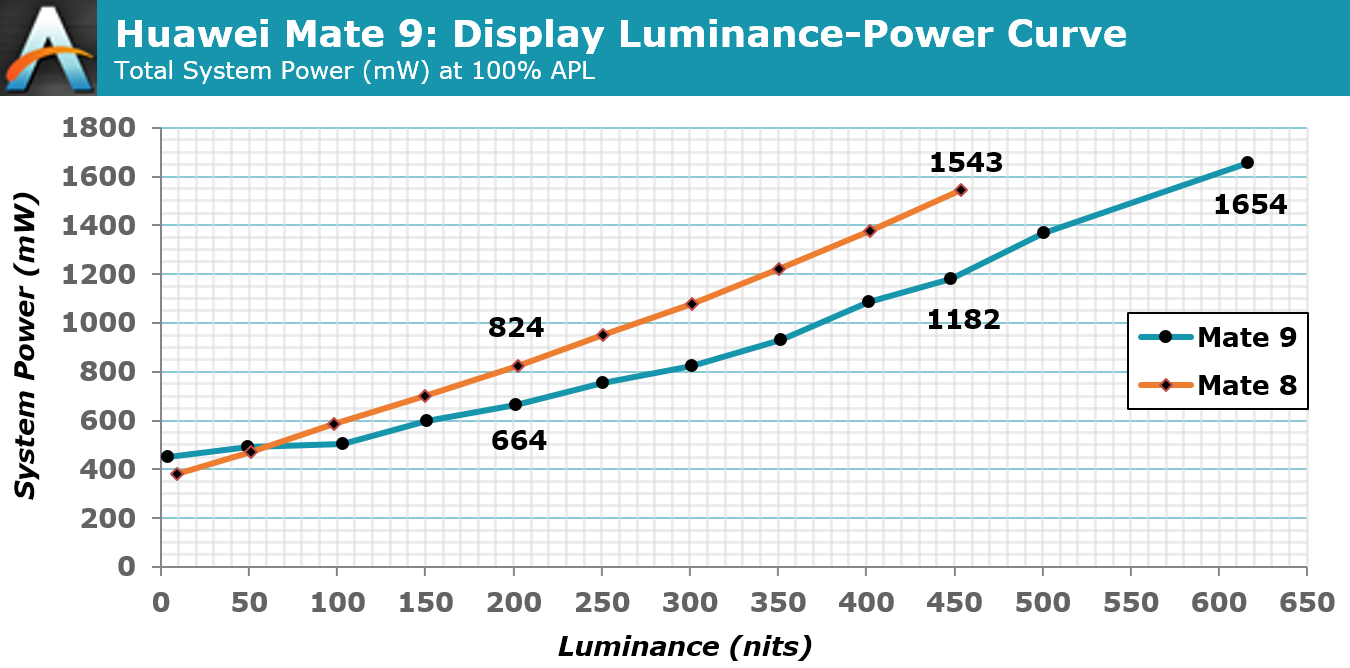
The Mate 9 lasts longer than the Mate 8 in the PCMark battery test despite its Kirin 960 SoC consuming more energy, so Huawei must have reduced energy consumption elsewhere to compensate. The display is the most obvious place to look, and the graph above clearly shows that the Mate 9’s display is more efficient. At 200 nits, the value we use for our battery tests, the Mate 9 shows an estimated 19% power reduction. In the time it takes to run PCMark, this translates to 82 J of energy, nearly erasing the 102 J difference between the Mate 9 and Mate 8. I suspect the difference in display power may actually be a little bigger, but I lack the equipment to make a more precise measurement. This still does not account for all of the Mate 9’s power savings, however, but a full accounting is beyond the scope of this article.
CPU Thermal Stability
Our CPU throttling test uses the same power virus we used above with two threads running on two of the big A73 CPU cores for a duration of about 30 minutes. The goal is to determine a device’s ability to sustain peak CPU performance without throttling and potentially reducing user experience. This is a product of CPU power consumption, the device’s ability to dissipate heat, and the device’s thermal safety limits.
The Mate 8 and its Kirin 950 are able to sustain peak performance with two A72 cores indefinitely, a remarkable feat. The Mate 9 does not fare as well because of Kirin 960’s elevated power use; however, it still manages to hold two of its A73 cores at peak frequency for 11.3 minutes and does not throttle enough to affect performance in a noticeable way for 20 minutes, which is still a very good result. I cannot think of any CPU-centric workloads for a phone that would load two big cores for anywhere near this long, so it’s safe to say that CPU throttling is not a problem for the Mate 9. It will be interesting to see if this holds true for Huawei’s smaller phones such as the P10, which will not be able to dissipate heat as readily as the big, aluminum Mate 9.


86 Comments
View All Comments
lilmoe - Tuesday, March 14, 2017 - link
I read things thoroughly before criticizing. You should do the same before jumping in to support an idiotic comment like fanofanand's. He's more interested in insulting people than finding the truth.These tests are the ones which aren't working. No one gets nearly as much battery life as they report. Nor are the performance gains anywhere near what benchmarks like geekbench are reporting. If something isn't working, one should really look for other means. That's how progress works.
You can't test a phone the same way you test a workstation. You just can't. NO ONE leaves their phone lying on a desk for hours waiting on it to finish compiling 500K lines of code, or rendering a one-hour 3D project or a 4K video file for their channel on Youtube. But they do spend a lot of time watching video on Youtube, browsing the web with 30 second pauses between each scroll, and uploading photos/videos to social media after applying filters. Where are these tests??? You know, the ones that actually MATTER for most people? You know, the ones that ST performance matters less for, etc, etc...
Anyway, I did suggest what I believe is a better, more realistic, method for testing. Hint, it's in the fifth paragraph of my original reply. But who cares right? We just want to know "which is the fastest", which method confirms our biases, regardless of the means of how such performance is achieved. Who cares about the truth.
People are stubborn. I get that. I'm stubborn too. But there's a limit at how stubborn people can be, and they need to be called out for it.
Meteor2 - Wednesday, March 15, 2017 - link
I'm with fanof and close on this one. Here we have a consistent battery of repeatable tests. They're not perfectly 'real-world' but they're not far off either; there's only so many things a CPU can do.I like this test suite (though I'd like to see GB/clock and SPi and GB/power calculated and graphed too). If you can propose a better one, do so.
close - Wednesday, March 15, 2017 - link
This isn't about supporting someone's comment, I was very clear which part I agree with: the one where you help come up with a practical implementation of your suggestion.Phone can and should be tested like normal desktops since the vast majority of them spend most of their time idling, just like phones. The next this is running Office like applications, normal browsing, and media consumption.
You're saying that "NO ONE leaves their phone lying on a desk for hours waiting on it to finish compiling 500K lines of code". But how many people would find even that relevant? How many people compile 500K lines of code regularly? Or render hours of 4K video? And I'm talking about percentage of the total.
Actually the ideal case for testing any device is multiple scenarios that would cover a more user types: from light browsing and a handful of phone calls to heavy gaming or media consumption. These all result in vastly different results as a SoC/phone might be optimized for sporadic light use or heavier use for example. So a phone that has best battery life and efficiency while gaming won't do so while browsing. So just like benchmarks, any result would only be valid for people who follow the test scenario closely in their daily routine.
But the point wasn't whether an actual "real world" type scenario is better, rather how exactly do you apply that real world testing into a sequence of steps that can be reproduced for every phone consistently? How do you make sure that all phones are tested "equally" with that scenario and that none has an unfair (dis)advantage from the testing methodology? Like Snapchat or FB being busier one day and burning through the battery faster.
Just like the other guy was more interested in insults (according to you), you seem more interested in cheap sarcasm than in actually providing an answer. I asked for a clear methodology. You basically said that "it would be great if we had world peace and end hunger". Great for a beauty pageant, not so great when you were asked for a testing methodology. A one liner is not enough for this. A methodology is you describing exactly how you proceed with testing the phones, step by step, while guaranteeing reproducibility and fairness. Also please explain how opening a browser, FB, or Snapchat is relevant for people who play games 2 hours per day, watch movies or actually use the phone as a phone and talk to other people.
You're making this more difficult than it should be. You look like you had plenty of time to think about this. I hald half a day and already I came up with a better proposal then yours (multiple scenarios vs. single scenario). And of course, I will also leave out the exact methodology part because this is a comment competition not an actual search for solutions.
lilmoe - Wednesday, March 15, 2017 - link
I like people who actually spend some time to reply. But, again, I'd appreciate it more if you read my comments more carefully. I told you that the answer you seek is in my first reply, in the fifth paragraph. If you believe I have "plenty of time" just for "cheap sarcasm", then sure we can end it here. If you don't, then go on reading.I actually like this website. That's why I go out of my way to provide constructive criticism. If I was simply here for trolling, my comments won't be nearly as long.
SoCs don't live in a vacuum, they come bundled with other hardware and software (Screen, radios, OS/Kernel), optimized to work on the device being reviewed. In the smartphone world, you can't come to a concrete conclusion on the absolute efficiency of a certain SoC based on one device, because many devices with the same SoC can be configured to run that SoC differently. This isn't like benchmarking a Windows PC, where the kernel and governer are fixed across hardware, and screens are interchangeable.
Authors keep acknowledging this fact, yet do very little to go about testing these devices using other means. It's making it hard for everyone to understand the actual performance of said devices, or the real bang for the buck they provide. I think we can agree on that.
"You're making this more difficult than it should be"
No, really, I'm not. You are. When someone is suggesting something a bit different, but everyone is slamming them for the sake of "convention" and "familiarity", then how are we supposed to make progress?
I'm NOT saying that one should throw benchmarks out. But I do believe that benchmarks should stay in meaningful context. They give you a rough idea about the snappiness of a ultra-mobile device, since it's been proven time after time that the absolute performance of these processors is ONLY needed for VERY short bursts, unlike workstations. However, they DO NOT give you anywhere near a valid representation of average power draw and device battery life, and neither do scripts written to run synthetic/artificial workloads. Period.
This is my point. I believe the best way to measure a specific configuration is by first specifying the performance point a particular OEM is targeting, and then measuring the power draw of that target. This comes in as the average clocks the CPU/GPU at various workloads, from gaming, browsing, playing video, to social media. It doesn't matter how "busy" these content providers are at specific times, the average clocks will be the same regardless because the workload IS the same.
I have reason to believe that OEMs are optimizing their kernels/governers for each app alone. Just like they did with benchmarks several years ago, where they ramp clocks up when they detect a benchmark running. Except, they're doing it the right way now, and optmizing specific apps to run differently on the device to provide the user with the best experience.
When you've figured out the average the OEM is targetting for various workloads, you'd certainly know how much power it's drawing, and how much battery life to expect AFTER you've already isolated other factors, such as the screen and radios. It also makes for a really nice read, as a bonus (hence, "worth investigating").
This review leaves an important question unanswered about this SoC's design (I'm really interested to know the answer); did HiSilicon cheap out on the fab process to make more money and leach on the success of its predecessor? Or did they do that with good intentions to optimize their SoC further for modern, real world workloads that currently used benchmarks are not detecting? I simply provided a suggest to answer that question. Does that warrant the language in his, or your reply? Hence my sarcasm.
fanofanand - Tuesday, March 14, 2017 - link
It's exciting to see the envelope being pushed, and though these are some interesting results I like that they are pushing forward and not with a decacore. The G71 looks like a botched implementation if it's guzzling power that heavily, I wonder if some firmware/software could fix that? A73 still looks awesome, and I can't wait to see a better implementation!psychobriggsy - Tuesday, March 14, 2017 - link
TBH the issue with the GPU appears to be down to the clock speed it is configured with.It's clear that this is set for benchmarking purposes, and it's good that this has been caught.
Once the GPU settles down into a more optimal 533MHz configuration, power consumption goes down significantly. Sadly it looks like there are four clock settings for the GPU, and they've wasted three of them on stupid high clocks. A better setup looks to be 800MHz, 666MHz, 533MHz and a power saving 400MHz that most Android games would still find overkill.
Meteor2 - Wednesday, March 15, 2017 - link
Performance/Watt is frankly rubbish whatever the clock speed. Clearly they ran out of time or money to implement Bifrost properly.fanofanand - Wednesday, March 15, 2017 - link
That's what I'm thinking, I read the preview to Bitfrost and thought "wow this thing is going to be killer!" I was right on the money, except that it's a killer of batteries, not competing GPUs.Shadowmaster625 - Tuesday, March 14, 2017 - link
What is HTML5 DOM doing that wrecks the Snapdragon 821 so badly?joms_us - Tuesday, March 14, 2017 - link
Just some worthless test that the Monkey devs put to show how awesome iPhones are. But if you do real side-by-side website comparison between iPhone and and phone with SD821, SD821 will wipe the floor.