The Intel Core i7-7700K (91W) Review: The New Out-of-the-box Performance Champion
by Ian Cutress on January 3, 2017 12:02 PM ESTLegacy Tests
At AnandTech, I’ve taken somewhat of a dim view to pure synthetic tests, as they fail to be relatable. Nonetheless, our benchmark database spans to a time when that is all we had! We take a few of these tests for a pin with the latest hardware.
Cinebench R10
The R10 version of Cinebench is one of our oldest benchmarks, with data going back more than a few generations. The benchmark is similar to that of the newest R15 version, albeit with a simpler render target and a different strategy for multithreading.
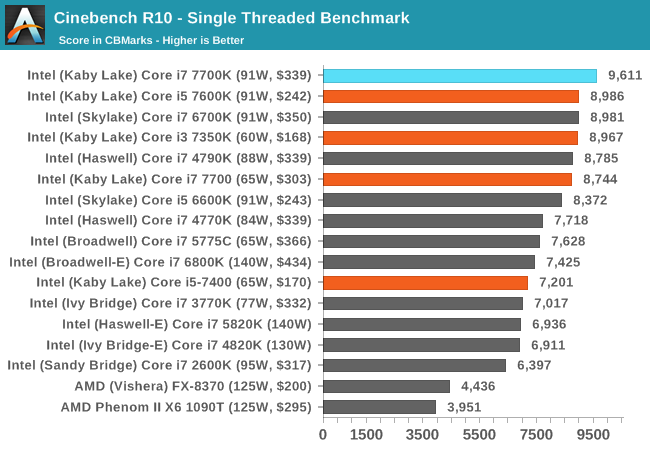
For a few years I was under the impression that CineBench’s workload was not amenable to more IPC increases, as we hovered around 7000 pts with new microarchitectures not making much of a difference. Being high frequency the i7-7700K pulls out a lead here, but it’s worth noting that Kaby Lake as a whole scores well, perhaps indicating that other features (such as frequency speed changing) can help.
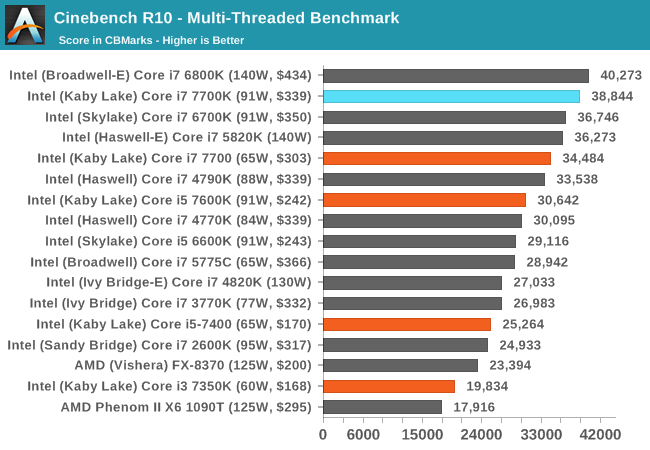
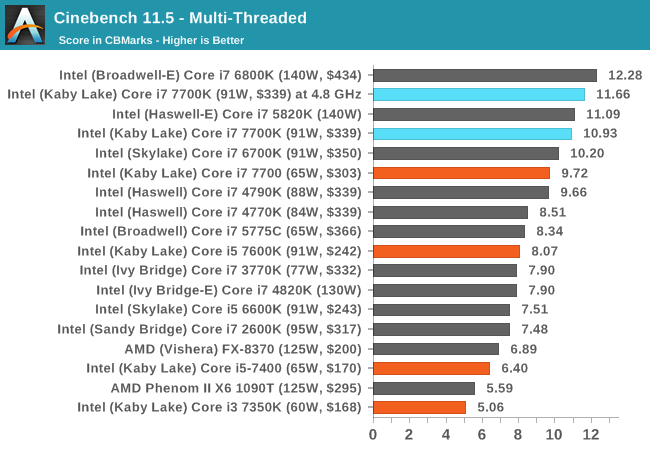
The multithreaded test gives different results, as this test typically prefers many cores. Rather than the new Cinebench tests dividing the scene up into over a hundred pieces (depends on threads), CB10 purely divides the scene into exactly how many threads are present. If a thread finishes early, it will try and cut the work of another thread in half. This sort of approach to multithreading has a different approach to frequency, cores and IPC, hence why R11.5 and R15 do bigger separations with core workloads.
Cinebench R11.5
CB11.5 has been popular for many years as a performance test, using easy to read and compare numbers that aren’t in the 1000s. We run the benchmark in an automated fashion three times in single-thread and multi-thread mode and take the average of the results.
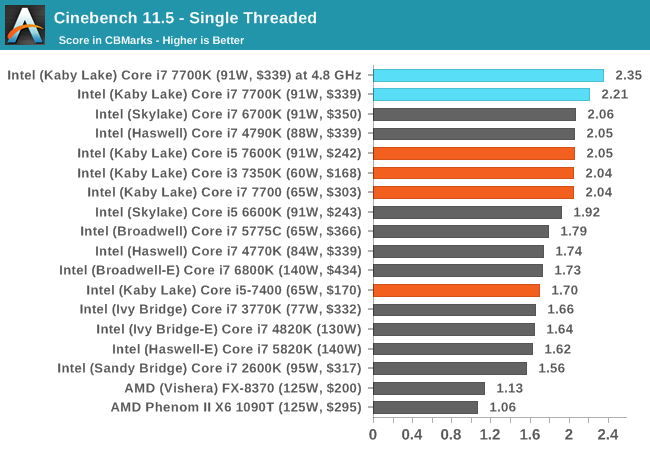
Similar to other tests, the i7-7700K takes the single thread crown, again beating an overclocked Devil’s Canyon i7-4790K, showing the out-of-the-box performance. Again, Kaby Lake as a whole seems to do well here, thanks to 4.2 GHz turbo modes on the i5-7600K and i3-7350K.
7-zip
As an open source compression/decompression tool, 7-zip is easy to test and features a built-in benchmark to measure performance. As a utility, similar to WinRAR, high thread counts, frequency and UPC typically win the day here.
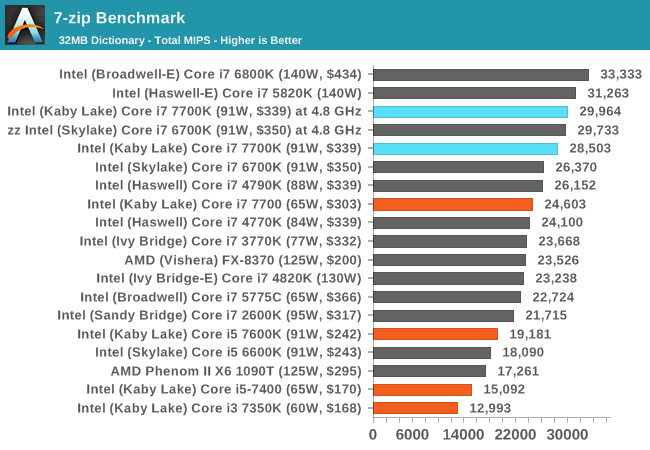
The Core i7-7700K shows the benefits of frequency over a stock i7-6700K, however at the same frequency they perform roughly the same as expected.
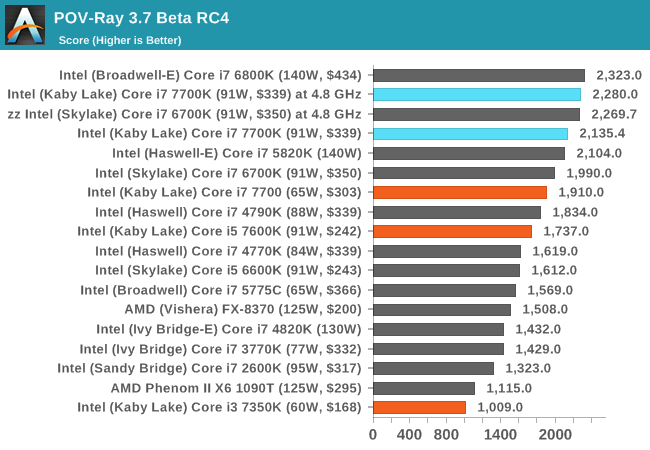
POV-Ray
Ray-tracing is a typical multithreaded test, with each ray being a potential thread in its own right ensuring that a workload can scale in complexity easily. This lends itself to cores, frequency and IPC: the more, the better.
AES via TrueCrypt
Despite TrueCrypt no longer being maintained, the final version incorporates a good test to measure different encryption methodologies as well as encryption combinations. When TrueCrypt was in full swing, the introduction of AES accelerated hardware dialed the performance up a notch, however most of the processors (save the Pentiums/Celerons) now support this and get good speed. The built-in TrueCrypt test does a mass encryption on in-memory data, giving results in GB/s.
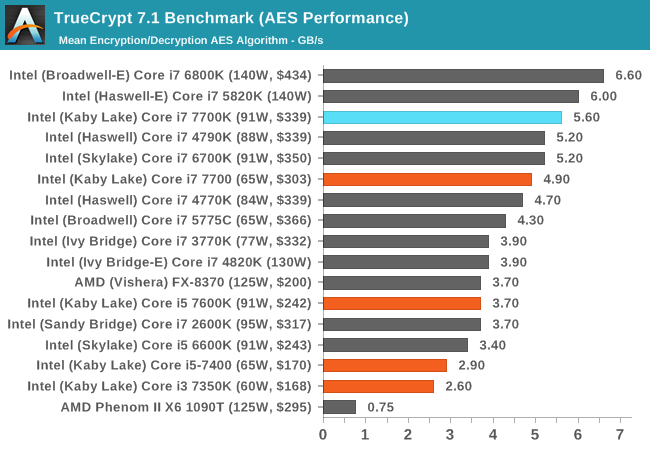
The encryption benchmark loves both threads and memory bandwidth, so we see the extreme processors pull out large leads due to 6+ cores and four memory channels. However, we see a similar picture as before to the Devil’s Canyon part: an out-of-the-box Core i7-7700K will beat an overclocked Core i7-4790K at 4.7 GHz.


125 Comments
View All Comments
Toss3 - Tuesday, January 3, 2017 - link
TBH they shouldn't just post mins, but decent FCAT analyses like the ones over on Guru3d.comUser.Name - Tuesday, January 3, 2017 - link
Well that involves a lot more hardware and time to record/analyze the results, which is why I suggested looking at minimum framerates. But you're right that would be a good improvement too.edzieba - Tuesday, January 3, 2017 - link
"For one thing, average framerates are meaningless when doing CPU tests. You need to be looking at minimum framerates."Framerate needs to be dropped entirely. Instead, frame render times (specifically range and variance) give a better picture of perceived 'responsiveness', as well as render times being convertible to an FPS value (though not vice versa).
Alexvrb - Tuesday, January 3, 2017 - link
Agreed, when reviewing CPUs it would stand to reason that you'd want to use games that tax the CPU.Notmyusualid - Friday, January 6, 2017 - link
Your second link there was especially interesting - thats why I went for more cores than four.My 14C/28T Xeon has to feed 2x 1070 FTWs. I don't think quad core & multi-gpu are that great together, in my experience.
For all the talk about games don't use more than 'x' cores, I see my cores / threads nicely loaded up for many games. Even MW3 shows activity over 12 Threads, however small, and thats old now.
I just got a 6950X for a song, and the scouser seller backed out on me AFTER I paid. So I get to wait 5 to 7 working days for my money back (thanks PayPal), and I won't get to see how much frequency would have affected my everyday computing. I won't be paying north of 1400 GBP for one, that I can tell you.
Mondozai - Tuesday, January 3, 2017 - link
Who the fuck is testing with GTX 980@1080p? It should be a GTX 1080@1080p because as games' visual demands go up progressively, it will show how the processor ages. This review is useless from that regard.Go to Sweclockers or any other website for a real review. AT has fallen so fucking much it's hilarious.
Gasaraki88 - Tuesday, January 3, 2017 - link
Yeah... surprisingly Tom's Hardware has really indepth reviews now a days just like the olden times. Considering that Microsoft has said that OSes lower than Windows 10 will not be supported on Kaby Lake, i'm surprised they are still using Windows 7 to to their tests.Shadowmaster625 - Tuesday, January 3, 2017 - link
There are lots of people that use a 980 with something like a 2500k or 2600k and might be wondering what a new cpu would do for them.dakishimesan - Tuesday, January 3, 2017 - link
Also using the same testing setup allows the results to be directly comparable to previous chips. They already mentioned in one of the articles regarding Kaby Lake (I think it was the i5 review) that they will be rolling out a new testbed and testing suite in February.BrokenCrayons - Tuesday, January 3, 2017 - link
From the Test Bed and Setup page:"This is also typically run at JEDEC subtimings where possible."
-and-
"Our testing methodology is ‘out-of-the-box’, with the latest public BIOS installed and XMP enabled, and thus subject to the whims of this feature."
After reading those two lines, I really don't know what Anandtech's memory settings were like for this article.