MSI Cubi 2 Kaby Lake UCFF PC Review
by Ganesh T S on December 30, 2016 3:30 PM ESTPerformance Metrics - I
The MSI Cubi2-005B was evaluated using our standard test suite for low power desktops / industrial PCs. Not all benchmarks were processed on all the machines due to updates in our testing procedures. Therefore, the list of PCs in each graph might not be the same. In the first section, we will be looking at SYSmark 2014 SE, as well as some of the Futuremark benchmarks.
BAPCo SYSmark 2014 SE
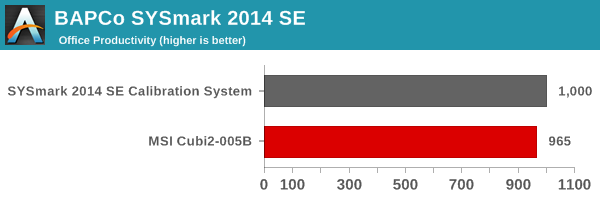
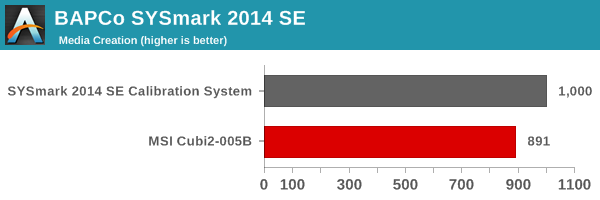
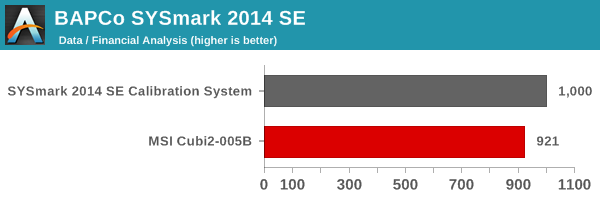
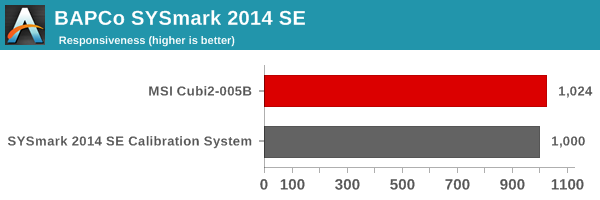
BAPCo's SYSmark 2014 SE is an application-based benchmark that uses real-world applications to replay usage patterns of business users in the areas of office productivity, media creation and data/financial analysis. In addition, it also addresses the responsiveness aspect which deals with user experience as related to application and file launches, multi-tasking etc. Scores are meant to be compared against a reference desktop (the SYSmark 2014 SE calibration system in the graphs below). While the SYSmark 2014 benchmark used a Haswell-based desktop configuration, the SYSmark 2014 SE makes the move to a Lenovo ThinkCenter M800 (Intel Core i3-6100, 4GB RAM and a 256GB SATA SSD). The calibration system scores 1000 in each of the scenarios. A score of, say, 2000, would imply that the system under test is twice as fast as the reference system.

SYSmark 2014 SE also adds energy measurement to the mix. A high score in the SYSmark benchmarks might be nice to have, but, potential customers also need to determine the balance between power consumption and the efficiency of the system. For example, in the average office scenario, it might not be worth purchasing a noisy and power-hungry PC just because it ends up with a 2000 score in the SYSmark 2014 SE benchmarks. In order to provide a balanced perspective, SYSmark 2014 SE also allows vendors and decision makers to track the energy consumption during each workload. In the graphs below, we find the total energy consumed by the PC under test for a single iteration of each SYSmark 2014 SE workload and how it compares against the calibration systems.
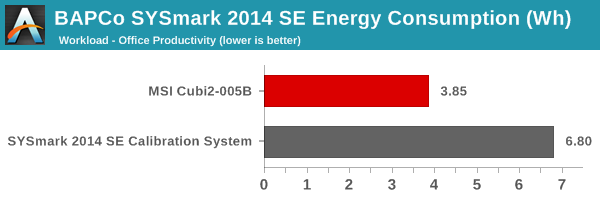
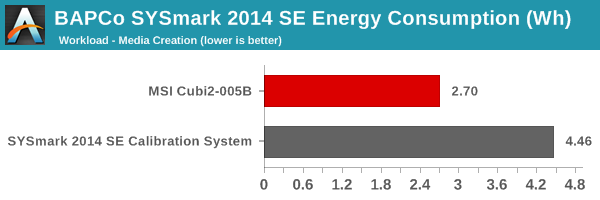
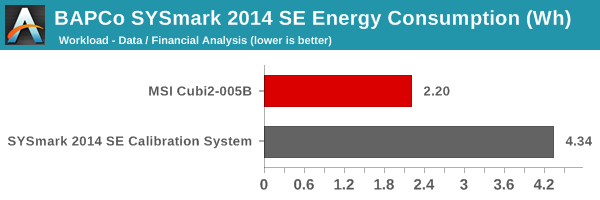
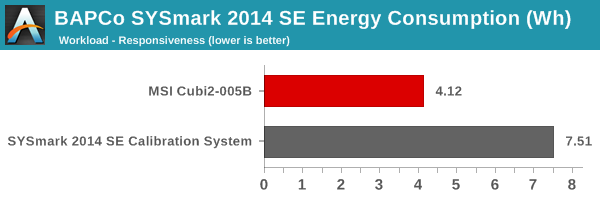
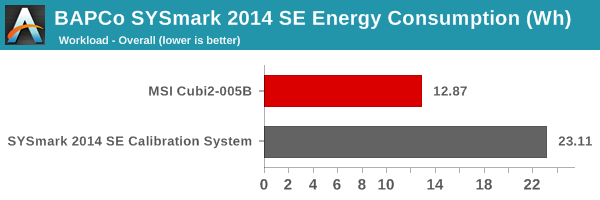
The Cubi2-005BUS is almost as good as the Skylake Core i3 desktop (in terms of scores), but, consumes about half the energy to provide that performance. This shows the energy efficiency provided by the Kaby Lake platform.
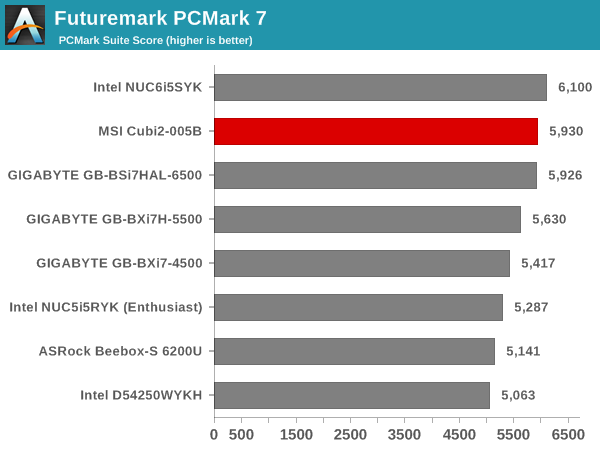
Futuremark PCMark 8
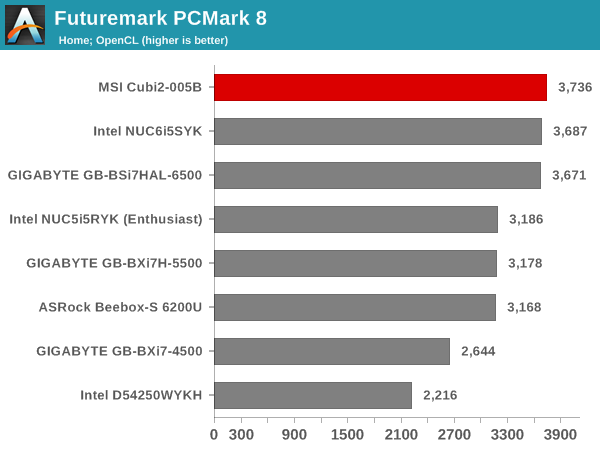
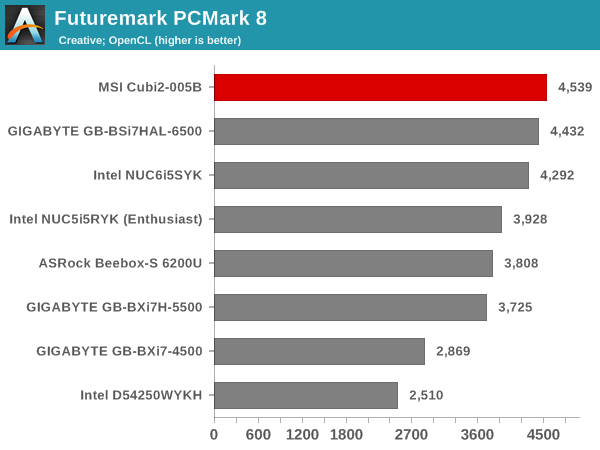
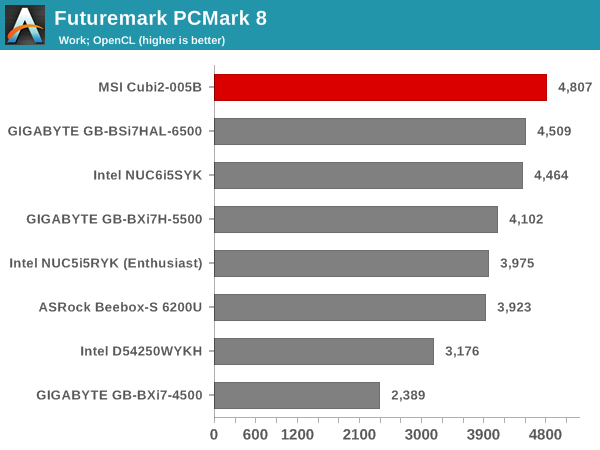
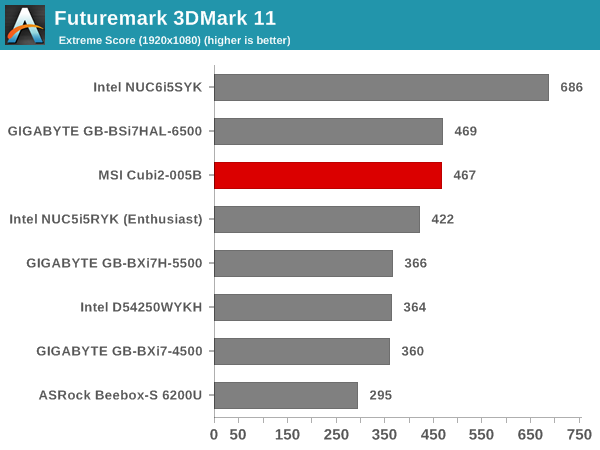
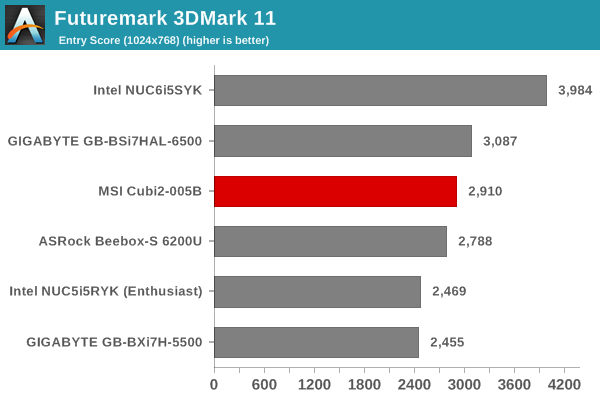
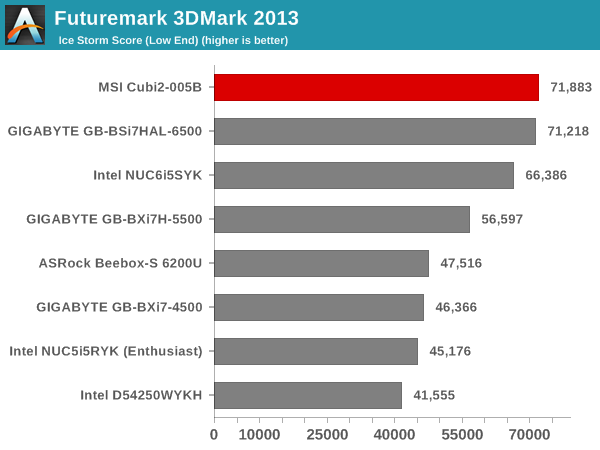
PCMark 8 provides various usage scenarios (home, creative and work) and offers ways to benchmark both baseline (CPU-only) as well as OpenCL accelerated (CPU + GPU) performance. We benchmarked select PCs for the OpenCL accelerated performance in all three usage scenarios. These scores are heavily influenced by the CPU in the system. The Cubi2-005BUS is equipped with the highest-end KBL-U CPU, and the power of the Core i7-7500U enables it to easily outscore all the UCFF PCs from the previous generations. In the GPU-related bechmarks, the Skylake Iris graphics-enabled SKU (Intel NUC65SYK) comes out on top.
Miscellaneous Futuremark Benchmarks
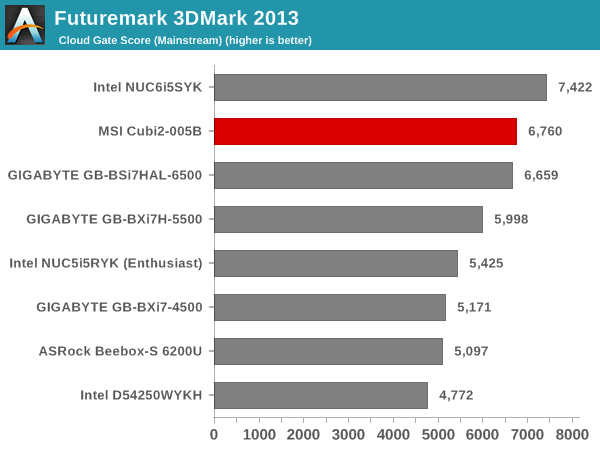
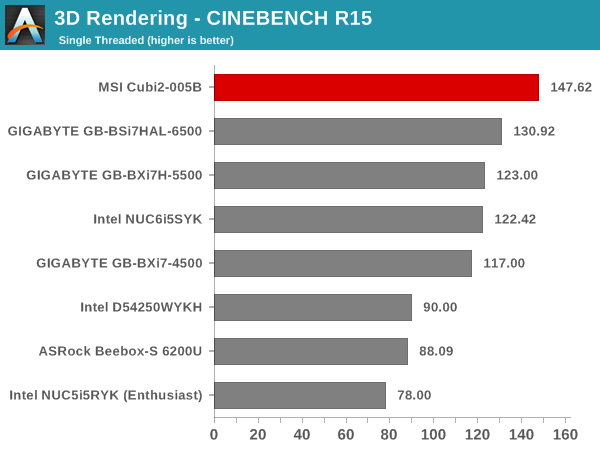
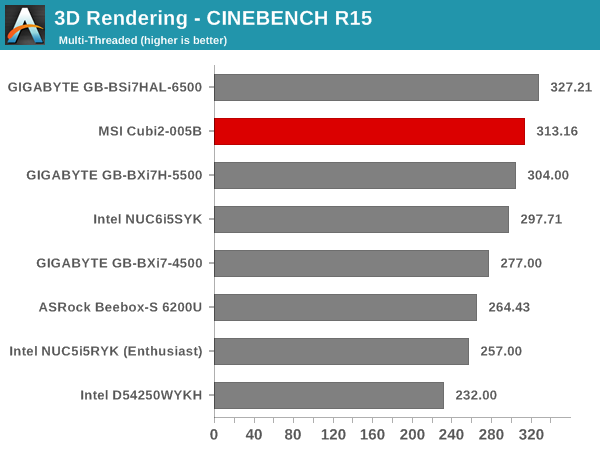
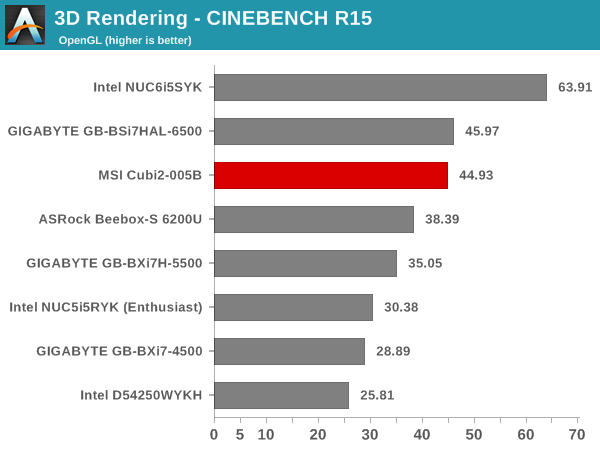
3D Rendering - CINEBENCH R15
We have moved on from R11.5 to R15 for 3D rendering evaluation. CINEBENCH R15 provides three benchmark modes - OpenGL, single threaded and multi-threaded. Evaluation of select PCs in all three modes provided us the following results. These results show that the higher configurable TDP (cTDP-Up) of the Core i7-6500U in the GIGABYTE GB-BSi7HAL-6500 enables it to outscore the Cubi2-005BUS in the multi-threaded and OpenGL runs. The NUC65SYK also comes out on top in the OpenGL case because of the Iris GPU.


32 Comments
View All Comments
NikosD - Saturday, December 31, 2016 - link
In the paragraph of x264's description says:"Actual x264 encoding performance with the Kaby Lake processors and using the latest x264 releases (with AVX512 support) is bound to be even better compared to the numbers below."
I don't think x264 or any other non extremely customized app has AVX512 support, but you probably mean AVX2.
But even AVX2 is used no more than 5% by x264 last time I checked.
It is x265 that makes heavy use of AVX2 instructions.
ganeshts - Saturday, December 31, 2016 - link
Thanks for the note. Yes, it is indeed AVX2, and the relevant section has been updated. Btw, do you have any studies confirming the 5% number? I based my note on this investigation: https://mailman.videolan.org/pipermail/x264-devel/...NikosD - Tuesday, January 3, 2017 - link
Yes my source is an old comment for the mentioned subject by me here:http://forum.doom9.org/showthread.php?p=1690751#po...
The comment I referred to by the developer of x264 mentioning 5% gain of AVX2 only over Ivy bridge is here:
http://forum.doom9.org/showthread.php?p=1631325#po...
Icehawk - Saturday, December 31, 2016 - link
Are you ever going to switch to x265? Far superior encoding, I have been converting all of my video files over and saving 50-75% space with no visible quality change.Pazz - Saturday, December 31, 2016 - link
I know of no x265 unifiable benchmark suite/program.lagittaja - Monday, January 2, 2017 - link
Anything wrong with the HWBot benchmark?http://hw-museum.cz/hwbot_x265_benchmark.php
Or you could just download the latest x265 and run the cli with your own test clip and settings. And you could just as well write yourself a little script to log the results along with a dump of relevant info from CPU-Z etc.
vlado08 - Saturday, December 31, 2016 - link
May be it will be interesting to test the HW h.265 encoderbarleyguy - Saturday, December 31, 2016 - link
The advantage of H.264 is that my tablet will play it without killing the battery (because of onboard decoding), and my TV will play it off a USB stick. We might get there with x265 someday.PyroHoltz - Saturday, December 31, 2016 - link
The 1x1 NIC is a serious oversight IMHOKingGheedora - Tuesday, January 3, 2017 - link
Can anyone elaborate on this line: "It is a pity that the display engine still doesn't support HDMI 2.0 natively"?What is the "display engine" referring to? Is it the Intel HD 620 hardware, or is it something in the drivers that can be fixed? Or is it an OS issue?