Zotac ZBOX MAGNUS EN1080 SFF PC Review: A Premium Gaming Powerhouse
by Ganesh T S on December 19, 2016 8:30 AM ESTPerformance Metrics - I
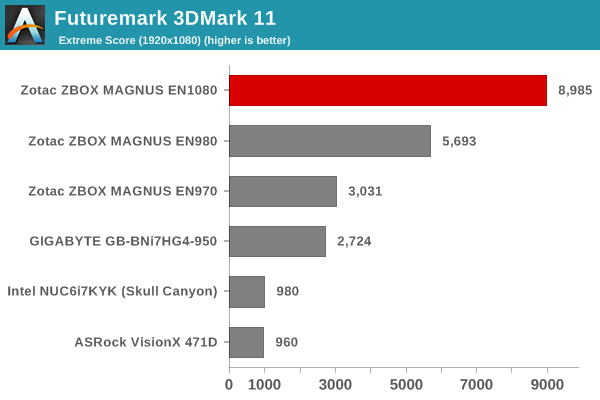
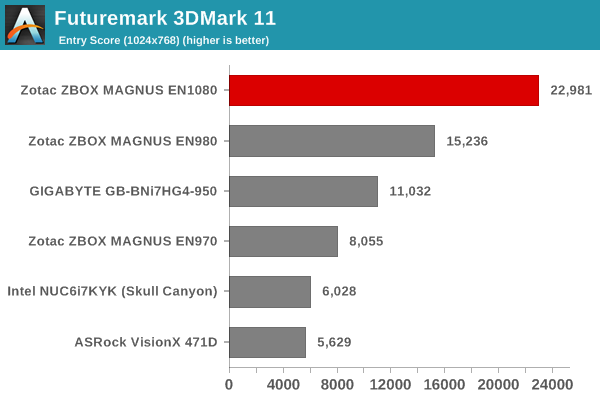
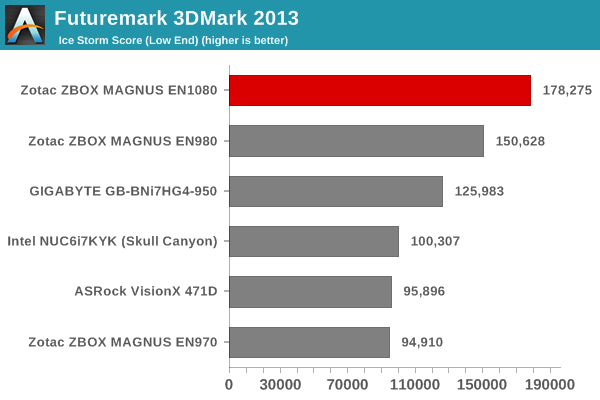
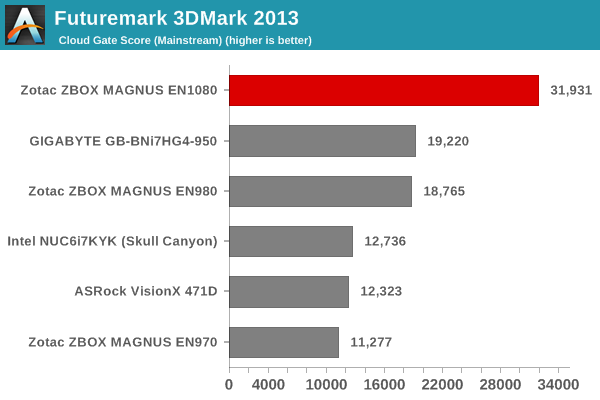
The Zotac ZBOX MAGNUS EN1080 was evaluated using our standard test suite for gaming mini-PCs. Not all benchmarks were processed on all the machines due to updates in our testing procedures. Therefore, the list of PCs in each graph might not be the same. In the first section, we will be looking at SYSmark 2014 SE, as well as some of the Futuremark benchmarks.
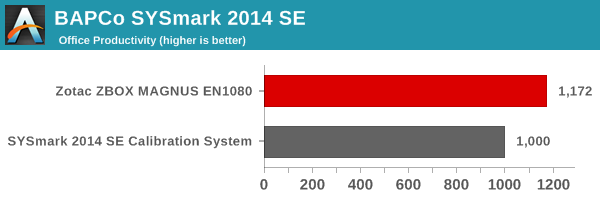
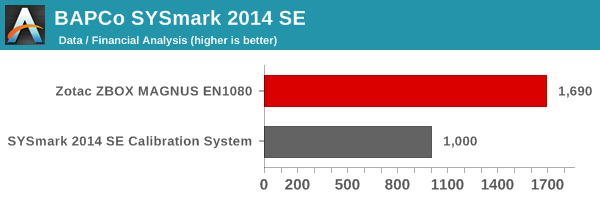
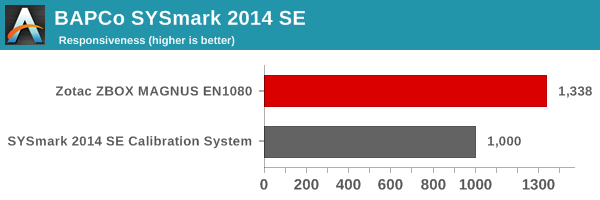
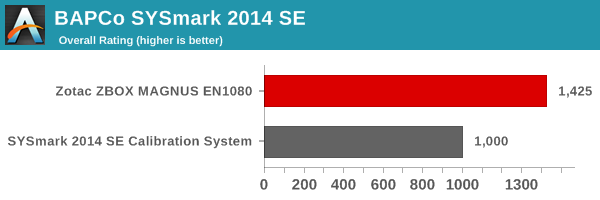
BAPCo SYSmark 2014 SE
BAPCo's SYSmark 2014 SE is an application-based benchmark that uses real-world applications to replay usage patterns of business users in the areas of office productivity, media creation and data/financial analysis. In addition, it also addresses the responsiveness aspect - the user experience as related to application and file launches, multi-tasking etc. Scores are meant to be compared against a reference desktop (the SYSmark 2014 SE calibration system in the graphs below). While the SYSmark 2014 benchmark used a Haswell-based desktop configuration, the SYSmark 2014 SE makes the move to a Lenovo ThinkCenter M800 (Intel Core i3-6100, 4GB RAM and a 256GB SATA SSD). The calibration system scores 1000 in each of the scenarios. A score of, say, 2000, would imply that the system under test is twice as fast / better as the reference system.

SYSmark 2014 SE also adds energy measurement to the mix. A high score in the SYSmark benchmarks might be nice to have, but, potential customers also need to determine the balance between power consumption and the efficiency of the system. For example, in the average office scenario, it might not be worth purchasing a noisy and power-hungry PC just because it ends up with a 2000 score in the SYSmark 2014 SE benchmarks. In order to provide a balanced perspective, SYSmark 2014 SE also allows vendors and decision makers to track the energy consumption during each workload. In the graphs below, we find the total energy consumed by the PC under test for a single iteration of each SYSmark 2014 SE workload and how it compares against the calibration system.

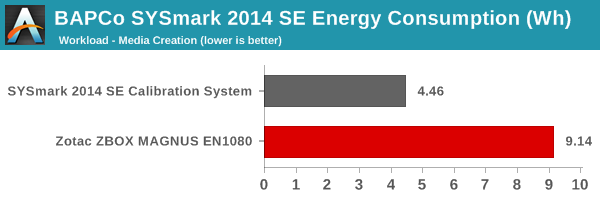
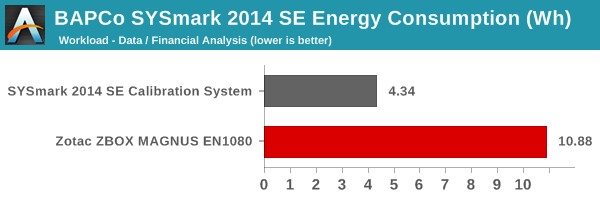
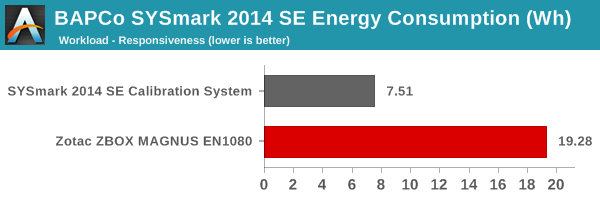
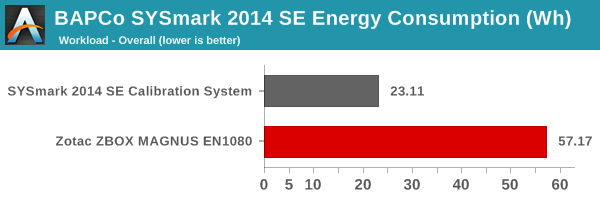
The Core i7-6700-based MAGNUS EN1080 obviously performs far better than the ThinkCenter M800 with a Core i3-6100. However, the presence of a discrete GPU in the EN1080 drives up the energy consumption quite a bit compared to the calibration system. The benchmark numbers just prove that the ZBOX MAGNUS EN1080 is no slouch when it comes to business tasks, but, it makes no sense to purchase it just for that purpose. Gaming is the obvious focus, and we will be looking at the relevant benchmarks starting with the next sub-section.
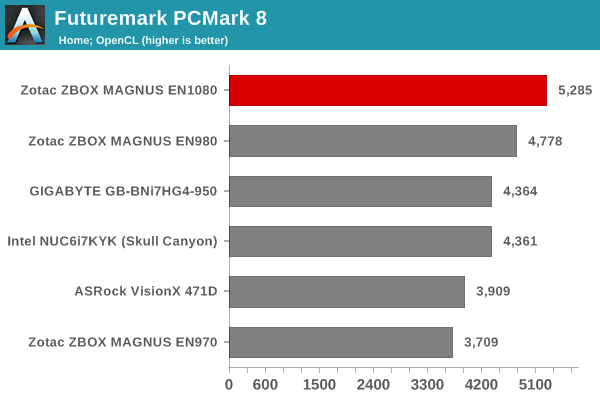
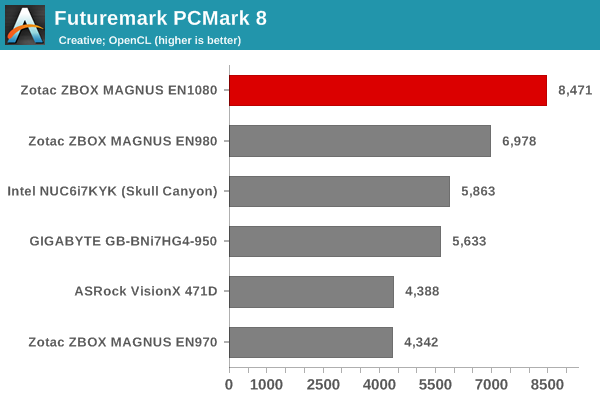
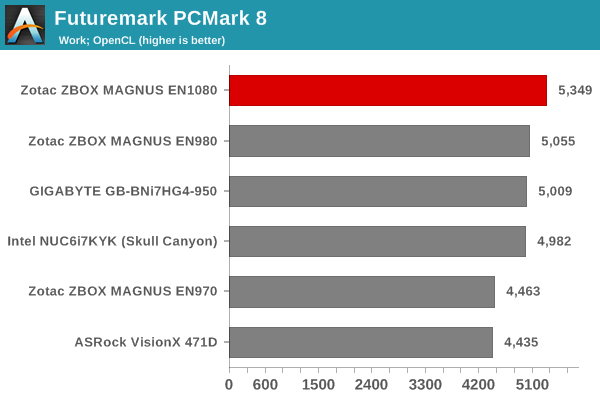
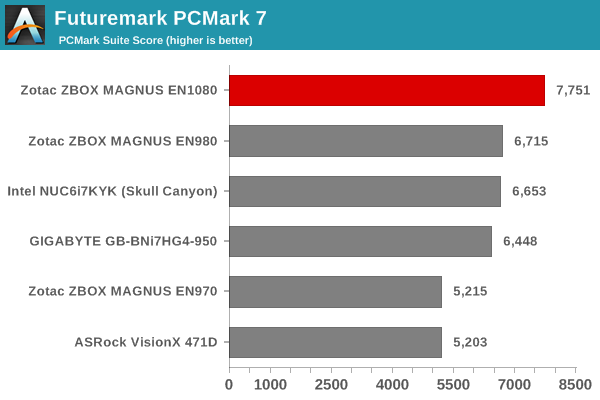
Futuremark PCMark 8
PCMark 8 provides various usage scenarios (home, creative and work) and offers ways to benchmark both baseline (CPU-only) as well as OpenCL accelerated (CPU + GPU) performance. We benchmarked select PCs for the OpenCL accelerated performance in all three usage scenarios. These scores are heavily influenced by the CPU in the system. The Core i7-6700 is the most powerful CPU that we have evaluated in the SFF PC space, and we have not seen any GPU as capable as the GTX 1080 in this market segment till now. Therefore, it is no surprise that the ZBOX MAGNUS EN1080 comes out on top in all of the Futuremark benchmarks.
Miscellaneous Futuremark Benchmarks
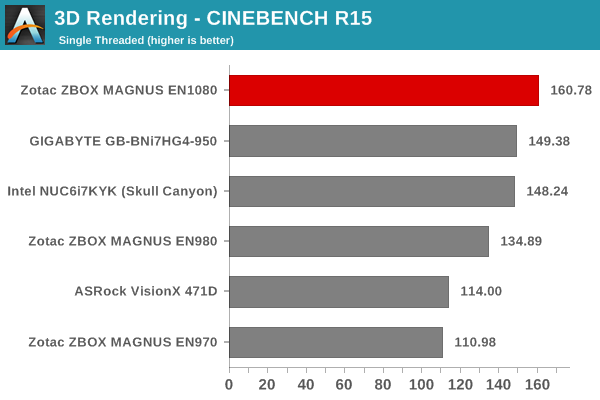
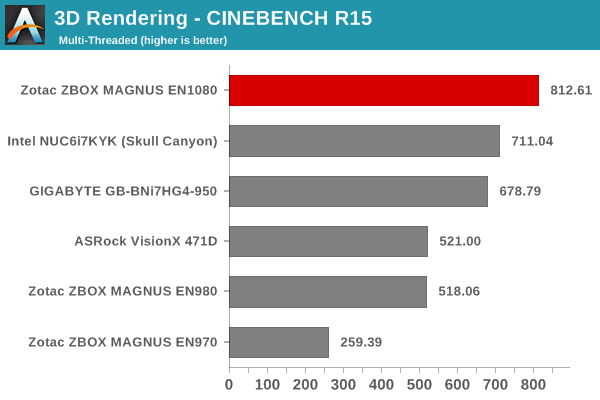
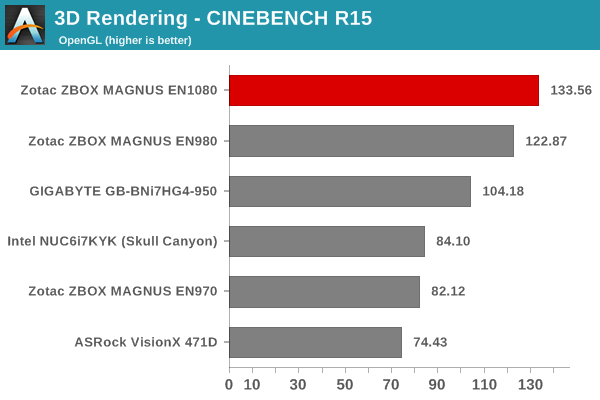
3D Rendering - CINEBENCH R15
We have moved on from R11.5 to R15 for 3D rendering evaluation. CINEBENCH R15 provides three benchmark modes - OpenGL, single threaded and multi-threaded. Evaluation of select PCs in all three modes provided us the following results. As we saw in the Futuremark benchmarks, the ZBOX MAGNUS EN1080 easily comes out on top in all of the modes.


38 Comments
View All Comments
ganeshts - Monday, December 19, 2016 - link
To be honest, I did take the pictures, but didn't upload them because (a) their quality was not good, and I was attempting a quick turn around for this review prior to my year-end break, (b) the information conveyed in the photographs were conveyed in a better manner by the photos from Zotac's marketing team.Anyways, in order to avoid making readers go to Zotac's site for the pictures, I have made a gallery of the ones from their initial PR blast.
http://www.anandtech.com/Gallery/Album/5209
It is also linked now in the first page of the article.
fanofanand - Monday, December 19, 2016 - link
I'd rather have quicker turntimes than pretty pictures. If you want to see a gallery go to the manufacturer site. Excellent analysis Ganesh. I was hoping you could elaborate on why the memory was restricted to jedec? Is it a motherboard limitation?prisonerX - Tuesday, December 20, 2016 - link
Thanks, they might not be ideal but they are informative and really most people want to stay on this site and continue going through articles, so going to an external site can be a problem, as silly as that sounds.JamsCB - Tuesday, December 20, 2016 - link
That could explain it. I've seen that dual brick thing a few times very recently, including just earlier today found out the ASUS G20CB small form factor "desktop" has a dual brick setup too.Laststop311 - Tuesday, December 20, 2016 - link
While it's small I would rather put 2500 dollars into a fully powered micro atx tower. Better + quieter cooling, fully powered overclocked cpu, overclocked gpu, regular DDR4 ram with more bandwidth and with that kinda budget you can stick a 2TB 960 pro m2 ssd as your main drive and a big HGST helium drive for your mass media storage. Or go with cheaper SSD storage + a 5 -8 bay NAS in your basement. To have 2500 to pay for this means you really have money to throw around or are stupid.shelbystripes - Tuesday, December 20, 2016 - link
While I love the concept, $2500 seems absurd for what you're getting.To put this in comparison, an Alienware 17 laptop with an 8GB GTX 1070, i7-6820HK CPU, and 16GB RAM starts at $1899. Upgrade to GTX 1080 and 32GB RAM for $2899. That includes a 512GB PCIe SSD *and* a 1TB HDD for additional storage.
For $400 more you get a computer that is still compact enough to be portable, and is the same performance (actually with a faster CPU and more storage space), but with a built in 17" 120Hz G-Sync enabled monitor and keyboard to boot. You can always hook up external KVM to use at home, but be able to take it with you easily. Oh, and I believe the Alienware only requires one power brick.
Alienware tend to be more expensive than the competition. ASUS' laptops with GTX 1080 aren't out yet. But when they are, I'm betting they'll have one at $2500, making this Zotac irrelevant.
OrphanageExplosion - Monday, December 26, 2016 - link
Interesting review but ultimately has a ton of info I don't need (1280x1024 performance with a GTX 1080? What?) and a ton of info I do need that isn't there. For example, boost clock on my GTX 1080 FE tops out at around 1866MHz and will stay there - what about this one? How loud is the unit under load? How about 1440p and 4K benchmarks (far more relevant for this GPU than what you did test)?Bottom line is that I went in wanting to know if this can match an actual desktop GTX 1080 system and I came out still not really knowing to what extent it may be lacking. If it's slower than a GTX 1080 laptop (which typically loses around 100-150MHz compared to the FE) I guess it's really a fair bit slower?
My feeling here is that perhaps the benchmark suite is outdated and so this review is being held hostage by the need to match up with legacy data that in many areas has little relevance to the actual use-case scenarios for the unit.
ottawajimbo - Thursday, December 29, 2016 - link
Has anyone tried to get a Linux distribution running on this?