GIGABYTE BRIX Gaming UHD GB-BNi7HG4-950 mini-PC Review
by Ganesh T S on October 28, 2016 7:30 AM ESTPerformance Metrics - I
The GIGABYTE GB-BNi7HG4-950 was evaluated using our standard test suite for mini-PCs targeting the gaming market. Not all benchmarks were processed on all the machines due to updates in our testing procedures. Therefore, the list of PCs in each graph might not be the same. In the first section, we will be looking at SYSmark 2014, as well as some of the Futuremark benchmarks.
BAPCo SYSmark 2014
BAPCo's SYSmark 2014 is an application-based benchmark that uses real-world applications to replay usage patterns of business users in the areas of office productivity, media creation and data/financial analysis. Scores are meant to be compared against a reference desktop (HP ProDesk 600 G1 with a Core i3-4130, 4GB RAM and a 500GB hard drive) that scores 1000 in each of the scenarios. A score of, say, 2000, would imply that the system under test is twice as fast as the reference system.
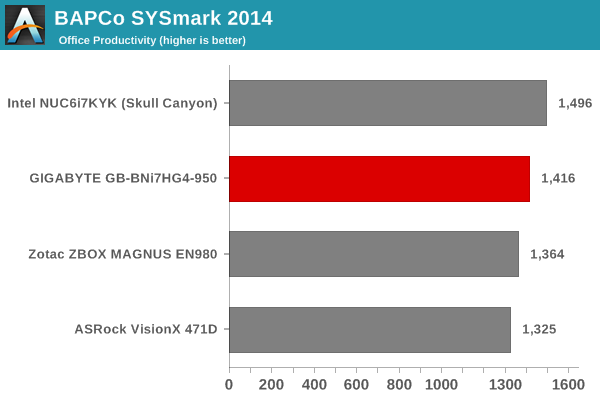
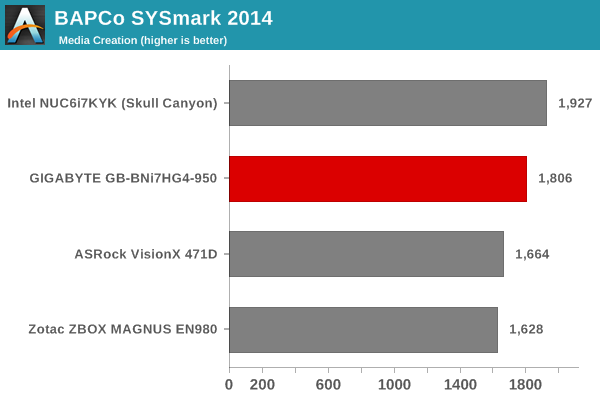
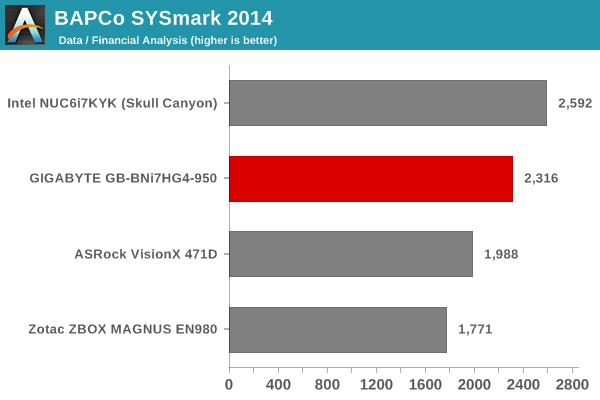
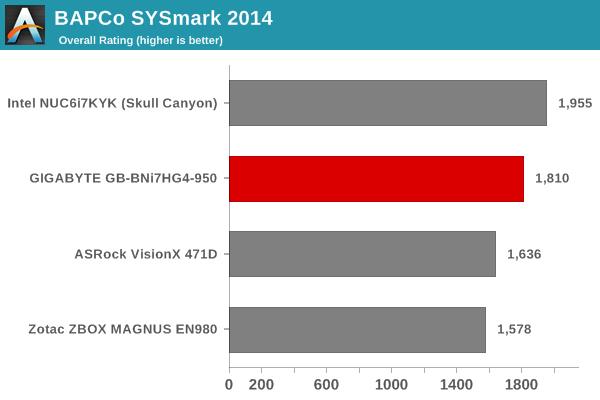
SYSark 2014 is mostly a test of CPU capabilities. Even though the Core i7-6700HQ in the BRIX Gaming UHD and the Core i7-6770HQ in the Skull Canyon NUC are clocked similarly, the latter is equipped with eDRAM, which represents an additional caching level for compute workloads also. The BRIX also utilizes only one memory slot out of the available two (due to the way our review unit came pre-configured). The use of a SATA drive in the BRIX compare to a PCIe NVMe SSD in the NUC also has some effect on the scores.
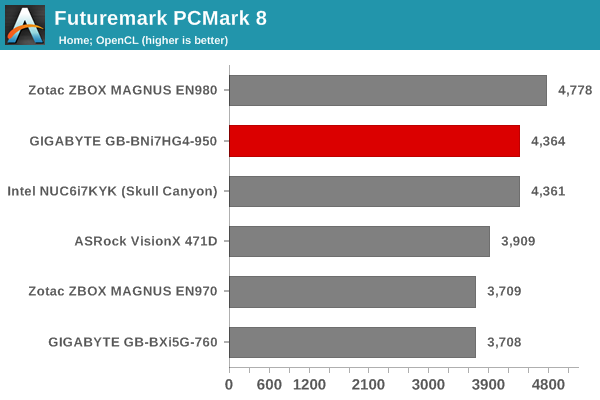
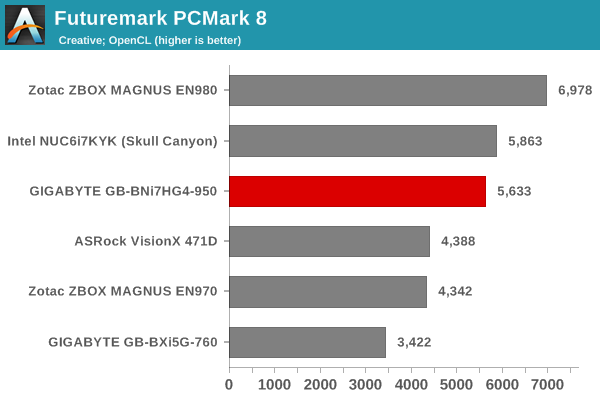
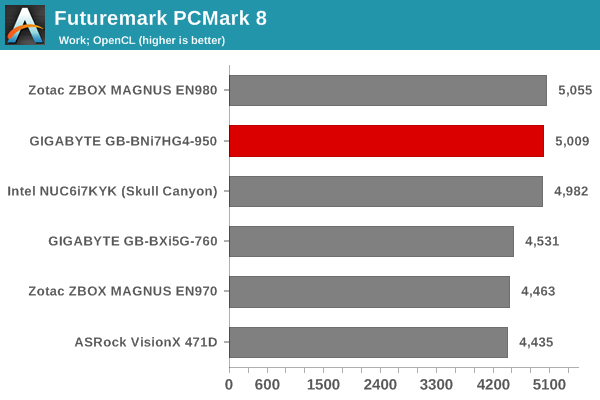
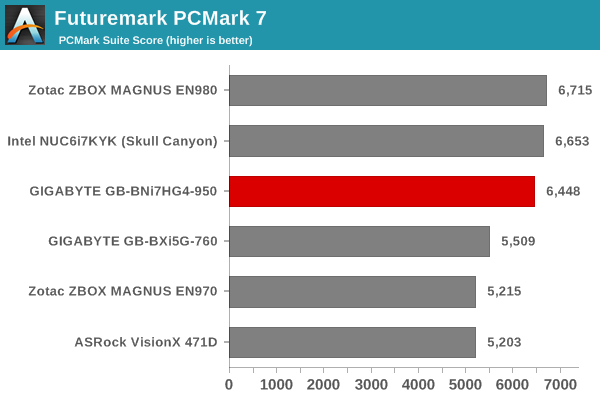
Futuremark PCMark 8
PCMark 8 provides various usage scenarios (home, creative and work) and offers ways to benchmark both baseline (CPU-only) as well as OpenCL accelerated (CPU + GPU) performance. We benchmarked select PCs for the OpenCL accelerated performance in all three usage scenarios. These scores are heavily influenced by the CPU and GPU in the system. In these workloads, the BRIX and the NUC are much closer. However, the extremely powerful GPU (GTX 980) in the Zotac ZBOX MAGNUS EN980 earns it top honors in all the tests.
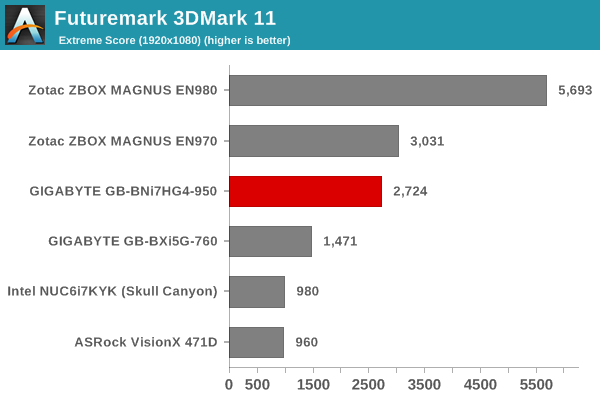
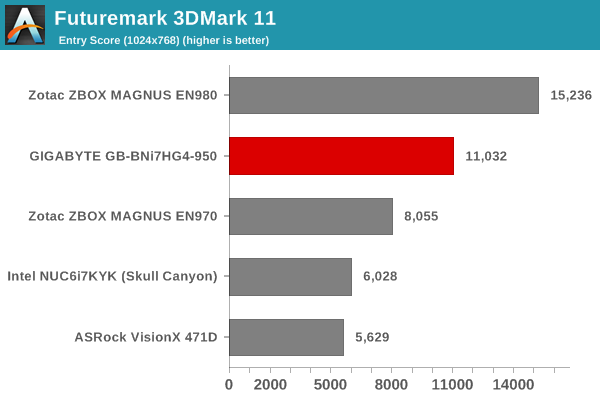
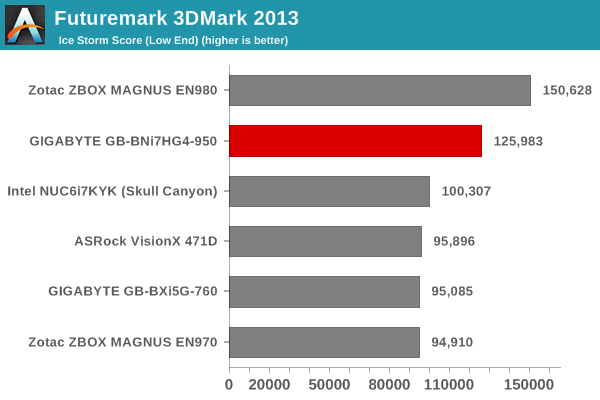
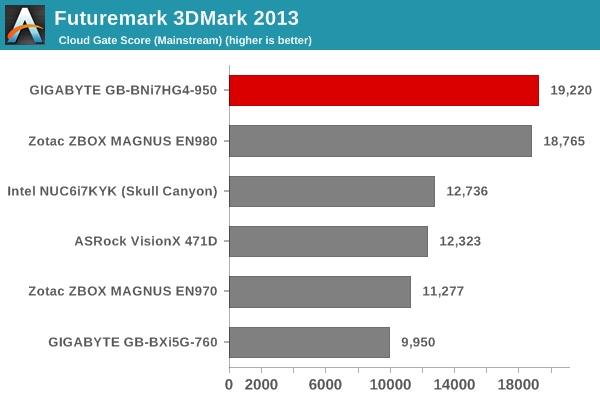
Miscellaneous Futuremark Benchmarks
3D Rendering - CINEBENCH R15
CINEBENCH R15 provides three benchmark modes for evaluation of 3D rendering capabilities - OpenGL, single threaded and multi-threaded. Evaluation of select PCs in all three modes provided us the following results.
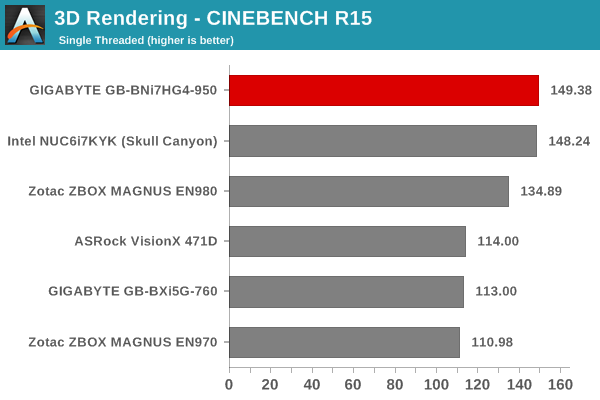
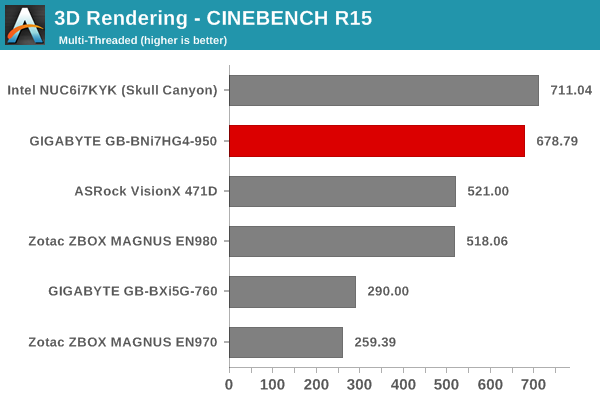
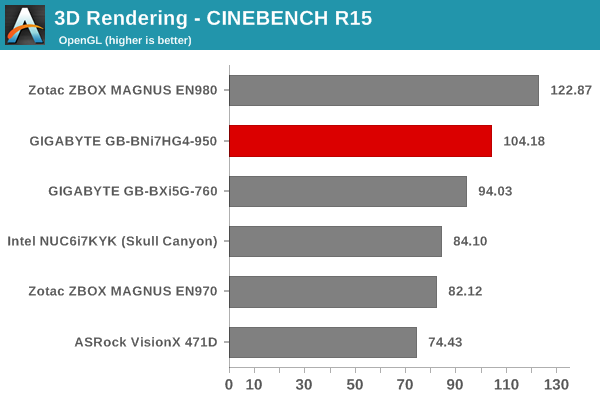
As expected, the GTX 980-equipped ZBOX handily wins the OpenGL bench. For the CPU modes, the Skull Canyon NUC outscores the BRIX slightly in the multi-threaded case, likely due to the presence of eDRAM in the former, and the absence of dual-channel memory in the BRIX. The single-threaded scores for the two PCs are similar.


50 Comments
View All Comments