ASRock Beebox-S 6200U Review - An Alternative to the Skylake NUC
by Ganesh T S on August 10, 2016 8:00 AM ESTPerformance Metrics - I
The ASRock Beebox-S 6200U was evaluated using our standard test suite for low power desktops / industrial PCs. Not all benchmarks were processed on all the machines due to updates in our testing procedures. Therefore, the list of PCs in each graph might not be the same. In the first section, we will be looking at SYSmark 2014, as well as some of the Futuremark benchmarks.
BAPCo SYSmark 2014
BAPCo's SYSmark 2014 is an application-based benchmark that uses real-world applications to replay usage patterns of business users in the areas of office productivity, media creation and data/financial analysis. Scores are meant to be compared against a reference desktop (HP ProDesk 600 G1 with a Core i3-4130, 4GB RAM and a 500GB hard drive) that scores 1000 in each of the scenarios. A score of, say, 2000, would imply that the system under test is twice as fast as the reference system.
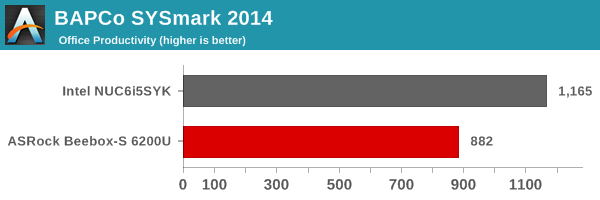
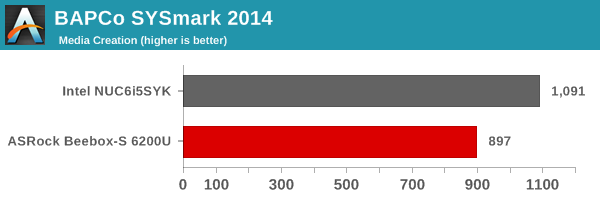
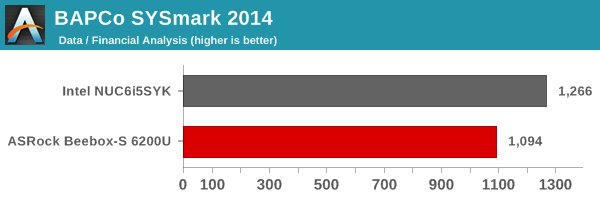

Since SYSmark 2014 is one of the newer benchmarks in our suite, we only have the Intel NUC6i5SYK to compare against. In all of the components, the Intel NUC comes out ahead, thanks to its higher turbo frequency as well as bigger cache (4MB in the Core i5-6260U vs. 3MB in the Core i5-6200U).
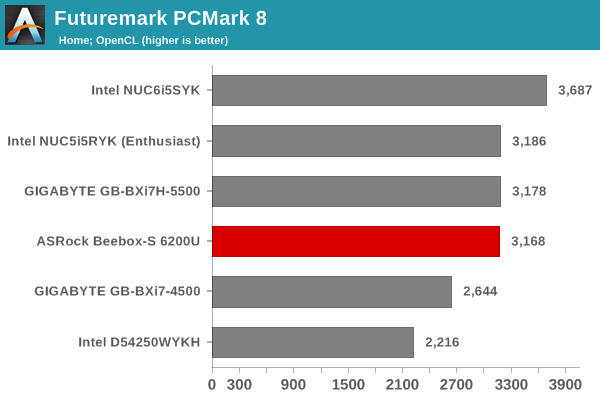
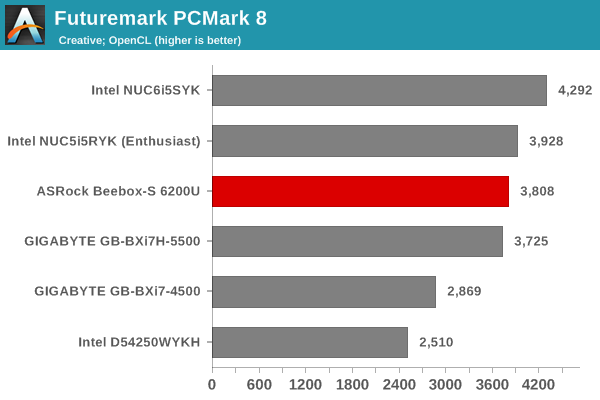
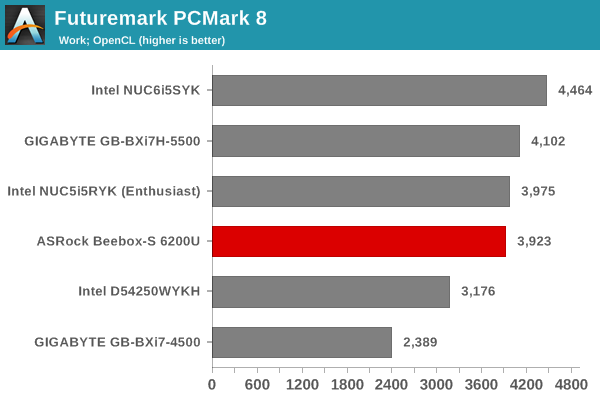
Futuremark PCMark 8
PCMark 8 provides various usage scenarios (home, creative and work) and offers ways to benchmark both baseline (CPU-only) as well as OpenCL accelerated (CPU + GPU) performance. We benchmarked select PCs for the OpenCL accelerated performance in all three usage scenarios. These scores are heavily influenced by the CPU in the system.
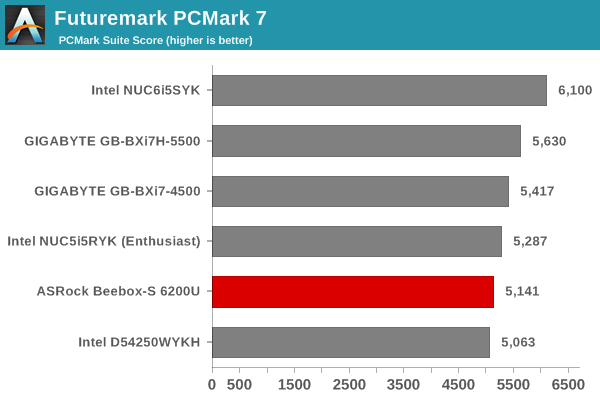
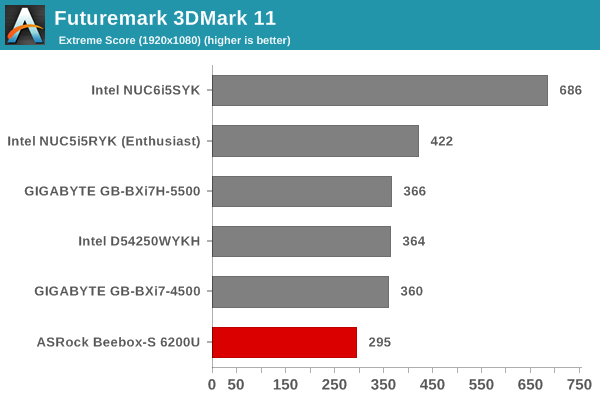
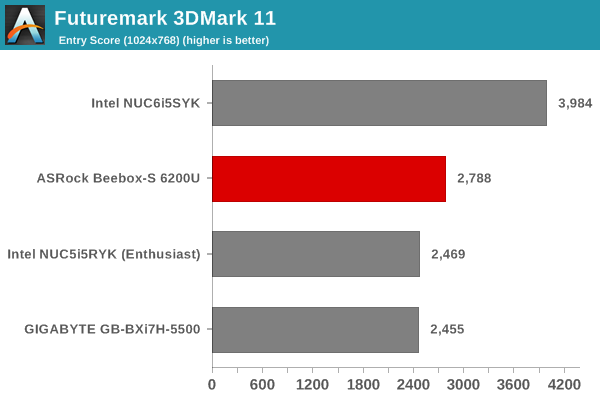
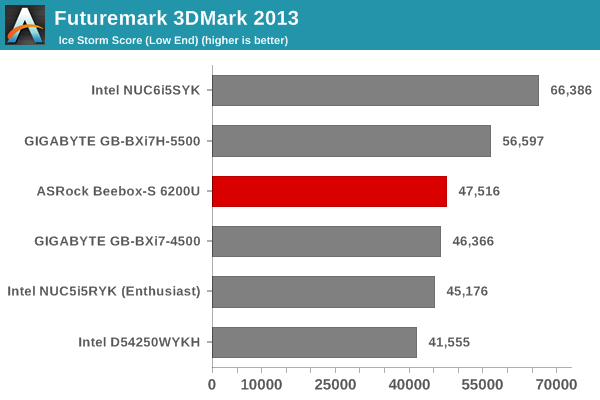
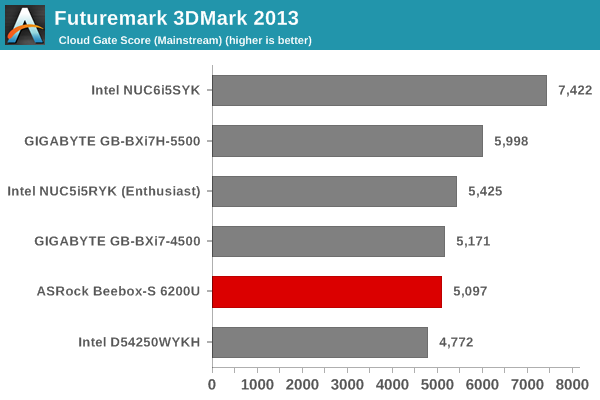
Miscellaneous Futuremark Benchmarks
The Beebox-S 6200U comes in the middle of the pack when it comes to CPU-limited benchmarks. However, the GPU benchmarks show some serious shortcomings, as the Intel HD Graphics 520 is quite weak compared to the integrated GPUs in the other PCs that we are comparing against.
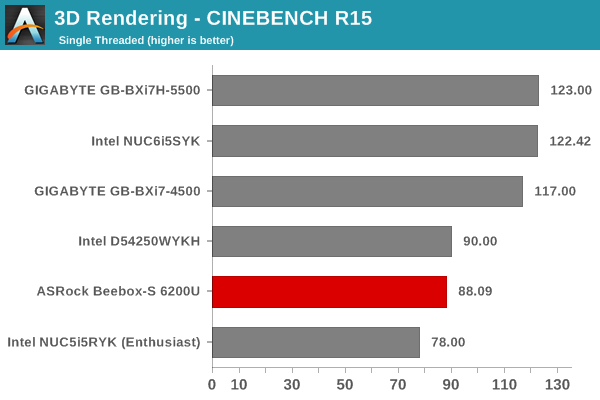
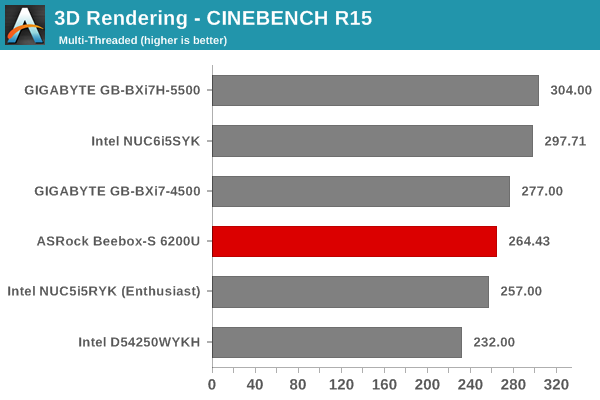
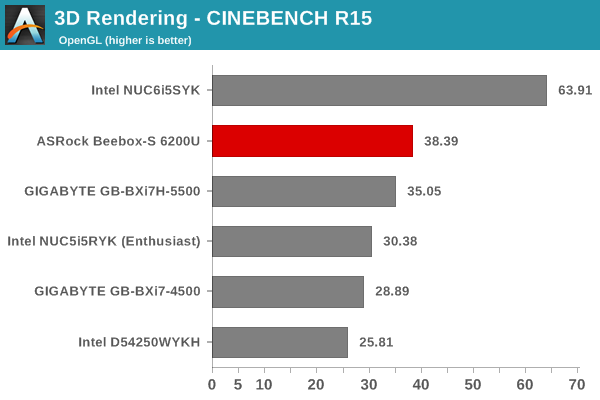
3D Rendering - CINEBENCH R15
CINEBENCH R15 provides three benchmark modes - OpenGL, single threaded and multi-threaded. Evaluation of select PCs in all three modes provided us the following results. The trends we observed in the Futuremark benchmarks are evident here also.


30 Comments
View All Comments