The GeForce GTX 1060 Founders Edition & ASUS Strix GTX 1060 Review
by Ryan Smith on August 5, 2016 2:00 PM ESTCompute
Shifting gears, let’s take a look at compute performance on GTX 1060.
As we already had the chance to categorize the Pascal architecture’s compute performance in our GTX 1080 review, there shouldn’t be any surprises here. But it will be interesting to see whether the GTX 1060’s higher ratio of memory bandwidth per FLOP materially impacts overall compute performance.
Starting us off for our look at compute is LuxMark3.1, the latest version of the official benchmark of LuxRender. LuxRender’s GPU-accelerated rendering mode is an OpenCL based ray tracer that forms a part of the larger LuxRender suite. Ray tracing has become a stronghold for GPUs in recent years as ray tracing maps well to GPU pipelines, allowing artists to render scenes much more quickly than with CPUs alone.
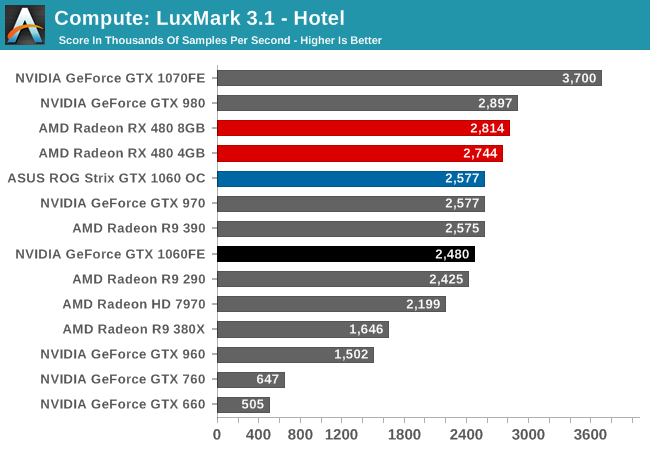
While GTX 1060 could hang with GTX 980 in gaming benchmarks, we don’t start off the same way with compute benchmarks, with the last-generation flagship holding about 17% ahead. Unfortunately for NVIDIA, this is about where GTX 1060 needed to be to best RX 480; instead it ends up trailing the AMD competition. Otherwise the performance gain versus the GTX 960 stands at 65%.
For our second set of compute benchmarks we have CompuBench 1.5, the successor to CLBenchmark. CompuBench offers a wide array of different practical compute workloads, and we’ve decided to focus on face detection, optical flow modeling, and particle simulations.
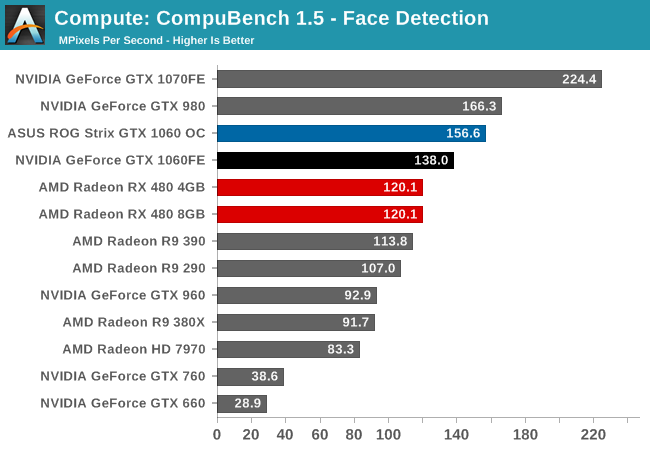
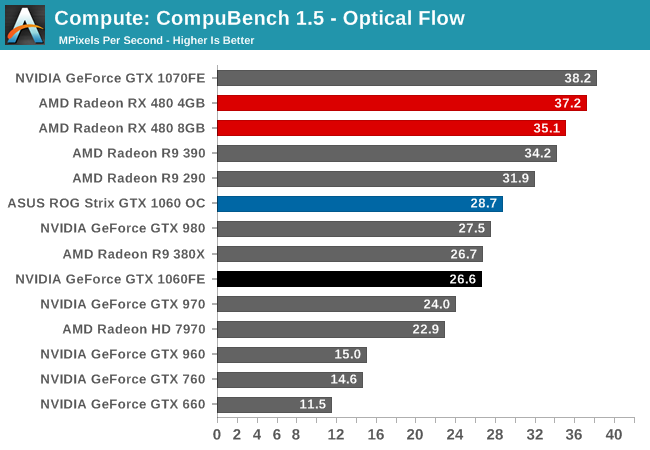
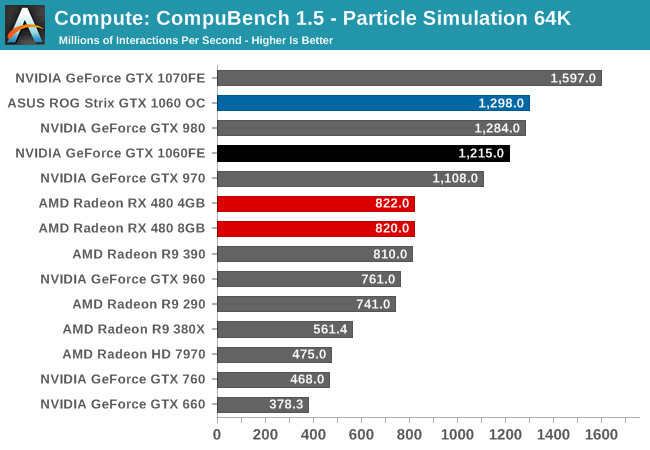
Like with GTX 1080, relative performance is all over the place. GTX 1060 wins with face detection, loses at optical flow, and wins again at particle simulation. Even the gains versus GTX 960 are a bit more uneven, though at the end of the day GTX 1060 ends up being significantly faster than its predecessor with all 3 sub-benchmarks.
Moving on, our 3rd compute benchmark is the next generation release of FAHBench, the official Folding @ Home benchmark. Folding @ Home is the popular Stanford-backed research and distributed computing initiative that has work distributed to millions of volunteer computers over the internet, each of which is responsible for a tiny slice of a protein folding simulation. FAHBench can test both single precision and double precision floating point performance, with single precision being the most useful metric for most consumer cards due to their low double precision performance. Each precision has two modes, explicit and implicit, the difference being whether water atoms are included in the simulation, which adds quite a bit of work and overhead. This is another OpenCL test, utilizing the OpenCL path for FAHCore 21.
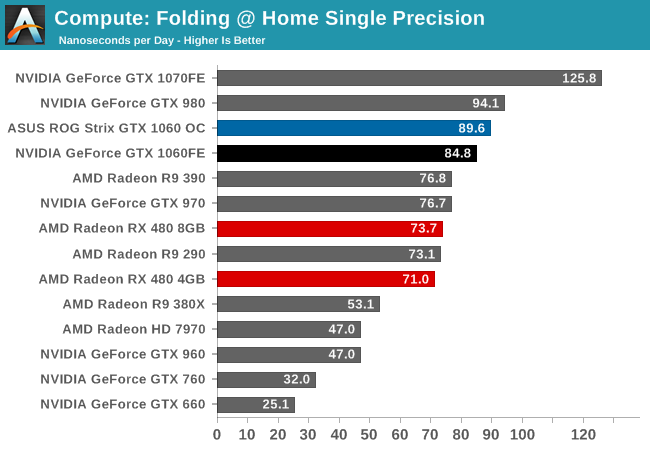
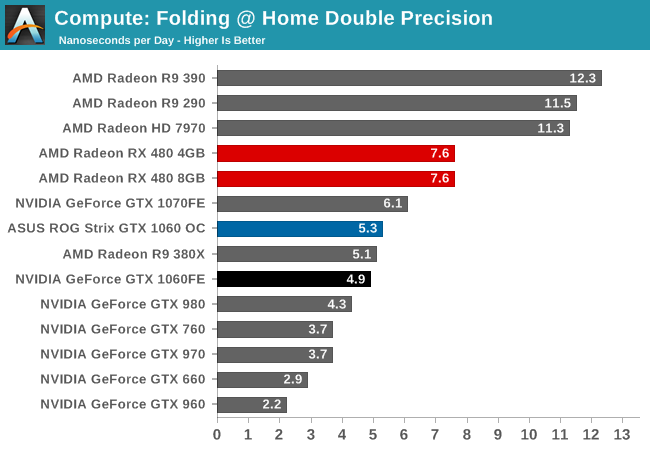
Finally, in Folding@Home, we see the usual split between single precision and double precision performance. GTX 1060 is solidly in the lead when using FP32, but NVIDIA’s poor FP64 rate means that if double precision is needed, RX 480 will pull ahead.


189 Comments
View All Comments
Leozn01 - Wednesday, August 10, 2016 - link
Why do you guys no longer include Sony Vegas Pro in your GPU reviews?Tech-Curious - Wednesday, August 10, 2016 - link
I've been watching the RX 480 and GTX 1060 on Newegg since about two days after the former's launch. In that time, I have seen the reference 8gb 480 flash in and out of stock 2-3 times.The only 480 that was consistently available was priced waaay over the MSRP (@ $300+, the one I can find right now is at $400). 4GB models, as far as I can tell, have been nonexistent. Most importantly for me, there has been no hint of an AiB-partner board available at a decent price.
By contrast, I've seen 1060s flash in and out of stock several times in the comparatively shorter period since the 1060 launch, many of them in the $250-260 range.
The kicker was when the 470 launched and all of a sudden there were a small army of overpriced third-party 470s occupying the market segment that 480's MSRP was supposed to cover.
So, reluctantly, I snapped up a $250 1060 to replace my aging 7850. I really wanted to buy an AMD card; I had been waiting for Polaris to launch for months -- but when you combine the 480's higher power consumption, its bad reference cooler, the initial PCI-power-delivery controversy, and the lack of stock/options for what has to be at least a month now, this is what happens.
Ryan's correct; neither company's exactly in a great spot with stock, but from a cheap seats it sure seems that nVidia executed better than AMD in the short term. Pity.
m16 - Sunday, August 14, 2016 - link
I personally love blower cards. They're the best for SLI in smaller cases, but here the only good thing about them is being able to put them in small cases to begin with because there's no SLI connector.Bummer, but I bet the cards are still flying off the shelves.
Gastec - Tuesday, August 16, 2016 - link
Are you joking me? A 215% increrase in performance over GTX 960 (in Rise of the Planet of the Tomb Raider Apes) !!! Something is fishy, I can't see the performance difference in the specs. A 50-55% increase OK,but more...smelly fishy fish.Dorothycar - Sunday, September 13, 2020 - link
https://failarmy.irvision.info/anvbdnx4kq-HZKg/the...">[img]https://i.ytimg.com/vi/9JuDGFaKR-E/hqdefault.jpg[/img]The https://failarmy.irvision.info/anvbdnx4kq-HZKg/the...">Top 100 Fails of the Year (2019)FailArmy
Tonyawrize - Wednesday, October 28, 2020 - link
https://azadsoz.rulosk.info/d-m-nin-n/loJ6pKqykpq3...">[img]https://i.ytimg.com/vi/4IGryQ0bTmg/hqdefault.jpg[/img]DГјЕџmЙ™nin Г¶n xЙ™tti yarД±ldД±. DayandД±rД±lmasa, https://azadsoz.rulosk.info/d-m-nin-n/loJ6pKqykpq3...">QarabaДџ tam azad olunacaq
YasminHef - Saturday, October 31, 2020 - link
https://movstudio.thmatch.info/2KhzaqO2rslodZk/s-r...">[img]https://i.ytimg.com/vi/uwB1BUyg8Dg/hqdefault.jpg[/img]สรุปเนื้аёаё«аёІ Speed เร็วกว่านรก - MOV https://movstudio.thmatch.info/2KhzaqO2rslodZk/s-r...">Studio
Estherbouts - Sunday, November 1, 2020 - link
https://wrestlechatter.mrcameras.info/roman-reigns...">[img]https://i.ytimg.com/vi/wpo4PEO6oj4/hqdefault.jpg[/img]Roman Reigns Winning Universal Title CONFIRMED, Jon Moxley #1 https://wrestlechatter.mrcameras.info/roman-reigns...">Superstar, Payback Match Card, Top 500
Marshalef - Monday, November 2, 2020 - link
https://apodrash.grgone.info/q99inqKpacVus2Q/me-k-...">[img]https://i.ytimg.com/vi/Gy0frp9a6R0/hqdefault.jpg[/img]ОњОµ ОєО¬О»ОµПѓО±ОЅ ПѓП„Ої Alpha https://apodrash.grgone.info/q99inqKpacVus2Q/me-k-...">(Happy Day 7:45 ПЂ.Ој)