The Intel Compute Stick (Core m3-6Y30) Review
by Ganesh T S on June 27, 2016 8:00 AM EST- Posted in
- Systems
- Intel
- Core M
- Skylake
- HDMI Stick
- Compute Stick
Performance Metrics - I
The Intel Core m3-6Y30 Compute Stick was evaluated using our standard test suite for low power desktops / industrial PCs. Not all benchmarks were processed on all the machines due to updates in our testing procedures. Therefore, the list of PCs in each graph might not be the same. In the first section, we will be looking at SYSmark 2014, as well as some of the Futuremark benchmarks.
BAPCo SYSmark 2014
BAPCo's SYSmark 2014 is an application-based benchmark that uses real-world applications to replay usage patterns of business users in the areas of office productivity, media creation and data/financial analysis. Scores are meant to be compared against a reference desktop (HP ProDesk 600 G1 with a Core i3-4130, 4GB RAM and a 500GB hard drive) that scores 1000 in each of the scenarios. A score of, say, 2000, would imply that the system under test is twice as fast as the reference system.
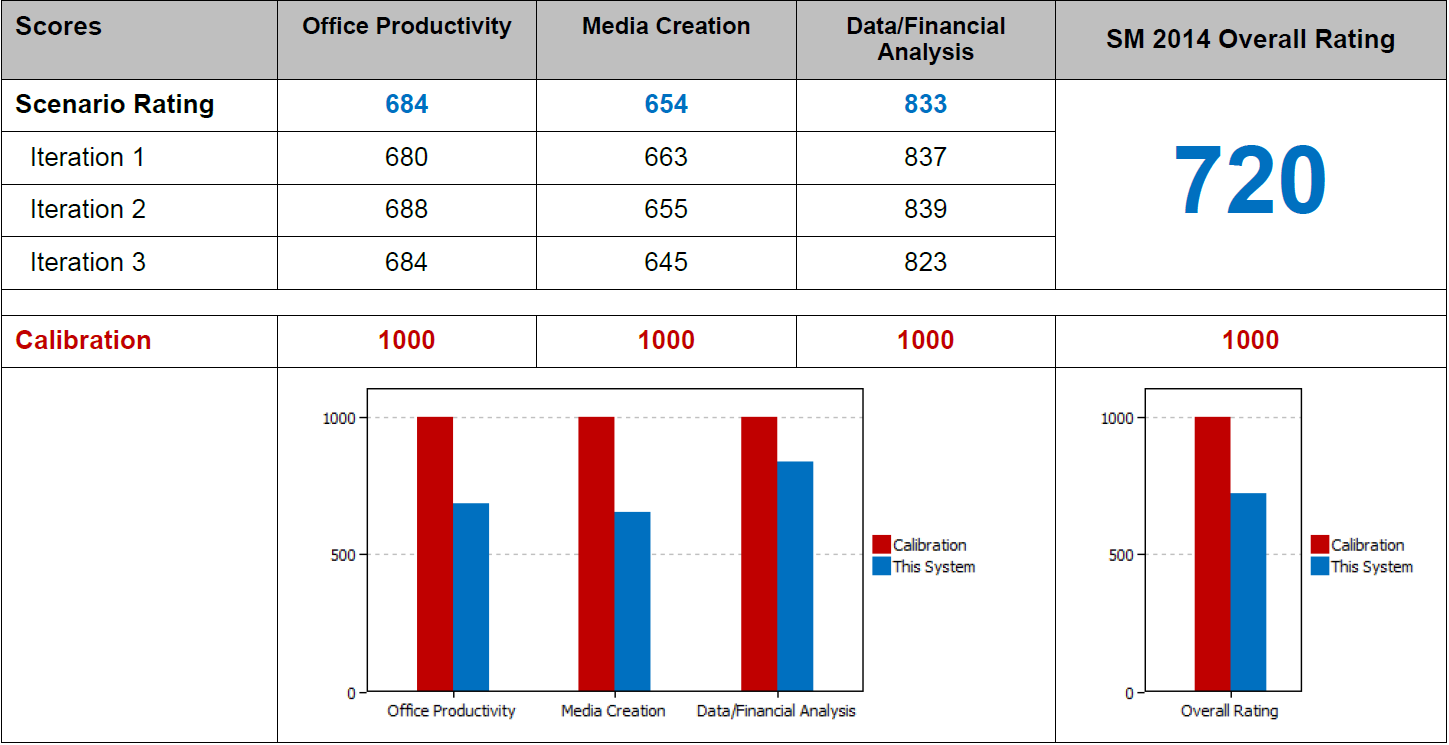
Since SYSmark 2014 was not processed on any of of the PCs in our comparison list, we present the scores obtained in the three iterations of the benchmark above. Obviously, a 7.5W TDP Skylake Core M is no match for a 54W Haswell Core i3. However, it still manages to delivery more than 70% of its performance for business workloads.
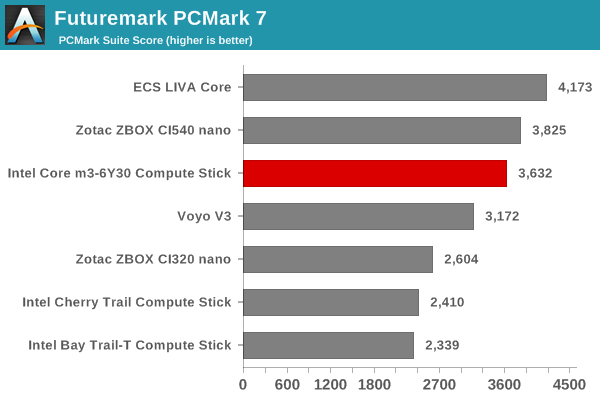
Futuremark PCMark 8
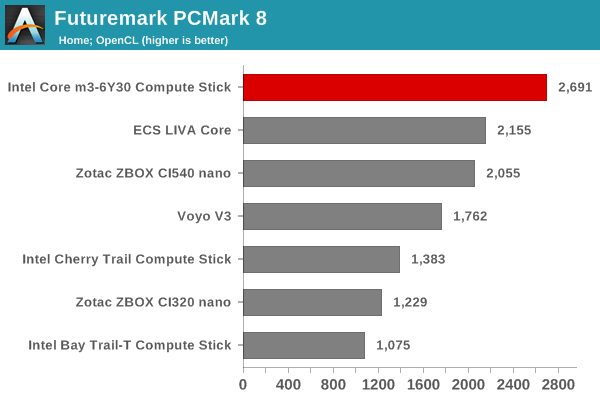
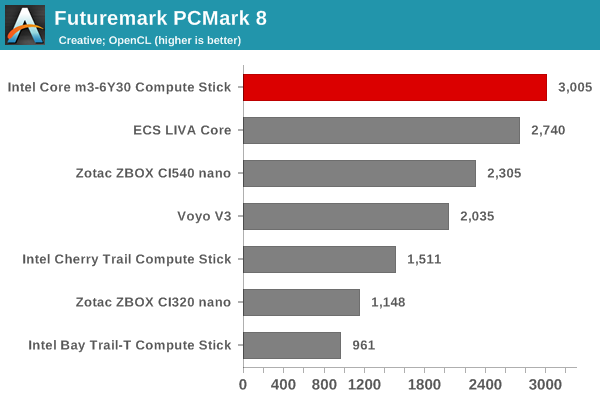
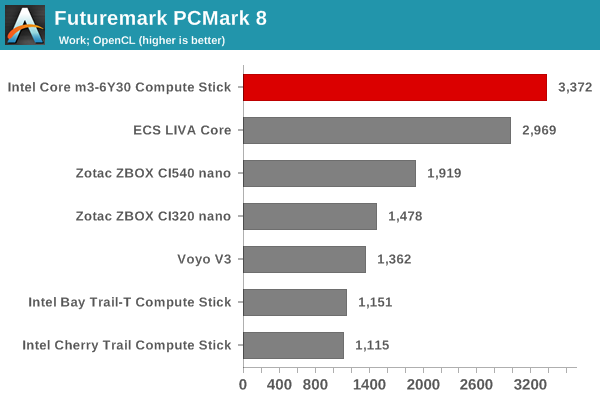
PCMark 8 provides various usage scenarios (home, creative and work) and offers ways to benchmark both baseline (CPU-only) as well as OpenCL accelerated (CPU + GPU) performance. We benchmarked select PCs for the OpenCL accelerated performance in all three usage scenarios. These scores are heavily influenced by the CPU in the system. Most of the PCs in our comparison list are equipped with anaemic Atom processors, and the Core m3-6Y30 manages to easily better them in performance despite the form factor limitation.
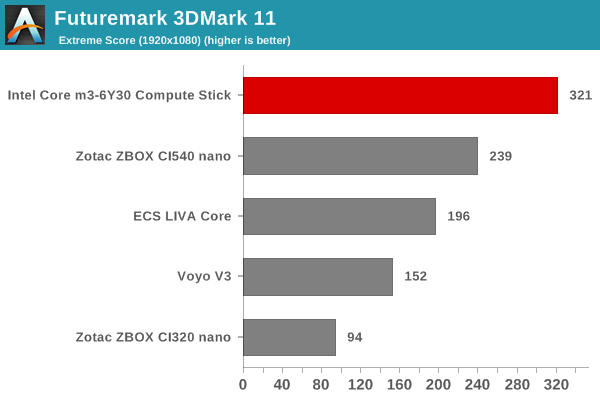
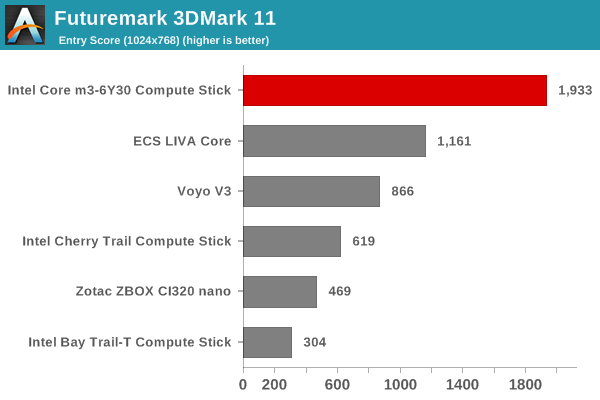
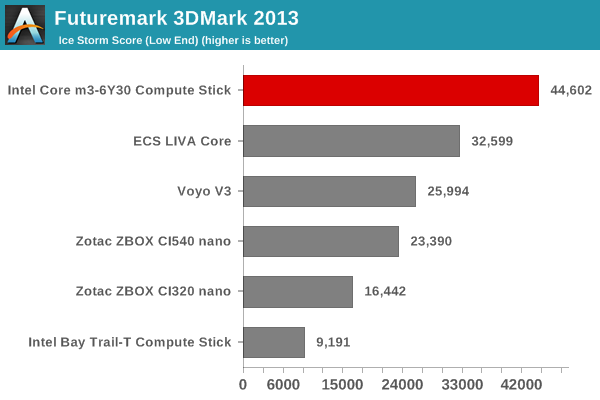
Miscellaneous Futuremark Benchmarks
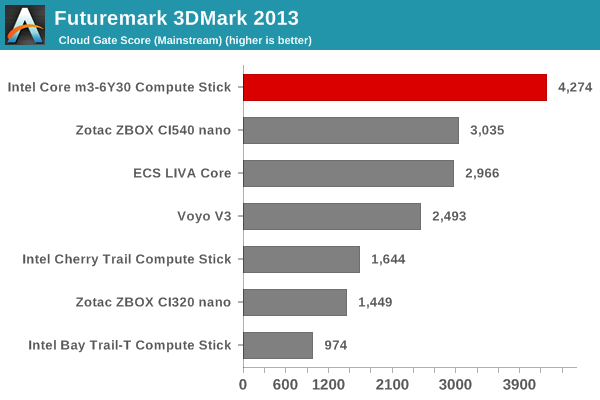
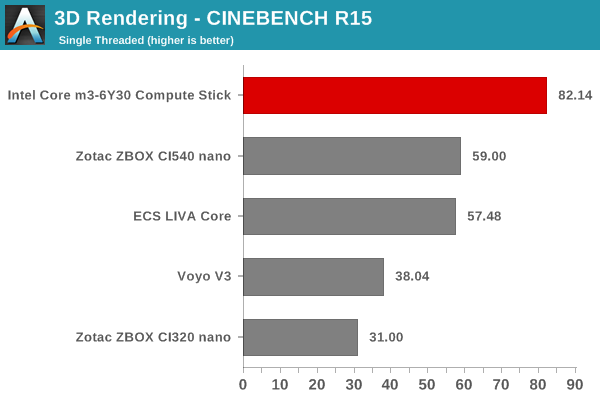
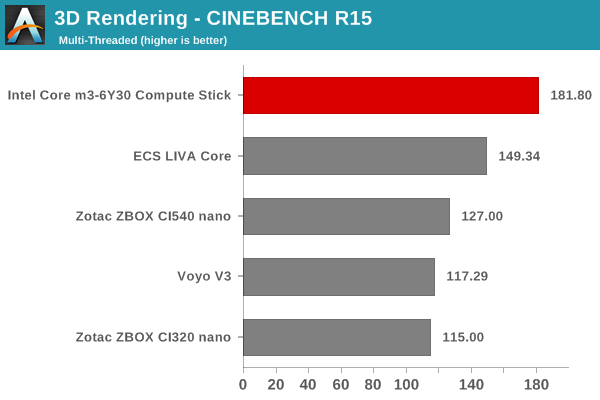
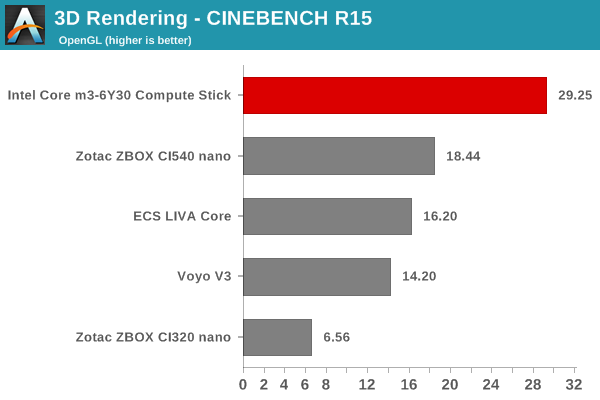
3D Rendering - CINEBENCH R15
We have moved on from R11.5 to R15 for 3D rendering evaluation. CINEBENCH R15 provides three benchmark modes - OpenGL, single threaded and multi-threaded. Evaluation of select PCs in all three modes provided us the following results.


105 Comments
View All Comments
okenny - Sunday, July 3, 2016 - link
True.what's with all the SSD reviews? I don't understand why SSDs are so interesting, an upgrade makes little or no difference to system performance unless you move from HDD to SSD or maybe from SATA to NVMe on PCIe or m.2. Don't get it.
okenny - Sunday, July 3, 2016 - link
hmmmm....no HDMI 2.0 at this price point, I'd buy something else like an nVidia Shield.Though I'd prefer Windows.
jakoh - Thursday, December 20, 2018 - link
How does this perform with 1080p Hevc?How is the H265 performance?
jakoh - Thursday, December 27, 2018 - link
Replying here, it’s remarkable at playing hevc content 1080p tested upto 2mbps. So happy with the performance. Thank you intel. It’s my dream media player.I am running Ubuntu 18. So easy to setup.
yeeeeman - Sunday, June 28, 2020 - link
Intel needs to make a lakefield version of this.