Investigating Cavium's ThunderX: The First ARM Server SoC With Ambition
by Johan De Gelas on June 15, 2016 8:00 AM EST- Posted in
- SoCs
- IT Computing
- Enterprise
- Enterprise CPUs
- Microserver
- Cavium
Benchmarks Versus Reality
Ever run into the problem that your manager wants a clear and short answer, while the real story has lots of nuances? (ed: and hence AnandTech) The short but inaccurate answer almost always wins. It is human nature to ignore complex stories and to prefer easy to grasp answers. The graph below is a perfect illustration of that. Although this one has been produced by Intel, almost everybody in the industry, including the ARM SoC companies, love the simplicity it affords in describing the competitive situation.
The graph compares the ICC compiled & published results for SPECint_rate_base2006 with some of the claimed (gcc compiled?) results of the ARM server SoC vendors.
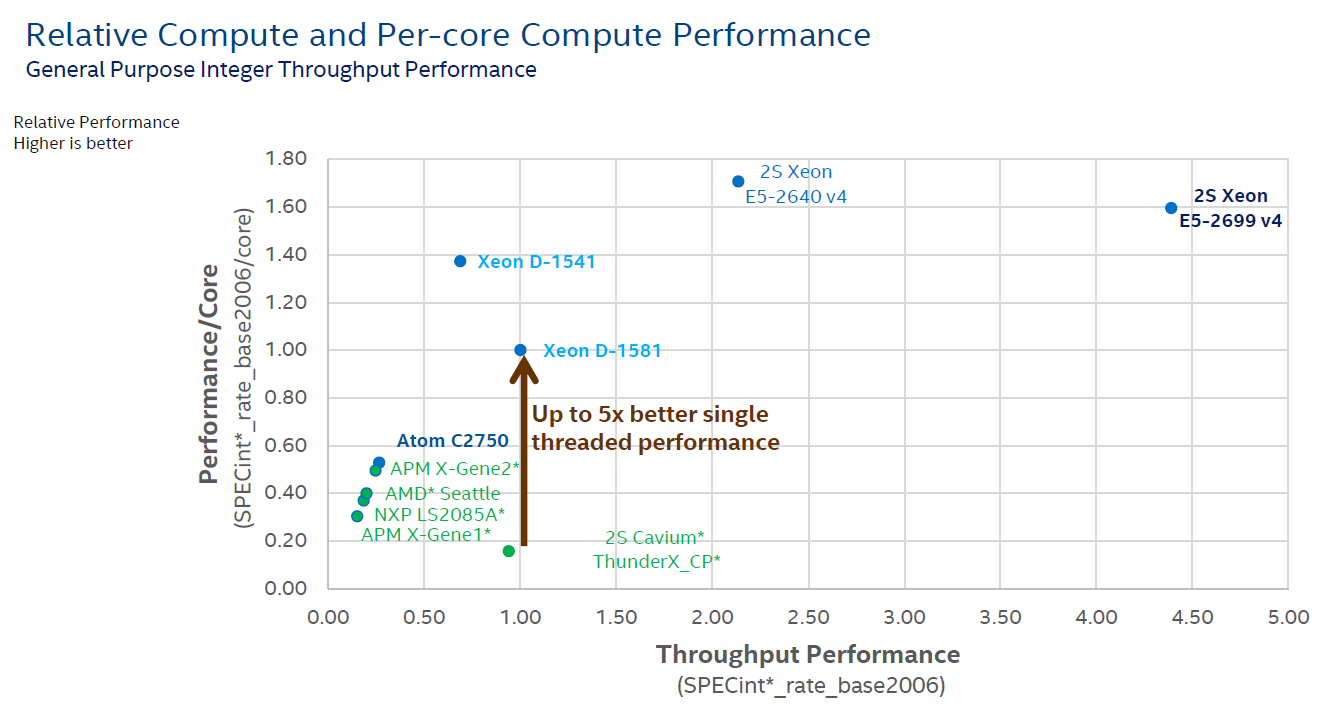
The graph shows two important performance vectors: throughput and single core performance. The former (X-axis) is self-explanatory, the latter (Y-axis) should give an indication of response times (latency). The two combined (x, y coordinate) should give you an idea on how the SoC/CPU performs in most applications that are not perfectly parallel. It is a very elegant way to give a short and crystal clear answer to anyone with a technical or scientific background.
But there are many drawbacks. The main problem is "single core performance". Since this is just diving the score by the number of cores, this favors the CPUs with some form of hardware multi-threading. But in many cases, the extra threads only help with throughput and not with latency. For example, if there are a few heavy SQL requests that keep you waiting, adding threads to a core does not help at all, on the contrary. So the graph above gives a 20% advantage to the SMT capable cores of Intel on y-axis, while hyperthreading is most of the time a feature that boosts throughput.
Secondly, dividing throughput by the number of cores means also that you favor the architectures that are able to run many instances of SPECint. In other words, it is all about memory bandwidth and cache size. So if a CPU does not scale well, the graph will show a lower per core performance. So basically this kind of graph creates the illusion of showing two performance parameters (throughput and latency), but it is in fact showing throughput and something that is more related to throughput (throughput normalized per core?) than latency. And of course, SPECint_rate is only a very inaccurate proxy for server compute performance: IPC is higher than in most server applications and there is too much emphasis on cache size and memory bandwidth. Running 32 parallel instances of an application is totally different from running one application with 32 threads.
This is definitely not written to defend or attack any vendor: many vendors publish and abuse these kind of graphs to make their point. Our point is that it is very likely that this kind of graph gives you a very inaccurate and incomplete view of the competition.
But as the saying goes, the proof is in the pudding, so let's put together a framework for comparing these high level overviews with real world testing. First step, let's pretend the graph above is accurate. So the Cavium ThunderX has absolutely terrible single threaded performance: one-fifth that of the best Xeon D, not even close to any of the other ARM SoCs. A ThunderX core cannot even deliver half the performance of an ARM Cortex-A57 core (+/- 10 points per core), which is worse than the humble Cortex-A53. It does not get any better: the throughput of a single ThunderX SoC is less than half of the Xeon D-1581. The single threaded performance of the Xeon D-1581 is only 57% of the Xeon E5-2640's and it cannot compete with the throughput of even a single Xeon E5-2640 (2S = 2.2 times the Xeon-D 1581).
Second step, do some testing instead of believing vendor claims or published results from SPEC CPU2006. Third step, compare the graph above with our test results...


82 Comments
View All Comments
willis936 - Thursday, June 16, 2016 - link
Are you sure that the there are more cores at lower clocks to keep voltage lower? Power consumption is proportional to v^2*f.ddriver - Friday, June 17, 2016 - link
Say what? Go back, read my previous post again, and if you are going to respond, make sure it is legible.willis936 - Friday, June 17, 2016 - link
Alright well if you don't understand why many slower cores are more power efficient even if there was a 0 cycle penalty on context switching then you aren't worth having this discussion with.blaktron - Wednesday, June 15, 2016 - link
48 cores of server processing on 16mb of l2 and 4 channels of RAM? What is this thing designed for. Will be like running single channel celerons as server processors, so decent hypervisor hosts are out, and so is any database work more complex than dynamic web pages.Haravikk - Wednesday, June 15, 2016 - link
Facebook is specifically mentioned as being interested in this, so dynamic web-pages is definitely a valid use-case here. HHVM for example is pretty light on memory usage (so is PHP7 now), especially in high demand cases where you're really only running a single set of scripts, probably cached in a compiled form, plus both scale really well across as many cores as you can throw at them.Things like nginx and MariaDB will be the same, so they're absolutely intended use-cases for this kind of chip, and I think it should be very good at it.
blaktron - Wednesday, June 15, 2016 - link
With no L3 and slow RAM access I'm not sure where you think the scrips will cache. Assuming you ran them on bare metal (horrifying waste of compute) there would be enough, but if you had docker instances or quick spin vms doing your work (as 99% of web servers are) then each instance will only get the tiniest slice of cache to work with. It would be like running your servers, as I said, on a bank of celerons. Except celerons have L3 and don't carry 12 cores per memory channel.spaceship9876 - Wednesday, June 15, 2016 - link
Hopefully someone will release a server chip using 64 cortex A73 cpu cores, i'm pretty sure the cortex a73 will be more power efficient than xeon d. Xeon d beats cortex a57 in power efficiency but i'm pretty sure than cortex a72 will be similar and cortex a73 will beat it.Flunk - Wednesday, June 15, 2016 - link
ARM with ambition?I've heard that before, nothing came of it.
CajunArson - Wednesday, June 15, 2016 - link
Interesting article. This does appear to be the first semi-credible part from an ARM server vendor.Having said that, the energy efficiency table at the end should put to rest any misconceived notions that ARM is somehow magically energy efficient while X86 isn't.
Considering that Xeon E5-2690 v3 is a 4.5 year old Sandy Bridge part made on a 32 nm process and it still has better performance-per-watt than the best ARM server parts available in 2016, it's pretty obvious that Intel has done an excellent job with power efficiency.
kgardas - Wednesday, June 15, 2016 - link
2 CajunArson: (1) you can't compare energy efficiency of CPUs made on different nodes. 28nm versus 14nm? This is apple to oranges. (2) Xeon E5-2690 *v3* is Haswell and not Sandy Bridge and it's not 4.5 years definitely.