The NVIDIA GeForce GTX 1080 & GTX 1070 Founders Editions Review: Kicking Off the FinFET Generation
by Ryan Smith on July 20, 2016 8:45 AM ESTCompute
Shifting gears, let’s take a look at compute performance on Pascal.
Overall, we’re not expecting a significant difference in compute performance compared to Maxwell 2 for standard compute benchmarks. The fundamental architecture hasn’t changed – the CUDA cores, register files, and caches still behave as before - so there’s little reason for compute performance to shift. GP104 for all intents and purposes should perform like a higher clocked and slightly wider Maxwell 2, similar to what we’ve seen in most games.
However in the long run there is potential for Pascal to show some improvements. The architecture’s improved scheduling features are geared in part towards HPC users, and instruction level preemption means that compute kernels can now be a lot more aggressive on consumer systems since they can be paused so easily. That said, to really leverage any of these improvements, applications utilizing GPU compute need to have work that benefits from better scheduling and be written with Pascal in mind, and for consumer workloads the latter is likely a long way off.
Starting us off for our look at compute is LuxMark3.1, the latest version of the official benchmark of LuxRender. LuxRender’s GPU-accelerated rendering mode is an OpenCL based ray tracer that forms a part of the larger LuxRender suite. Ray tracing has become a stronghold for GPUs in recent years as ray tracing maps well to GPU pipelines, allowing artists to render scenes much more quickly than with CPUs alone.
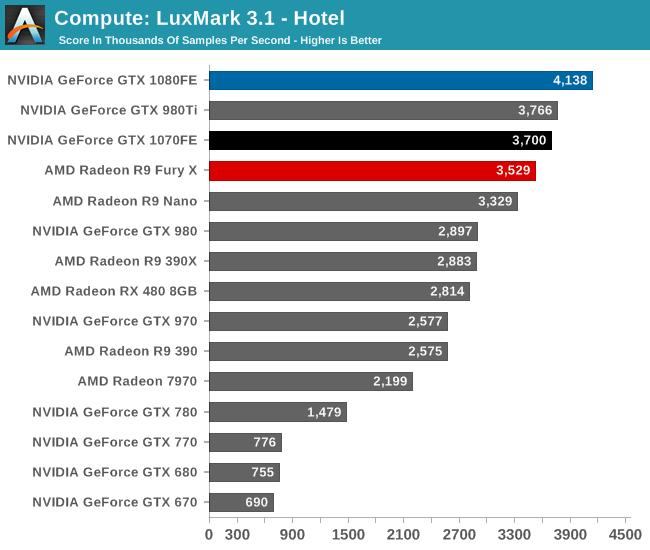
As with games, when it comes to LuxMark, the GTX 1080 is uncontested; this is the first high performance FinFET GPU in action. That said, I’m surprised by how close some of these results cluster. Though GTX 1080 is not a full generational replacement for GTX 980 Ti, normally it outperforms the Big Maxwell card by more than this. Instead we’re looking at a lead of just 10%, notably less than a simple extrapolation of CUDA core counts and frequencies would tell us to expect (GTX 1080 has almost 50% more FLOPs).
That said, GTX 1070 still places very close to GTX 980 Ti – albeit below it – so what we’re seeing isn’t just Pascal being a laggard. Especially since as a consequence of this, GTX 1080 only beats GTX 1070 by 12%. In any case, this may be a case of early drivers, particularly as OpenCL has not been an NVIDIA priority for the last couple of years. Alternatively, as strange as it may be, I’m not ready to rule out LuxMark being CPU limited. It’s something that we’ll have to keep an eye on.
For our second set of compute benchmarks we have CompuBench 1.5, the successor to CLBenchmark. CompuBench offers a wide array of different practical compute workloads, and we’ve decided to focus on face detection, optical flow modeling, and particle simulations.
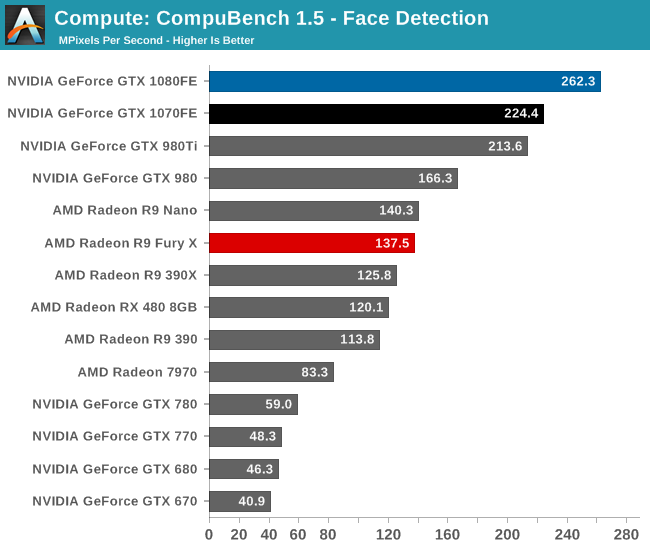
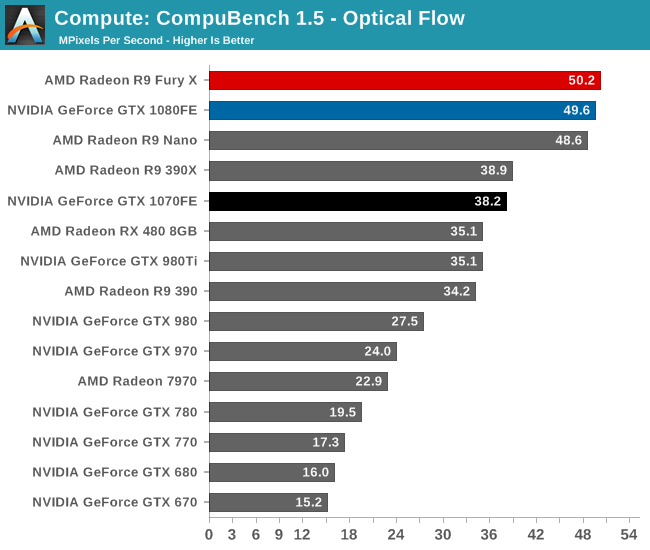
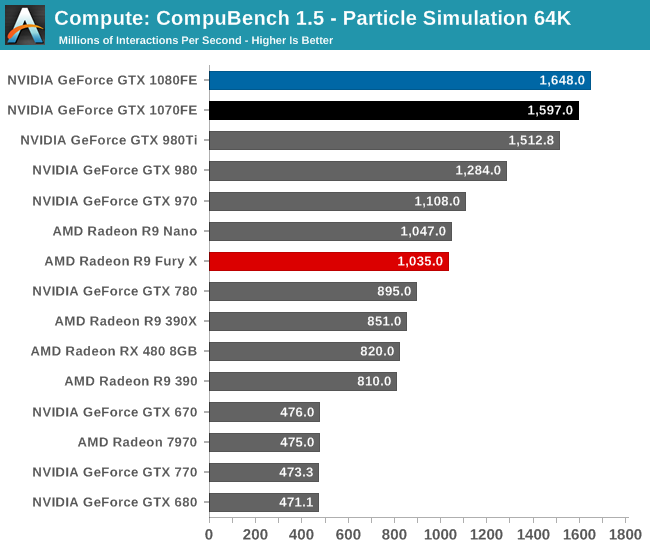
Depending on which sub-test we’re looking at, CompuBench is all over the place. In Face Detection the GTX 1080 takes a commanding lead, with GTX 1070 easily slotting into second place. On the other hand we have Optical Flow, which NVIDIA cards have traditionally struggled with, where even GTX 1080 can’t unseat Radeon Fury X. Finally in the middle we have the 64K Particle Simulation, which has GTX 1080 in the lead again, but not unlike LuxMark, it also has some interesting clustering going on.
Ultimately each test stresses our GPU collection in different ways, which as we can see greatly influences how the results pan out. Face Detection has always played well to NVIDIA’s strengths, and on a generational basis we get solid scaling from Maxwell 2 to Pascal. Even Optical Flow, which seems to favor raw FLOPs more than anything else, still shows very good gains with Pascal.
Particle Simulation is the outlier in this regard; Pascal’s generational gains are not insignificant, but they’re less than what we’d expect. Furthermore GTX 1080 and GTX 1070 are very closely clustered together despite their much larger difference in FLOPs. This may mean we’re looking at a CPU or driver bottleneck, or possibly some sort of internal path bottleneck. GTX 1080 has more FLOPs and a similar advantage in memory bandwidth, but once you get on chip things get much closer. If nothing else this goes to show that compute benchmarks are much more architecture sensitive than games, which is why we can’t make very broad generalizations for all compute workloads.
Moving on, our 3rd compute benchmark is the next generation release of FAHBench, the official Folding @ Home benchmark. Folding @ Home is the popular Stanford-backed research and distributed computing initiative that has work distributed to millions of volunteer computers over the internet, each of which is responsible for a tiny slice of a protein folding simulation. FAHBench can test both single precision and double precision floating point performance, with single precision being the most useful metric for most consumer cards due to their low double precision performance. Each precision has two modes, explicit and implicit, the difference being whether water atoms are included in the simulation, which adds quite a bit of work and overhead. This is another OpenCL test, utilizing the OpenCL path for FAHCore 21.
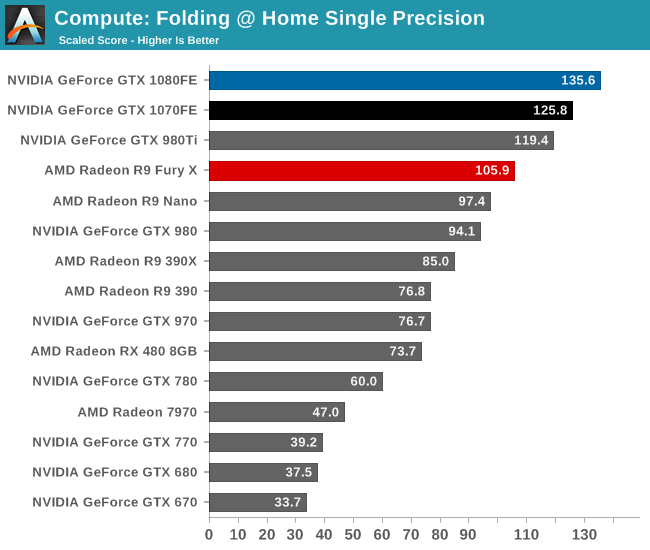
In single precision performance, to the surprise of no one the GTX 1080 is solidly in the lead, followed up by the GTX 1070. On a generational basis performance gains are decent, but at 44% for GTX 1080 they aren’t quite as great as we’ve seen from the card elsewhere. Meanwhile the two Pascal cards are again closer than we’d expect, with GTX 1080 leading by only 10%.
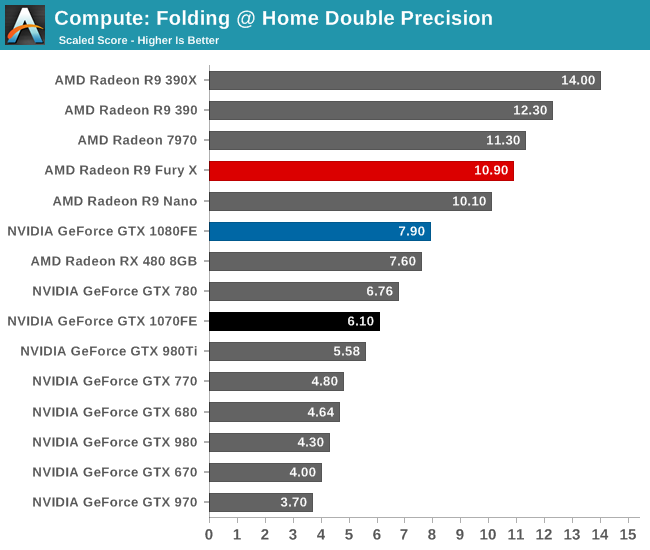
As for double precision performance, we can see that even with the higher overall compute throughput of GP104, it still can’t make up for the fact that FP64 performance on the GPU is capped at 1/32 by virtue of so few FP64 CUDA cores, which puts even NVIDIA’s latest and greatest at a disadvantage here. But if nothing else, generational scaling versus Maxwell 2 looks very good, with performance gains closely tracking the theoretical increase in FLOPs.


200 Comments
View All Comments
TestKing123 - Wednesday, July 20, 2016 - link
Then you're woefully behind the times since other sites can do this better. If you're not able to re-run a benchmark for a game with a pretty significant patch like Tomb Raider, or a high profile game like Doom with a significant performance patch like Vulcan that's been out for over a week, then you're workflow is flawed and this site won't stand a chance against the other crop. I'm pretty sure you're seeing this already if you have any sort of metrics tracking in place.TheinsanegamerN - Wednesday, July 20, 2016 - link
So question, if you started this article on may 14th, was their no time in the over 2 months to add one game to that benchmark list?nathanddrews - Wednesday, July 20, 2016 - link
Seems like an official addendum is necessary at some point. Doom on Vulkan is amazing. Dota 2 on Vulkan is great, too (and would be useful in reviews of low end to mainstream GPUs especially). Talos... not so much.Eden-K121D - Thursday, July 21, 2016 - link
Talos Principle was a proof of conceptajlueke - Friday, July 22, 2016 - link
http://www.pcgamer.com/doom-benchmarks-return-vulk...Addendum complete.
mczak - Wednesday, July 20, 2016 - link
The table with the native FP throughput rates isn't correct on page 5. Either it's in terms of flops, then gp104 fp16 would be 1:64. Or it's in terms of hw instruction throughput - then gp100 would be 1:1. (Interestingly, the sandra numbers for half-float are indeed 1:128 - suggesting it didn't make any use of fp16 packing at all.)Ryan Smith - Wednesday, July 20, 2016 - link
Ahh, right you are. I was going for the FLOPs rate, but wrote down the wrong value. Thanks!As for the Sandra numbers, they're not super precise. But it's an obvious indication of what's going on under the hood. When the same CUDA 7.5 code path gives you wildly different results on Pascal, then you know something has changed...
BurntMyBacon - Thursday, July 21, 2016 - link
Did nVidia somehow limit the ability to promote FP16 operations to FP32? If not, I don't see the point in creating such a slow performing FP16 mode in the first place. Why waste die space when an intelligent designer can just promote the commands to get normal speeds out of the chip anyways? Sure you miss out on speed doubling through packing, but that is still much better than the 1/128 (1/64) rate you get using the provided FP16 mode.Scali - Thursday, July 21, 2016 - link
I think they can just do that in the shader compiler. Any FP16 operation gets replaced by an FP32 one.Only reading from buffers and writing to buffers with FP16 content should remain FP16. Then again, if their driver is smart enough, it can even promote all buffers to FP32 as well (as long as the GPU is the only one accessing the data, the actual representation doesn't matter. Only when the CPU also accesses the data, does it actually need to be FP16).
owan - Wednesday, July 20, 2016 - link
Only 2 months late and published the day after a different major GPU release. What happened to this place?