The NVIDIA GeForce GTX 1080 & GTX 1070 Founders Editions Review: Kicking Off the FinFET Generation
by Ryan Smith on July 20, 2016 8:45 AM ESTPower, Temperature, & Noise
Having finished our look at GTX 1080 and GTX 1070’s rendering and compute performance, it’s time to take a look at power, temperature, and noise. Next to price and performance of course, these are some of the most important aspects of a video card, due in large part to the impact of noise. All things considered, a loud card is undesirable unless there’s a sufficiently good reason – or sufficiently good performance – to ignore the noise.
It goes without saying that with a new architecture on a new manufacturing node, Pascal is significantly different from Maxwell when it comes to voltages and clockspeeds. Even without radically changing the underlying processing architecture, the combination of FinFETs and NVIDIA’s desire to drive up the clockspeed means that Pascal and the GP104 GPU are going to behave in new and different ways from Maxwell. Back in our look at GPU Boost 3.0, we already saw how the two GP104 cards are more temperature sensitive than GM204, backing off on clockspeed and voltage by a few bins as the card warmed up to 70C. And this isn’t the only surprise in store.
| GeForce Video Card Voltages | |||||
| GTX 1080/1070 Boost | GTX 980 Boost | GTX 1080/1070 Idle | GTX 980 Idle | ||
| 1.062v | 1.225v | 0.625v | 0.856v | ||
Though we often treat FinFET as the solution to planar’s scaling problems, FinFET is more than just a means to enable 20nm/16nm geometry. It’s also a solution in and of itself to voltages. As a result, GP104’s operating voltages are significantly lower than GM204’s. Idle voltage in particular is much lower; whereas GTX 980 idled at 0.856v, the GP104 cards get to do so at 0.625v. Load voltages are also reduced, as GM204’s 1.225v boost voltage is replaced with GP104’s 1.062v boost voltage.
Now voltage alone isn’t the whole picture; what we don’t see from a high level view is how amperage has changed (answer: it went up), so power consumption hasn’t dropped by nearly as much as the voltage alone has. Still, it will be interesting to see what this means for the mobile versions of NVIDIA’s GPUs, as voltage drops have traditionally proven rather beneficial for idle power consumption.
There is a double-edged sword aspect to all of this though: FinFET doesn’t just allow lower voltages, but it essentially requires it. The FinFET transistors can’t take a punishment like TSMC’s 28nm transistors can, and in discussing the architecture and process with NVIDIA, they have confirmed that the voltage/frequency curve for 16nm FinFET is steeper than 28nm. For general consumers this shouldn’t matter, but for hardcore overclockers there’s going to be a learning process to find just what kind of voltages GP104 can take, and whether those voltages can enable significantly higher clockspeeds.
Speaking of clockspeeds, let’s take a look at the average clockspeeds during our testing. As we saw earlier, NVIDIA has designed Pascal to clock much higher than Maxwell, and here we can quantify that. Though before getting to the numbers, it should be noted that both the GTX 1080FE and GTX 1070FE do reach NVIDIA’s 83C throttle point under sustained load, so these frequencies are somewhat dependent on environmental temperature.
| GeForce Video Card Average Clockspeeds | ||||
| Game | GTX 1080 | GTX 1070 | GTX 980 | |
| Max Boost Clock |
1898MHz
|
1898MHz
|
1252MHz
|
|
| Tomb Raider |
1721MHz
|
1721MHz
|
1177MHz
|
|
| DiRT Rally |
1771MHz
|
1797MHz
|
1202MHz
|
|
| Ashes |
1759MHz
|
1797MHz
|
1215MHz
|
|
| Battlefield 4 |
1771MHz
|
1771MHz
|
1227MHz
|
|
| Crysis 3 |
1759MHz
|
1759MHz
|
1177MHz
|
|
| The Witcher 3 |
1759MHz
|
1759MHz
|
1215MHz
|
|
| The Division |
1721MHz
|
1771MHz
|
1189MHz
|
|
| Grand Theft Auto V |
1797MHz
|
1822MHz
|
1215MHz
|
|
| Hitman |
1771MHz
|
1797MHz
|
1202MHz
|
|
As a percentage of the maximum boost clock, the average clockspeeds of the the GTX 1080 and GTX 1070 both drop more significantly than with GTX 980, where the latter only drops a few percent from its maximum. This is due to a combination of the temperature compensation effect we discussed earlier and both cards hitting 83C (though so does GTX 980). Either way both cards are still happily running in the 1700MHz range, and the averages for both cards remain north of NVIDIA’s official boost clock. Though this does give us a good idea as to why the official boost clock is so much lower than the cards’ maximum boost clocks.
It’s interesting to see that despite its lower rated clockspeeds, GTX 1070 actually averages a bin or two higher than GTX 1080. As our samples have identical maximum boost clocks – something I should note is not guaranteed, as the maximum boost clock varies from card to card – we get a slightly more apples-to-apples comparison here. GTX 1070 has a lower TDP, which can hurt its ability to run at its highest clocks, but at the same time it’s a partially disabled GPU, which can reduce power consumption. Meanwhile the GTX 1070’s cooler is a bit less sophisticated than the GTX 1080s – losing the vapor chamber for heatpipes – but on the whole it’s still a very powerful cooler for a 150W card. As a result our GTX 1070 sample is able to get away with slightly better boosting than GTX 1080 in most situations. This means that the cards’ on-paper clockspeed differences are generally nullified and aren’t a factor in how the cards’ overall performance differs.
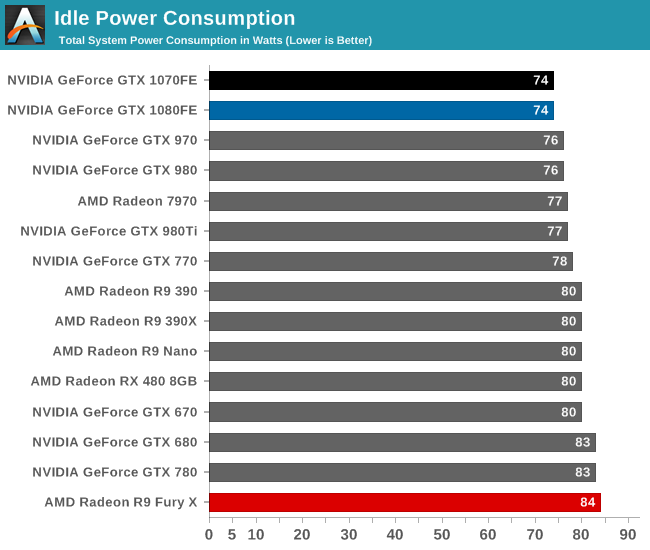
With clockspeeds out of the way, let’s get down to business with power numbers. Starting with idle power consumption, the GTX 1080FE and GTX 1070FE both top the charts. Bear in mind that this is a system level reading taken at the wall, so we’re hitting diminishing returns here with increasingly low powered cards, but regardless it’s interesting that system power with both cards is a couple of watts lower than their GM204 counterparts. As I’ve said before, I’m very interested in seeing what Pascal and FinFET does for laptops, which are especially sensitive to this.
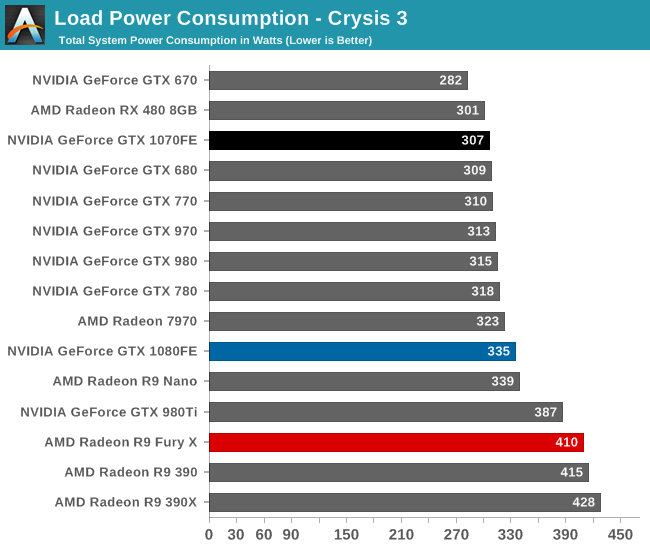
Ramping up to load power we have Crysis 3. This provides us with a solid look at gaming power consumption, as Crysis 3’s world simulation is stable over long periods of time, and benchmark performance is decently close to the average difference in the relative performance between cards. For better or worse, this benchmark also captures the CPU impact of performance; a GPU that can produce a higher framerate also requires the CPU to work harder to feed it frames.
In the middle of the pack is the GTX 1080FE, with 335W at the wall. This is 20W more than GTX 980, and this is due to a couple of factors. The first of which is that GTX 1080FE is an outright higher TDP card, rated for 180W TDP as compared to GTX 980’s 165W TDP. On a relative basis NVIDA’s TDPs have been rather consistent/reliable since Kepler, so it’s safe to attribute a lot of this difference to the increase in the official TDP.
Overall I’m actually a bit surprised that given the higher TDP and much higher performance of the card that the increase at the wall for GTX 1080FE is only 20W. If anything I would have expected the CPU power impact to be more pronounced. But at any rate, compared to GTX 980 there is a real increase in power consumption while gaming. Though with that said, if we were to plot watts per frame here, GTX 1080FE would be the leader by far; it’s drawing a bit more power than GTX 980, and delivering performance well in excess of the 388W GTX 980 Ti.
As for GTX 1070, it comes close to topping this chart. The 150W card leads to a total system power draw of 307W, trailing only lower performing cards like Radeon RX 480 and GeForce GTX 670. Taking performance into consideration, it’s almost too easy to forget that this is for what is the second fastest card on the market, and it draws less power than virtually any other DX12-era high performance card. In fact given its very close performance to GTX 980 Ti, perhaps the better comparison is there, in which case we’re looking at a savings of 80W at the wall. So 307W is definitely impressive, and a reminder of how great it is to get off of 28nm.
Looking at some inter-card comparisons, the difference compared to the GTX 970 actually puts the GTX 1070FE ahead by 6W. However I am a bit hesitant here to make too strong of a comparison since NVIDIA did not release and sample a reference GTX 970 card, so our reprogrammed EVGA card isn’t quite an apples-to-apples comparison. But more apples-to-apples is GTX 1080FE vs GTX 1070FE; very close to NVIDIA’s TDP ratings, the difference at the wall is 28W, affirming that GTX 1070FE delivers less performance, but it draws less power at the same time. Though with this in mind, it does mean that GTX 1070FE isn’t quite as efficient overall as GTX 1080FE; 30W in power savings is outpaced by the 20-25% performance drop.
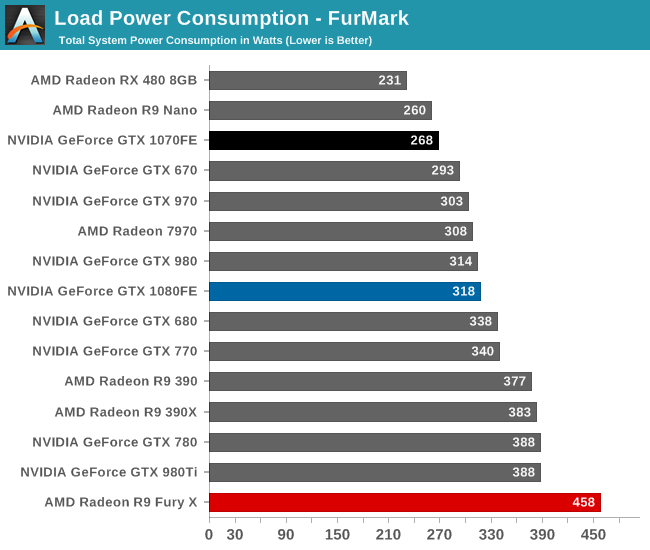
Shifting over to FurMark, we have a more holistic look at GPU power consumption. What we see here isn’t real world – FurMark is a synthetic test designed to max out virtually every aspect of the GPU – but it gives us an idea of what maximum power consumption should be like.
Starting with GTX 1080FE, it’s interesting that it’s only making a 4W difference at the wall. This test is nominally TDP limited, but in practice for NVIDIA’s reference blower you will eventually hit 83C and you will have to throttle more than you get there. This means that we’re essentially looking at a proxy test for the cooler; to sustain your TDP limit, you need to be able to dissipate all of the heat that comes with that.
Bearing in mind that there is going to be some uncontrollable card-to-card variation, what these results hint at is that GTX 1080FE’s blower isn’t much better than GTX 980’s, despite the use of a vapor chamber cooler. Or at least, it isn’t tuned to dissipate much more heat than GTX 980 and may be operating on the conservative side. In any case, this puts worst case power consumption in the middle of the pack, significantly ahead of NVIDIA’s 250W cards and about even with GTX 980.
Meanwhile GTX 1070FE is once again near the top of the charts, behind only the Radeon R9 Nano and RX 480. I’ll skip the GTX 970 comparison due to the aforementioned sample differences and instead move on to the GTX 1080FE comparison, in which case the 50W difference at the wall ends up being quite surprising since it’s greater than the formal TDP difference. This will make a bit more sense once we get to temperatures, but what we’re looking at is a combination of GTX 1070FE being purely TDP limited – it doesn’t reach the card’s thermal throttle point – and undoubtedly some card-to-card variation in GTX 1070FE’s favor. Either way these results are consistent, and for the GTX 1070FE consistently awesome.
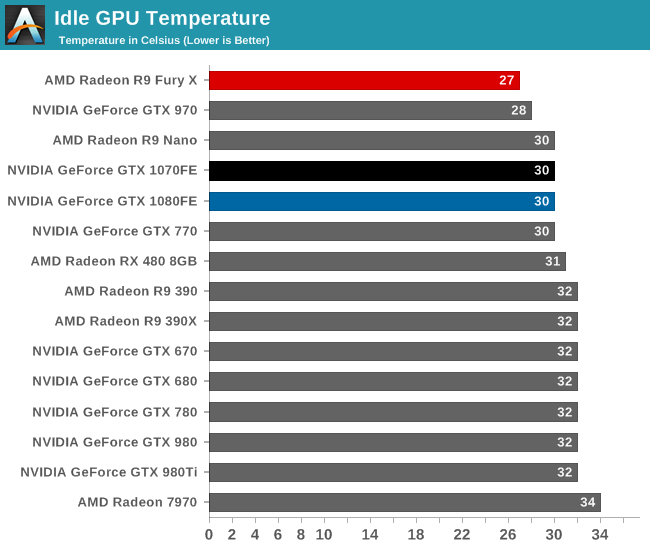
Up next we have idle temperatures. With NVIDIA retaining the same basic design of their reference blowers, there are no big surprises here. Both cards idle at 30C.
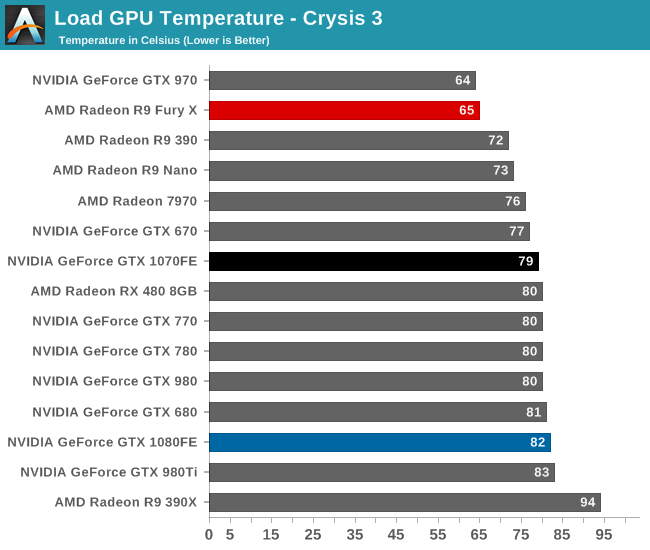
As for Crysis 3, we also see performance similar to other NVIDIA blowers, with both cards topping out at around 80C. It is interesting to note though that neither card reaches the 83C thermal throttle point – though the GTX 1080FE flirts with it – so what’s limiting the performance of these cards is primarily a combination of TDP and running out of turbo bins (or as GPU-Z calls it, VREL).
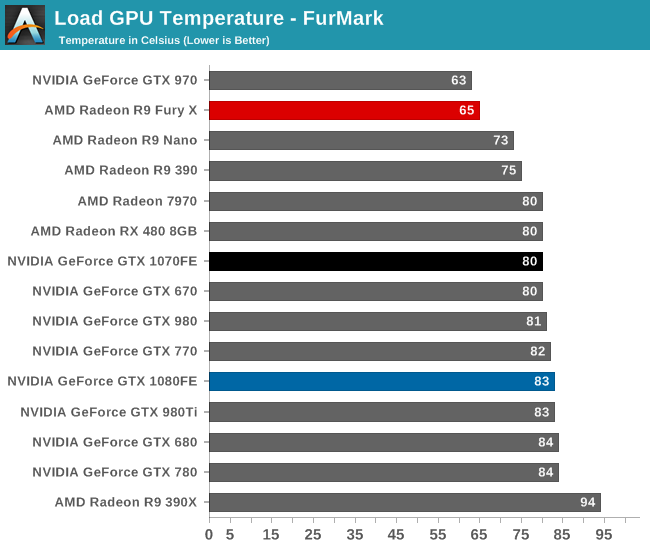
With FurMark the results are similar to above. Both cards reach the 80s, though only GTX 1080FE hits the 83C thermal throttle point. GTX 1070FE actually never reaches that point, which means that its cooler is more than powerful enough to keep up with its 150W TDP, as this should be the maximum load possible. This shouldn’t be too surprising, as the basic cooler design was previously used for the 165W GTX 980, so there’s a bit of additional headroom for a 150W board.
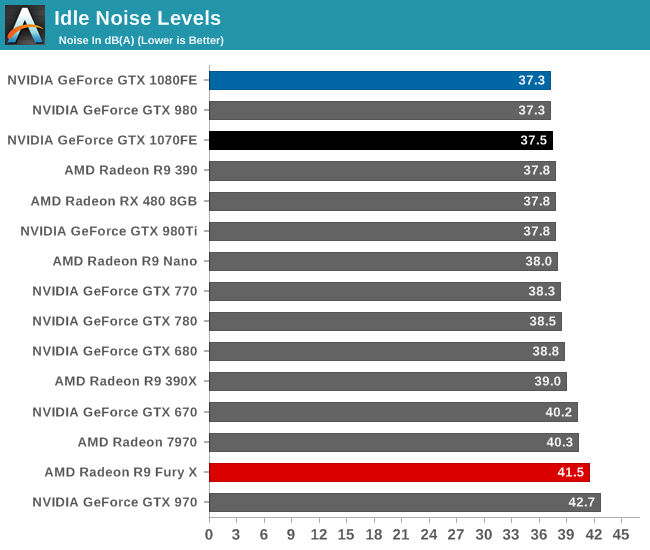
Last but not least, we have noise. As with the temperature situation, the reuse of NVIDIA’s blower design means that we already have a pretty good idea of what the cooler can do, and the only real question is how they’ve balanced it between performance and noise. But for idle noise in particular, what we’re looking at is the floor for what this cooler can do.
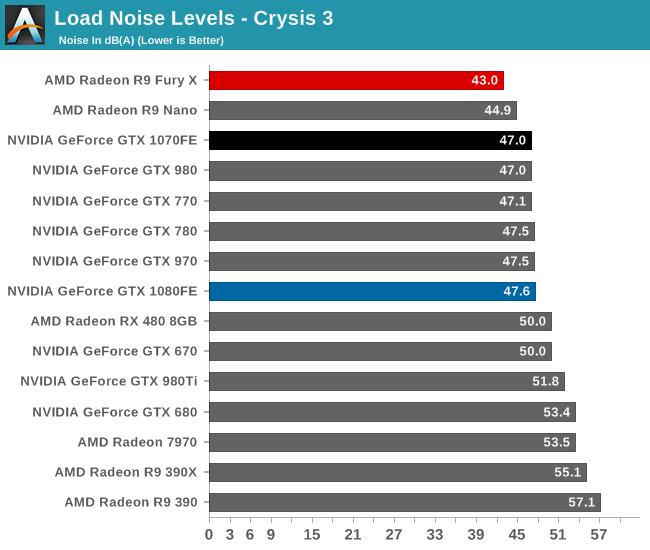
Moving to load noise, as it turns out NVIDIA has tuned the coolers on both cards to operate similarly to their past cards. At the 47dB(A) mark we find GTX 1070FE, GTX 980, GTX 770, GTX 780, our non-reference GTX 970, and finally GTX 1080FE at 47.6dB(A). What this indicates is that the acoustic profile under a gaming workload is exceedingly close to NVIDA’s past designs. A GTX 1080FE or GTX 1070FE is going to sound basically exactly like a sub-200W reference GTX 700 or 900 series card. Though this does make me suspect that the real-world cooling performance of all of these cards in terms of heat moved is also quite similar.
In any case, I’ve previous called this point NVIDIA’s sweet spot, and obviously this doesn’t change. NVIDIA’s blower continues to be unrivaled, making it possible to have a fully exhausting card without it being noisy. The only possible downside to any of this is that it means that despite its lower gaming performance relative to GTX 1080FE, GTX 1070FE isn’t really any quieter.
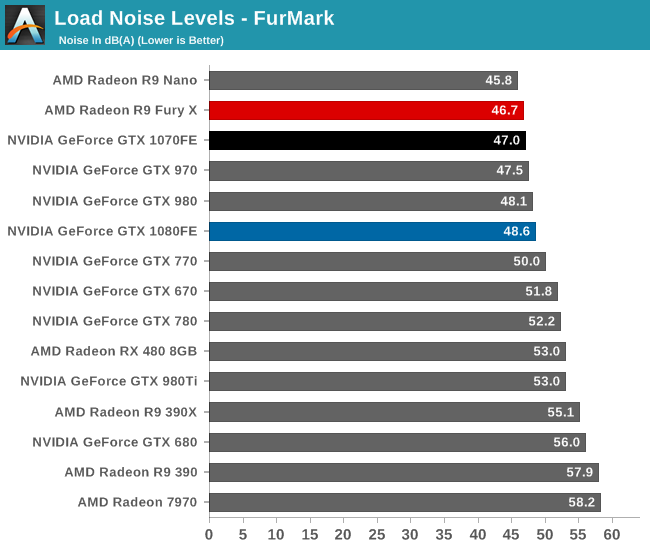
Finally, FurMark confirms our earlier observations. GTX 1070FE doesn’t even move compared to our Crysis 3 results. Meanwhile GTX 1080FE peaks a little higher – 48.6dB(A) – as it reaches 83C and the fan spins up a bit more to handle the heat.
In the end this may be the single most convicing argument for paying NVIDIA’s price premium for the Founders Edition cards. Like the GTX 900 and 700 series, when it comes to acoustics, NVIDIA has done a fantastic job building a quiet blower. We’ll undoubtedly see some quieter open air cards (in fact we already have some in for future testing), but open air cards have to forgo the near universal compatibility and ease of mind that comes from a blower.


200 Comments
View All Comments
Flunk - Wednesday, July 20, 2016 - link
The "stock" fan setup is the blower. The "founders edition" cards are the base reference cards.prophet001 - Wednesday, July 20, 2016 - link
Alrighty then. Thanks for the info.bill44 - Wednesday, July 20, 2016 - link
Where can I find Audio specification, sampling rates etc.? Decoding capabilities?ImSpartacus - Wednesday, July 20, 2016 - link
The timeline is appreciated.tipoo - Wednesday, July 20, 2016 - link
Sounds like a good few weeks here, well doneChaotic42 - Wednesday, July 20, 2016 - link
Thanks for the review. Some things are worth the wait. Turn your phone and computer off and go take a nap. Sounds like you've earned it.zeeBomb - Wednesday, July 20, 2016 - link
An anandtech review takes all the pain away! How am I going to read this casually though? Without all the detailed whachinlmicallitssna1970 - Wednesday, July 20, 2016 - link
Can you please add Cross Fire benchmarks in the RX480 review ?close - Wednesday, July 20, 2016 - link
But where's the GTX 1070/1080 review? Oh wait... Scratch that.blanarahul - Wednesday, July 20, 2016 - link
"this change in the prefetch size is why the memory controller organization of GP104 is 8x32b instead of 4x64b like GM204, as each memory controller can now read and write 64B segments of data via a single memory channel.*Shouldn't it be the opposite?
"Overall when it comes to HDR on NVIDIA’s display controller, not unlike AMD’s Pascal architecture"
What?!!!